


Dr. Miriam Lerma
@miriamlerma.bsky.social
Seabird researcher.
Currently at UK.
www.miriam-lerma.com
Available for hire on data and spatial analyses.
https://www.linkedin.com/in/miriam-lerma/
#seabirds #rstats #qgis #movementecology
Currently at UK.
www.miriam-lerma.com
Available for hire on data and spatial analyses.
https://www.linkedin.com/in/miriam-lerma/
#seabirds #rstats #qgis #movementecology
In this month's blog post, we’ll explore maritime protected areas (MPAs), walking through the process of downloading the data and visualizing it.
#Rstats #GeospatialAnalysis #DataVisualization #Rmaps
#Rstats #GeospatialAnalysis #DataVisualization #Rmaps

November 9, 2025 at 1:47 PM
In this month's blog post, we’ll explore maritime protected areas (MPAs), walking through the process of downloading the data and visualizing it.
#Rstats #GeospatialAnalysis #DataVisualization #Rmaps
#Rstats #GeospatialAnalysis #DataVisualization #Rmaps
In this blog post, we’ll explore maritime borders, including territorial waters and Exclusive Economic Zones (EEZ), by walking through the process of downloading the data and visualizing it. #Rstats #GeospatialAnalysis #DataVisualization #Rmaps

October 12, 2025 at 3:11 PM
In this blog post, we’ll explore maritime borders, including territorial waters and Exclusive Economic Zones (EEZ), by walking through the process of downloading the data and visualizing it. #Rstats #GeospatialAnalysis #DataVisualization #Rmaps
This month’s blog dives into underwater cables in the German North Sea. Using EMODnet data and R, I mapped telecom & power cables, exploring, cleaning, and visualizing the data to reveal these hidden seafloor infrastructures. #Rstats #GeospatialAnalysis #DataVisualization #cables #Rmaps

September 1, 2025 at 11:18 AM
This month’s blog dives into underwater cables in the German North Sea. Using EMODnet data and R, I mapped telecom & power cables, exploring, cleaning, and visualizing the data to reveal these hidden seafloor infrastructures. #Rstats #GeospatialAnalysis #DataVisualization #cables #Rmaps
In this post, we'll explore oil and gas infrastructure in the German North Sea. Using EMODnet geospatial data to map offshore installations and pipelines, as well as focusing on a site near the ecologically sensitive Borkum Reef, revealing why recent projects there have sparked environmental concern

August 4, 2025 at 8:52 AM
In this post, we'll explore oil and gas infrastructure in the German North Sea. Using EMODnet geospatial data to map offshore installations and pipelines, as well as focusing on a site near the ecologically sensitive Borkum Reef, revealing why recent projects there have sparked environmental concern
Curious about mapping offshore wind farms with R? This month, we explore EMODnet data from the German North Sea, create maps with ggplot2, and track wind farm growth before 2016. Perfect if you're into data, maps, or the ocean. #Rstats #GeospatialAnalysis #DataVisualization #OWF

July 1, 2025 at 9:15 AM
Curious about mapping offshore wind farms with R? This month, we explore EMODnet data from the German North Sea, create maps with ggplot2, and track wind farm growth before 2016. Perfect if you're into data, maps, or the ocean. #Rstats #GeospatialAnalysis #DataVisualization #OWF
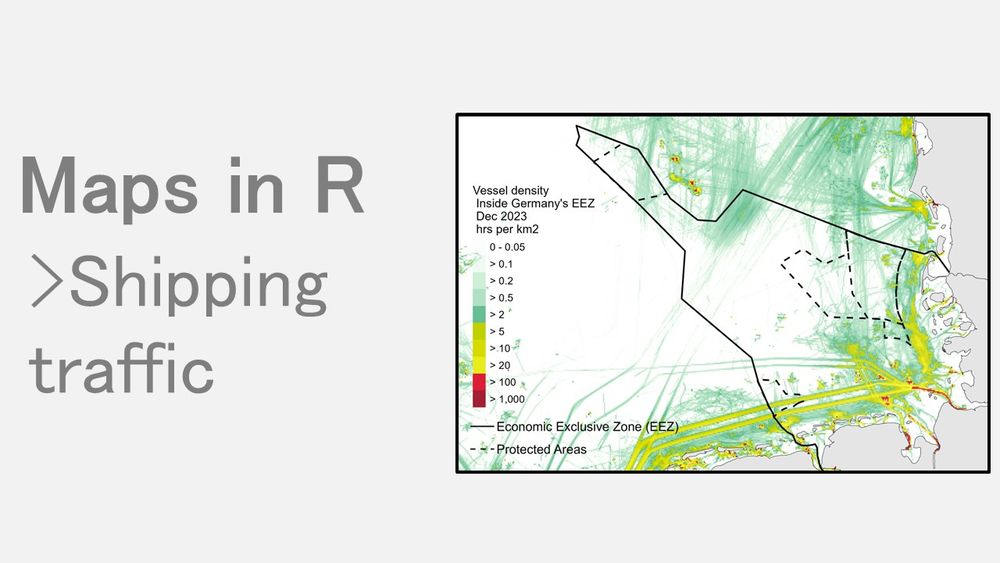
In this month's blog post, I demonstrate how to visualize shipping traffic data using R. The tutorial covers downloading the dataset from EMODnet, performing exploratory data analysis, and creating a map using ggplot2.
#Rstats #GeospatialAnalysis #DataVisualization #ShippingTraffic
#Rstats #GeospatialAnalysis #DataVisualization #ShippingTraffic
June 6, 2025 at 11:05 AM
In this month's blog post, I demonstrate how to visualize shipping traffic data using R. The tutorial covers downloading the dataset from EMODnet, performing exploratory data analysis, and creating a map using ggplot2.
#Rstats #GeospatialAnalysis #DataVisualization #ShippingTraffic
#Rstats #GeospatialAnalysis #DataVisualization #ShippingTraffic
In this blog post, I walk you through the process of visualizing sea surface temperature in R. From downloading the dataset to reading it and creating a map using ggplot.
Check it out and share your thoughts!
#DataVisualization #Rstats #SeaSurfaceTemperature #ggplot #DataScience
Check it out and share your thoughts!
#DataVisualization #Rstats #SeaSurfaceTemperature #ggplot #DataScience

April 9, 2025 at 8:33 AM
In this blog post, I walk you through the process of visualizing sea surface temperature in R. From downloading the dataset to reading it and creating a map using ggplot.
Check it out and share your thoughts!
#DataVisualization #Rstats #SeaSurfaceTemperature #ggplot #DataScience
Check it out and share your thoughts!
#DataVisualization #Rstats #SeaSurfaceTemperature #ggplot #DataScience
New post 🎉
In this post, I share considerations on journal scope and open access fees. This guide is aimed at those submitting their first paper to ornithological journals (includes links).
#ornithology #research
www.miriam-lerma.com/posts/2025-0...
In this post, I share considerations on journal scope and open access fees. This guide is aimed at those submitting their first paper to ornithological journals (includes links).
#ornithology #research
www.miriam-lerma.com/posts/2025-0...


April 1, 2025 at 12:03 PM
New post 🎉
In this post, I share considerations on journal scope and open access fees. This guide is aimed at those submitting their first paper to ornithological journals (includes links).
#ornithology #research
www.miriam-lerma.com/posts/2025-0...
In this post, I share considerations on journal scope and open access fees. This guide is aimed at those submitting their first paper to ornithological journals (includes links).
#ornithology #research
www.miriam-lerma.com/posts/2025-0...
In this blog post, I walk you through the process of visualizing Global Fishing Watch data in R, covering from downloading the dataset to reading it and creating a map using ggplot.
www.miriam-lerma.com/posts/2025-0...
#Rstats #GeospatialAnalysis
www.miriam-lerma.com/posts/2025-0...
#Rstats #GeospatialAnalysis

March 3, 2025 at 9:30 AM
In this blog post, I walk you through the process of visualizing Global Fishing Watch data in R, covering from downloading the dataset to reading it and creating a map using ggplot.
www.miriam-lerma.com/posts/2025-0...
#Rstats #GeospatialAnalysis
www.miriam-lerma.com/posts/2025-0...
#Rstats #GeospatialAnalysis
In this blog post, I share a step-by-step guide on how to use raster data from distance to the coast. I walk you through the steps I used using the North German Sea as an example.
#Rstats #GeospatialAnalysis
www.miriam-lerma.com/posts/2025-0...
#Rstats #GeospatialAnalysis
www.miriam-lerma.com/posts/2025-0...

February 20, 2025 at 11:23 AM
In this blog post, I share a step-by-step guide on how to use raster data from distance to the coast. I walk you through the steps I used using the North German Sea as an example.
#Rstats #GeospatialAnalysis
www.miriam-lerma.com/posts/2025-0...
#Rstats #GeospatialAnalysis
www.miriam-lerma.com/posts/2025-0...
Here are the steps I used for creating a bathymetric map in R. From where to download bathymetric data to how to read it and plot it in R. #Rstats #GeospatialAnalysis
www.miriam-lerma.com/posts/2025-0...
www.miriam-lerma.com/posts/2025-0...

January 20, 2025 at 2:32 PM
Here are the steps I used for creating a bathymetric map in R. From where to download bathymetric data to how to read it and plot it in R. #Rstats #GeospatialAnalysis
www.miriam-lerma.com/posts/2025-0...
www.miriam-lerma.com/posts/2025-0...
I’m currently involved in #seabirds at-sea monitoring program in Germany 🇩🇪, analyzing Digital Aerial Surveys #DAS
I’m also involved in #tracking projects in Chile 🇨🇱 and Mexico 🇲🇽
If this was not confusing enough, I relocated to the UK 🇬🇧 and I am a freelancer for fieldwork and data analysis 😅☝️
I’m also involved in #tracking projects in Chile 🇨🇱 and Mexico 🇲🇽
If this was not confusing enough, I relocated to the UK 🇬🇧 and I am a freelancer for fieldwork and data analysis 😅☝️


December 5, 2024 at 3:08 PM
When analyzing tracking data in R, you may want to explore the locations. R also offers interactive mapping features. In this post, I’ll walk you through the steps I used to create interactive maps using #tmap
www.miriam-lerma.com/posts/2024-1...
#rstats #GIS #tracking
www.miriam-lerma.com/posts/2024-1...
#rstats #GIS #tracking

December 2, 2024 at 8:35 AM
When analyzing tracking data in R, you may want to explore the locations. R also offers interactive mapping features. In this post, I’ll walk you through the steps I used to create interactive maps using #tmap
www.miriam-lerma.com/posts/2024-1...
#rstats #GIS #tracking
www.miriam-lerma.com/posts/2024-1...
#rstats #GIS #tracking
I'm migrating all my old posts to BlueSky.
For this project, we analyzed heavy metals (Cd, Pb, and Hg) in adult and chick Blue-footed boobies."
#ornithology #seabirds #heavymetals
Here is what we found ->
Read the link for the abstract and publication link:
www.miriam-lerma.com/publications...
For this project, we analyzed heavy metals (Cd, Pb, and Hg) in adult and chick Blue-footed boobies."
#ornithology #seabirds #heavymetals
Here is what we found ->
Read the link for the abstract and publication link:
www.miriam-lerma.com/publications...

November 28, 2024 at 9:21 AM
I'm migrating all my old posts to BlueSky.
For this project, we analyzed heavy metals (Cd, Pb, and Hg) in adult and chick Blue-footed boobies."
#ornithology #seabirds #heavymetals
Here is what we found ->
Read the link for the abstract and publication link:
www.miriam-lerma.com/publications...
For this project, we analyzed heavy metals (Cd, Pb, and Hg) in adult and chick Blue-footed boobies."
#ornithology #seabirds #heavymetals
Here is what we found ->
Read the link for the abstract and publication link:
www.miriam-lerma.com/publications...
On the most remote island in Mexico #revillagigedo, we studied the isotopic niche of red-footed and masked boobies.
This is what we found:
"Variations in inter‐specific and sex‐related niche partitioning in pelagic boobies during their annual cycle"
t.co/ZPVFbxmvAt
#seabirds 🇲🇽 #Mexico
This is what we found:
"Variations in inter‐specific and sex‐related niche partitioning in pelagic boobies during their annual cycle"
t.co/ZPVFbxmvAt
#seabirds 🇲🇽 #Mexico

November 22, 2024 at 9:22 AM
On the most remote island in Mexico #revillagigedo, we studied the isotopic niche of red-footed and masked boobies.
This is what we found:
"Variations in inter‐specific and sex‐related niche partitioning in pelagic boobies during their annual cycle"
t.co/ZPVFbxmvAt
#seabirds 🇲🇽 #Mexico
This is what we found:
"Variations in inter‐specific and sex‐related niche partitioning in pelagic boobies during their annual cycle"
t.co/ZPVFbxmvAt
#seabirds 🇲🇽 #Mexico
For this project, we studied sexual segregation in foraging in relation to the breeding stage in masked boobies by simultaneously tracking incubating and chick-rearing birds.
Abstract and link: www.miriam-lerma.com/publications...
#seabirds #Chile
Abstract and link: www.miriam-lerma.com/publications...
#seabirds #Chile

November 19, 2024 at 10:28 AM
For this project, we studied sexual segregation in foraging in relation to the breeding stage in masked boobies by simultaneously tracking incubating and chick-rearing birds.
Abstract and link: www.miriam-lerma.com/publications...
#seabirds #Chile
Abstract and link: www.miriam-lerma.com/publications...
#seabirds #Chile
Estoy migrando mis post a BlueSky.
Excelente oportunidad para empezar de cero.
En este proyecto, estudiamos la ecología de alimentación del Kena en Rapa Nui
Para el resumen y enlace: www.miriam-lerma.com/publications...
#investigacion #avesmarinas
Excelente oportunidad para empezar de cero.
En este proyecto, estudiamos la ecología de alimentación del Kena en Rapa Nui
Para el resumen y enlace: www.miriam-lerma.com/publications...
#investigacion #avesmarinas

November 19, 2024 at 10:24 AM
Estoy migrando mis post a BlueSky.
Excelente oportunidad para empezar de cero.
En este proyecto, estudiamos la ecología de alimentación del Kena en Rapa Nui
Para el resumen y enlace: www.miriam-lerma.com/publications...
#investigacion #avesmarinas
Excelente oportunidad para empezar de cero.
En este proyecto, estudiamos la ecología de alimentación del Kena en Rapa Nui
Para el resumen y enlace: www.miriam-lerma.com/publications...
#investigacion #avesmarinas
I'm migrating all my old posts from my publications to BlueSky.
A great chance to start fresh!
For this project back in Mexico, we analyzed Zn in Blue-footed boobies, comparing eggs, chicks, females, and males.
Here are the abstract and the link:
www.miriam-lerma.com/publications...
#seabirds
A great chance to start fresh!
For this project back in Mexico, we analyzed Zn in Blue-footed boobies, comparing eggs, chicks, females, and males.
Here are the abstract and the link:
www.miriam-lerma.com/publications...
#seabirds

November 19, 2024 at 10:21 AM
I'm migrating all my old posts from my publications to BlueSky.
A great chance to start fresh!
For this project back in Mexico, we analyzed Zn in Blue-footed boobies, comparing eggs, chicks, females, and males.
Here are the abstract and the link:
www.miriam-lerma.com/publications...
#seabirds
A great chance to start fresh!
For this project back in Mexico, we analyzed Zn in Blue-footed boobies, comparing eggs, chicks, females, and males.
Here are the abstract and the link:
www.miriam-lerma.com/publications...
#seabirds
When I was still living in Sinaloa, I followed the reproduction and assessed the nutritional status of blue-footed boobies, want to see what we found?
#seabirds #research #tropical
See our publication : t.co/pQ9IKHbmii
#seabirds #research #tropical
See our publication : t.co/pQ9IKHbmii

November 12, 2024 at 2:19 PM
When I was still living in Sinaloa, I followed the reproduction and assessed the nutritional status of blue-footed boobies, want to see what we found?
#seabirds #research #tropical
See our publication : t.co/pQ9IKHbmii
#seabirds #research #tropical
See our publication : t.co/pQ9IKHbmii
Pingüinos de Humboldt del Norte de Chile:
- estrés fisiológico:♀️= ♂️,
- comportamiento alimenticio ♀️= ♂️,
- buceo♂️>♀️ !
#aves #investigacion #Chile #pinguinos
Mira nuestra publicacion aqui:
t.co/dIh1tehXGr
- estrés fisiológico:♀️= ♂️,
- comportamiento alimenticio ♀️= ♂️,
- buceo♂️>♀️ !
#aves #investigacion #Chile #pinguinos
Mira nuestra publicacion aqui:
t.co/dIh1tehXGr

November 12, 2024 at 2:07 PM
Pingüinos de Humboldt del Norte de Chile:
- estrés fisiológico:♀️= ♂️,
- comportamiento alimenticio ♀️= ♂️,
- buceo♂️>♀️ !
#aves #investigacion #Chile #pinguinos
Mira nuestra publicacion aqui:
t.co/dIh1tehXGr
- estrés fisiológico:♀️= ♂️,
- comportamiento alimenticio ♀️= ♂️,
- buceo♂️>♀️ !
#aves #investigacion #Chile #pinguinos
Mira nuestra publicacion aqui:
t.co/dIh1tehXGr
My new blog post includes calculating the distance between points and making a map to show relevant distances using R. #rstats #ggplot2
Check it out at: www.miriam-lerma.com/posts/2024-0...
Check it out at: www.miriam-lerma.com/posts/2024-0...

November 12, 2024 at 1:19 PM
My new blog post includes calculating the distance between points and making a map to show relevant distances using R. #rstats #ggplot2
Check it out at: www.miriam-lerma.com/posts/2024-0...
Check it out at: www.miriam-lerma.com/posts/2024-0...
When studying movement of animals we can have some gaps. In my new blogpost, I share a function I created in R to interpolate the data to fill those gaps. I also share link to other packages that also do the job.
Check the post here: www.miriam-lerma.com/posts/2024-0... #rstats #seabirds
Check the post here: www.miriam-lerma.com/posts/2024-0... #rstats #seabirds

November 12, 2024 at 1:14 PM
When studying movement of animals we can have some gaps. In my new blogpost, I share a function I created in R to interpolate the data to fill those gaps. I also share link to other packages that also do the job.
Check the post here: www.miriam-lerma.com/posts/2024-0... #rstats #seabirds
Check the post here: www.miriam-lerma.com/posts/2024-0... #rstats #seabirds
Certain locations need to be excluded when conducting spatial analyses, such as those near the nests. In this blog post, I share how I create a buffer in R #rstats to remove these locations.
t.co/2YC6tkI3un
t.co/2YC6tkI3un

November 12, 2024 at 1:11 PM
Certain locations need to be excluded when conducting spatial analyses, such as those near the nests. In this blog post, I share how I create a buffer in R #rstats to remove these locations.
t.co/2YC6tkI3un
t.co/2YC6tkI3un
When tracking animals, there may be times when they enter areas with no reception.
In this post, I’ll walk you through the steps I used to determine whether trips are complete or incomplete.
lnkd.in/eAgz9rQE
In this post, I’ll walk you through the steps I used to determine whether trips are complete or incomplete.
lnkd.in/eAgz9rQE

November 5, 2024 at 11:20 AM
When tracking animals, there may be times when they enter areas with no reception.
In this post, I’ll walk you through the steps I used to determine whether trips are complete or incomplete.
lnkd.in/eAgz9rQE
In this post, I’ll walk you through the steps I used to determine whether trips are complete or incomplete.
lnkd.in/eAgz9rQE
How far is it?
When studying animal movement, we often need to calculate the distance an animal covers from one location to another.
In this post, I share the code I use to calculate the distance between consecutive locations.
#seabirds #rstat #movementecology
lnkd.in/eBC9vJwF
When studying animal movement, we often need to calculate the distance an animal covers from one location to another.
In this post, I share the code I use to calculate the distance between consecutive locations.
#seabirds #rstat #movementecology
lnkd.in/eBC9vJwF

October 21, 2024 at 7:54 AM
How far is it?
When studying animal movement, we often need to calculate the distance an animal covers from one location to another.
In this post, I share the code I use to calculate the distance between consecutive locations.
#seabirds #rstat #movementecology
lnkd.in/eBC9vJwF
When studying animal movement, we often need to calculate the distance an animal covers from one location to another.
In this post, I share the code I use to calculate the distance between consecutive locations.
#seabirds #rstat #movementecology
lnkd.in/eBC9vJwF