


Michael Briskin
@michaelbriskin.bsky.social
Economics PhD student @BU
Labor Economics, Economic History
Labor Economics, Economic History
Full paper: mbbriskin.github.io/files/Briski...
See my website for other fun labor and history projects! mbbriskin.github.io
See my website for other fun labor and history projects! mbbriskin.github.io
mbbriskin.github.io
November 14, 2025 at 7:52 PM
Full paper: mbbriskin.github.io/files/Briski...
See my website for other fun labor and history projects! mbbriskin.github.io
See my website for other fun labor and history projects! mbbriskin.github.io
Why does this matter?
Even temporary shocks to teacher supply can have lasting consequences on the composition and quality of the teacher workforce—and therefore on students' human capital 🧠 and economic outcomes 💰.
Even temporary shocks to teacher supply can have lasting consequences on the composition and quality of the teacher workforce—and therefore on students' human capital 🧠 and economic outcomes 💰.
November 14, 2025 at 7:52 PM
Why does this matter?
Even temporary shocks to teacher supply can have lasting consequences on the composition and quality of the teacher workforce—and therefore on students' human capital 🧠 and economic outcomes 💰.
Even temporary shocks to teacher supply can have lasting consequences on the composition and quality of the teacher workforce—and therefore on students' human capital 🧠 and economic outcomes 💰.
And things don't just go back to normal after the war. Teacher qualifications stayed lower and class sizes stayed higher in the harder hit states even years later.
November 14, 2025 at 7:51 PM
And things don't just go back to normal after the war. Teacher qualifications stayed lower and class sizes stayed higher in the harder hit states even years later.
Using census data, government reports, and records from the National Education Association, I show that states with more missing teachers:
1️⃣ were more likely to hire emergency teachers
2️⃣ had a decrease in the share of teachers with a college degree
1️⃣ were more likely to hire emergency teachers
2️⃣ had a decrease in the share of teachers with a college degree
November 14, 2025 at 7:50 PM
Using census data, government reports, and records from the National Education Association, I show that states with more missing teachers:
1️⃣ were more likely to hire emergency teachers
2️⃣ had a decrease in the share of teachers with a college degree
1️⃣ were more likely to hire emergency teachers
2️⃣ had a decrease in the share of teachers with a college degree
How did school districts respond? By hiring TONS of emergency replacement teachers.
In 1941, < 1 in 400 teachers held an emergency license. By 1947? 1 in every 8 teachers.
According to the NYT, some were “taxicab drivers, mechanics, telephone operators, or retired janitors.” 😳
In 1941, < 1 in 400 teachers held an emergency license. By 1947? 1 in every 8 teachers.
According to the NYT, some were “taxicab drivers, mechanics, telephone operators, or retired janitors.” 😳

November 14, 2025 at 7:50 PM
How did school districts respond? By hiring TONS of emergency replacement teachers.
In 1941, < 1 in 400 teachers held an emergency license. By 1947? 1 in every 8 teachers.
According to the NYT, some were “taxicab drivers, mechanics, telephone operators, or retired janitors.” 😳
In 1941, < 1 in 400 teachers held an emergency license. By 1947? 1 in every 8 teachers.
According to the NYT, some were “taxicab drivers, mechanics, telephone operators, or retired janitors.” 😳
🚨Main Findings🚨
For the school-aged cohorts, a 1 SD increase in missing teachers reduces
- HS graduation by 1.6 pp (2.5%)
- College graduation by 0.4 pp (3.6%)
- Weekly wage by 1.9%. That’s ~$40k in lifetime earnings for a full-time worker.
For the school-aged cohorts, a 1 SD increase in missing teachers reduces
- HS graduation by 1.6 pp (2.5%)
- College graduation by 0.4 pp (3.6%)
- Weekly wage by 1.9%. That’s ~$40k in lifetime earnings for a full-time worker.


November 14, 2025 at 7:49 PM
🚨Main Findings🚨
For the school-aged cohorts, a 1 SD increase in missing teachers reduces
- HS graduation by 1.6 pp (2.5%)
- College graduation by 0.4 pp (3.6%)
- Weekly wage by 1.9%. That’s ~$40k in lifetime earnings for a full-time worker.
For the school-aged cohorts, a 1 SD increase in missing teachers reduces
- HS graduation by 1.6 pp (2.5%)
- College graduation by 0.4 pp (3.6%)
- Weekly wage by 1.9%. That’s ~$40k in lifetime earnings for a full-time worker.
To estimate LR effects on students, I use a diff-in-diff comparing students from:
1️⃣ states with more vs. fewer missing teachers
2️⃣ cohorts in school during the war vs. too old to be in school
I observe these school-aged cohorts, plus the earlier cohorts as adults in Census samples 1940-2000
1️⃣ states with more vs. fewer missing teachers
2️⃣ cohorts in school during the war vs. too old to be in school
I observe these school-aged cohorts, plus the earlier cohorts as adults in Census samples 1940-2000
November 14, 2025 at 7:48 PM
To estimate LR effects on students, I use a diff-in-diff comparing students from:
1️⃣ states with more vs. fewer missing teachers
2️⃣ cohorts in school during the war vs. too old to be in school
I observe these school-aged cohorts, plus the earlier cohorts as adults in Census samples 1940-2000
1️⃣ states with more vs. fewer missing teachers
2️⃣ cohorts in school during the war vs. too old to be in school
I observe these school-aged cohorts, plus the earlier cohorts as adults in Census samples 1940-2000
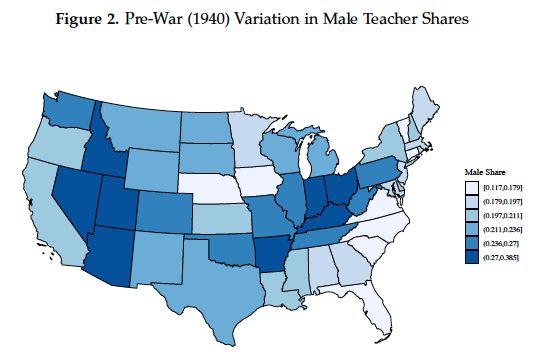
This means places with more pre-war male teachers were harder hit by the shock. I leverage variation in the pre-war gender composition of the teacher workforce to predict “missing teachers” during the war in each state.
November 14, 2025 at 7:48 PM
This means places with more pre-war male teachers were harder hit by the shock. I leverage variation in the pre-war gender composition of the teacher workforce to predict “missing teachers” during the war in each state.
First, which teachers were leaving and why? The shock is really driven by male teachers, about half of whom left the classroom for the military 👨🏫 ➡️ 🪖🫡.
Look at this drop in the male teacher share! The number of male teachers fell 35% from 1940-44.
Look at this drop in the male teacher share! The number of male teachers fell 35% from 1940-44.

November 14, 2025 at 7:45 PM
First, which teachers were leaving and why? The shock is really driven by male teachers, about half of whom left the classroom for the military 👨🏫 ➡️ 🪖🫡.
Look at this drop in the male teacher share! The number of male teachers fell 35% from 1940-44.
Look at this drop in the male teacher share! The number of male teachers fell 35% from 1940-44.
I find that childhood exposure to this teacher supply shock reduces educational attainment and adult earnings.
To understand why, we also need to think about how the teacher workforce was affected.
To understand why, we also need to think about how the teacher workforce was affected.
November 14, 2025 at 7:44 PM
I find that childhood exposure to this teacher supply shock reduces educational attainment and adult earnings.
To understand why, we also need to think about how the teacher workforce was affected.
To understand why, we also need to think about how the teacher workforce was affected.
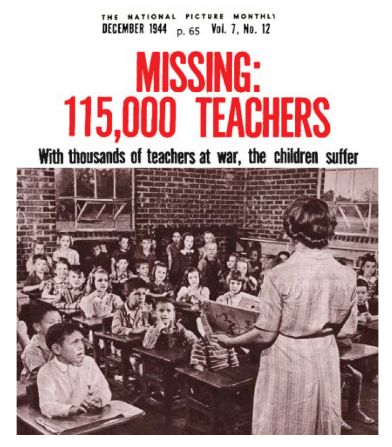
By 1945, 1/3 of all teachers had left the profession since the start of the war. From 1940-44, the total number of teachers fell by more than any other 4-year period in the last century. This is a BIG shock.
Policymakers feared the consequences for students. So what happened to these kids?
Policymakers feared the consequences for students. So what happened to these kids?
November 14, 2025 at 7:44 PM
By 1945, 1/3 of all teachers had left the profession since the start of the war. From 1940-44, the total number of teachers fell by more than any other 4-year period in the last century. This is a BIG shock.
Policymakers feared the consequences for students. So what happened to these kids?
Policymakers feared the consequences for students. So what happened to these kids?