


Michael Thomas
@michael-thomas.bsky.social
I write stories and make videos about climate change.
Subscribe to the Distilled newsletter and YouTube channel here: http://linktr.ee/distilled.earth
Subscribe to the Distilled newsletter and YouTube channel here: http://linktr.ee/distilled.earth
In Virginia—home to the world’s largest concentration of data centers—rising electricity consumption from data centers actually prevented prices from rising as much as they otherwise would have between 2019 and 2024, according to the report.

October 22, 2025 at 4:43 PM
In Virginia—home to the world’s largest concentration of data centers—rising electricity consumption from data centers actually prevented prices from rising as much as they otherwise would have between 2019 and 2024, according to the report.
North Dakota is the only state in the US that didn’t see its electricity prices rise between 2019 and 2024.
Over that period, rates actually fell in inflation-adjusted terms.
Over that period, rates actually fell in inflation-adjusted terms.

October 22, 2025 at 4:43 PM
North Dakota is the only state in the US that didn’t see its electricity prices rise between 2019 and 2024.
Over that period, rates actually fell in inflation-adjusted terms.
Over that period, rates actually fell in inflation-adjusted terms.
This was surprising to me:
In states with the highest electricity demand growth—from sources like data centers—electricity prices actually fell over the last 5 years.
Totally opposite of the prevailing narrative that data centers raise electricity prices.
🧵
In states with the highest electricity demand growth—from sources like data centers—electricity prices actually fell over the last 5 years.
Totally opposite of the prevailing narrative that data centers raise electricity prices.
🧵

October 22, 2025 at 4:43 PM
This was surprising to me:
In states with the highest electricity demand growth—from sources like data centers—electricity prices actually fell over the last 5 years.
Totally opposite of the prevailing narrative that data centers raise electricity prices.
🧵
In states with the highest electricity demand growth—from sources like data centers—electricity prices actually fell over the last 5 years.
Totally opposite of the prevailing narrative that data centers raise electricity prices.
🧵
Meta is also working on a data center in Louisiana that would be twice the size of its Ohio data center.
The floorspace will be about half the size of lower Manhattan.
At peak power, Hyperion will consume about half as much electricity as the entire city of New York.
The floorspace will be about half the size of lower Manhattan.
At peak power, Hyperion will consume about half as much electricity as the entire city of New York.

October 16, 2025 at 2:52 PM
Meta is also working on a data center in Louisiana that would be twice the size of its Ohio data center.
The floorspace will be about half the size of lower Manhattan.
At peak power, Hyperion will consume about half as much electricity as the entire city of New York.
The floorspace will be about half the size of lower Manhattan.
At peak power, Hyperion will consume about half as much electricity as the entire city of New York.
To build its first 1 GW data center, Meta is sticking thousands of $60k NVIDIA GPUs in tents in Ohio.
That might sound crazy, but it's cut the time to build in half. The first few buildings at its site in Ohio took 2-3 years to build.
The tents will take less than a year.
That might sound crazy, but it's cut the time to build in half. The first few buildings at its site in Ohio took 2-3 years to build.
The tents will take less than a year.

October 16, 2025 at 2:52 PM
To build its first 1 GW data center, Meta is sticking thousands of $60k NVIDIA GPUs in tents in Ohio.
That might sound crazy, but it's cut the time to build in half. The first few buildings at its site in Ohio took 2-3 years to build.
The tents will take less than a year.
That might sound crazy, but it's cut the time to build in half. The first few buildings at its site in Ohio took 2-3 years to build.
The tents will take less than a year.
The only hyperscaler that isn't working on a giga-scale data center in the US is Google.
Instead, they've built a distributed cluster of 4 data centers connected by fiber on the border of Nebraska and Iowa. By 2026, the cluster will have 1 GW of capacity.
Instead, they've built a distributed cluster of 4 data centers connected by fiber on the border of Nebraska and Iowa. By 2026, the cluster will have 1 GW of capacity.

October 16, 2025 at 2:52 PM
The only hyperscaler that isn't working on a giga-scale data center in the US is Google.
Instead, they've built a distributed cluster of 4 data centers connected by fiber on the border of Nebraska and Iowa. By 2026, the cluster will have 1 GW of capacity.
Instead, they've built a distributed cluster of 4 data centers connected by fiber on the border of Nebraska and Iowa. By 2026, the cluster will have 1 GW of capacity.
Stargate isn’t the only gigawatt-scale project progressing quickly in the US either.
Amazon recently finished the first phase of a data center in Indiana that will eventually use 2.2 GW of power.
The first phase (525 MW) took a bit more than a year to build.
Amazon recently finished the first phase of a data center in Indiana that will eventually use 2.2 GW of power.
The first phase (525 MW) took a bit more than a year to build.

October 16, 2025 at 2:52 PM
Stargate isn’t the only gigawatt-scale project progressing quickly in the US either.
Amazon recently finished the first phase of a data center in Indiana that will eventually use 2.2 GW of power.
The first phase (525 MW) took a bit more than a year to build.
Amazon recently finished the first phase of a data center in Indiana that will eventually use 2.2 GW of power.
The first phase (525 MW) took a bit more than a year to build.
Another way to understand the scale of the project is to compare the 1.2 GW of peak demand the facility will use to that of one of the nearest utilities.
El Paso Electric, a utility that serves 465,000 customers west of the project, has a peak system load of 2.4 GW.
El Paso Electric, a utility that serves 465,000 customers west of the project, has a peak system load of 2.4 GW.

October 16, 2025 at 2:52 PM
Another way to understand the scale of the project is to compare the 1.2 GW of peak demand the facility will use to that of one of the nearest utilities.
El Paso Electric, a utility that serves 465,000 customers west of the project, has a peak system load of 2.4 GW.
El Paso Electric, a utility that serves 465,000 customers west of the project, has a peak system load of 2.4 GW.
It’s hard to really put the scale of this project in perspective. One way to do it is to look at the project from space.
The satellite image below shows Stargate’s first two buildings. Each of those tiny little dots is a construction worker's car. There are 6,000 of them.
The satellite image below shows Stargate’s first two buildings. Each of those tiny little dots is a construction worker's car. There are 6,000 of them.

October 16, 2025 at 2:52 PM
It’s hard to really put the scale of this project in perspective. One way to do it is to look at the project from space.
The satellite image below shows Stargate’s first two buildings. Each of those tiny little dots is a construction worker's car. There are 6,000 of them.
The satellite image below shows Stargate’s first two buildings. Each of those tiny little dots is a construction worker's car. There are 6,000 of them.
OpenAI’s Stargate data center in Abilene, Texas is one such project.
Just over a year ago, the project was nothing more than some permits and a few hundred acres of dirt in West Texas. Today there are 100,000 of NVIDIA’s most advanced chips consuming 200 MW of power.
Just over a year ago, the project was nothing more than some permits and a few hundred acres of dirt in West Texas. Today there are 100,000 of NVIDIA’s most advanced chips consuming 200 MW of power.

October 16, 2025 at 2:52 PM
OpenAI’s Stargate data center in Abilene, Texas is one such project.
Just over a year ago, the project was nothing more than some permits and a few hundred acres of dirt in West Texas. Today there are 100,000 of NVIDIA’s most advanced chips consuming 200 MW of power.
Just over a year ago, the project was nothing more than some permits and a few hundred acres of dirt in West Texas. Today there are 100,000 of NVIDIA’s most advanced chips consuming 200 MW of power.
Since the launch of ChatGPT in November 2022, tech companies have spent huge sums of money building data centers.
In just three years, spending on data centers in the US has gone from $13.8 billion to $41.2 billion per year—an increase of 200%.
In just three years, spending on data centers in the US has gone from $13.8 billion to $41.2 billion per year—an increase of 200%.

October 16, 2025 at 2:52 PM
Since the launch of ChatGPT in November 2022, tech companies have spent huge sums of money building data centers.
In just three years, spending on data centers in the US has gone from $13.8 billion to $41.2 billion per year—an increase of 200%.
In just three years, spending on data centers in the US has gone from $13.8 billion to $41.2 billion per year—an increase of 200%.
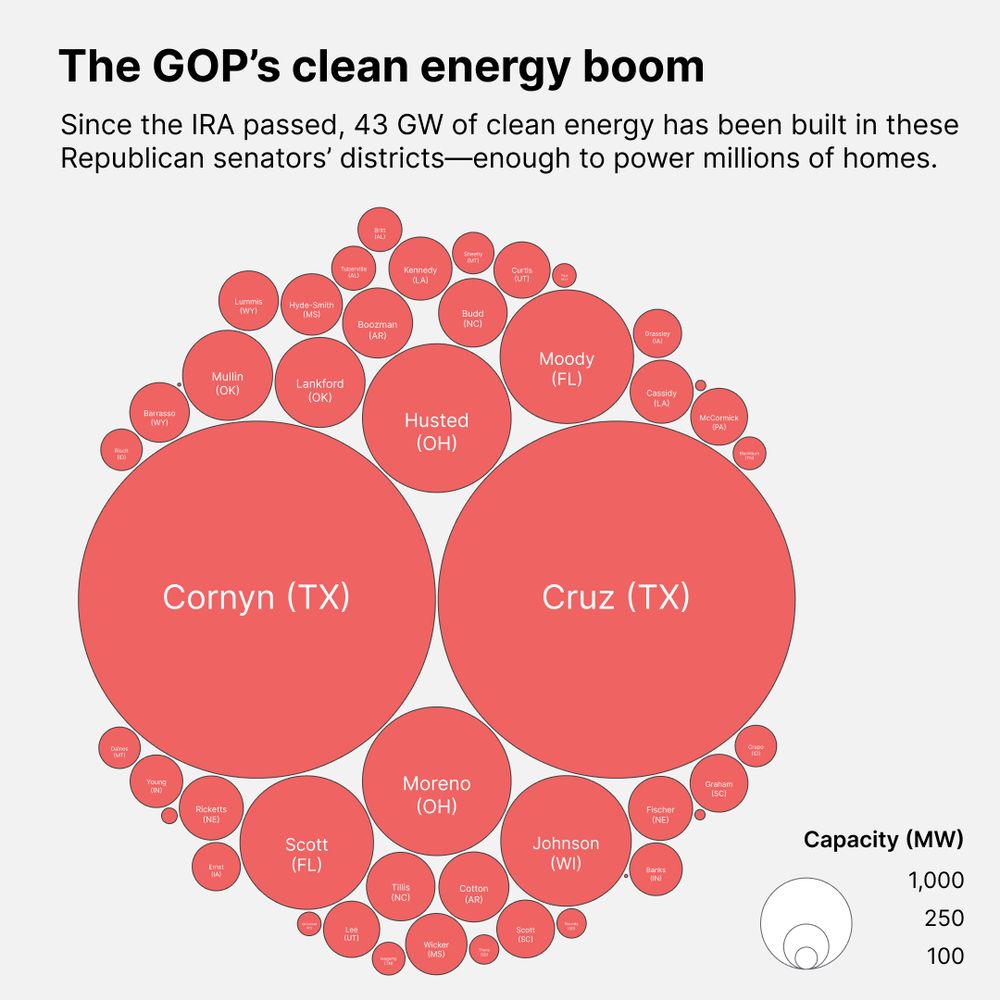
In the coming weeks, the Senate will decide the fate of clean energy in America.
So I decided to crunch some numbers and see how much solar, wind, and storage capacity has been built in each Senators' state.
So I decided to crunch some numbers and see how much solar, wind, and storage capacity has been built in each Senators' state.
May 23, 2025 at 3:57 PM
In the coming weeks, the Senate will decide the fate of clean energy in America.
So I decided to crunch some numbers and see how much solar, wind, and storage capacity has been built in each Senators' state.
So I decided to crunch some numbers and see how much solar, wind, and storage capacity has been built in each Senators' state.
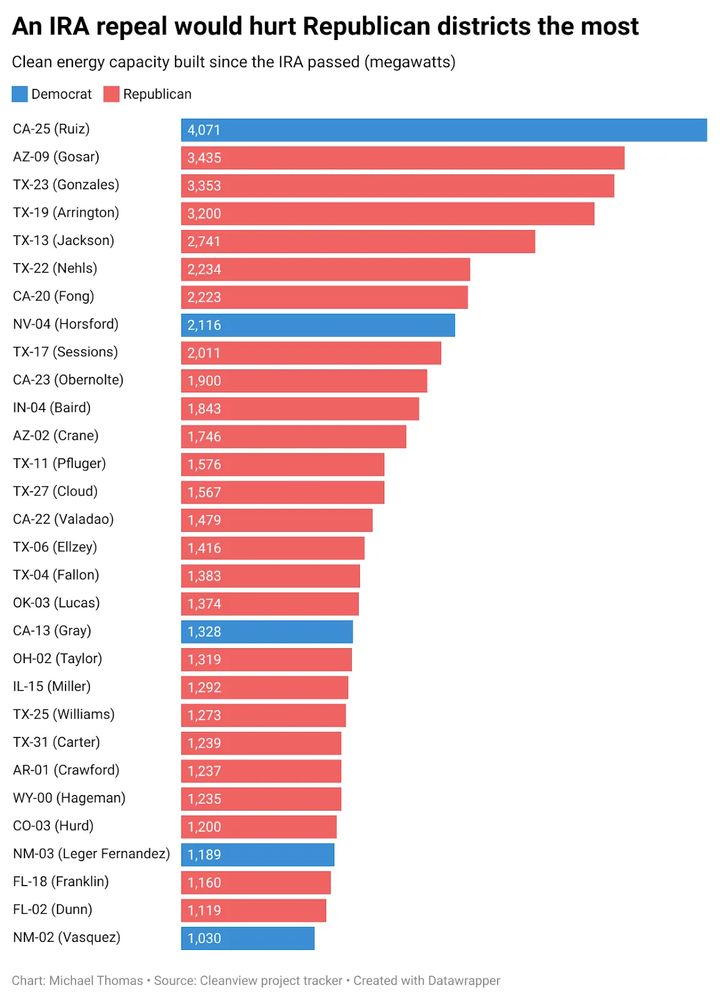
This week, Republicans released their budget bill that aims to repeal the Inflation Reduction Act.
I analyzed every clean energy project that has been built since the IRA passed—3,570 in all.
The proposed budget bill would hurt Republican districts the most.
www.distilled.earth/p/the-republ...
I analyzed every clean energy project that has been built since the IRA passed—3,570 in all.
The proposed budget bill would hurt Republican districts the most.
www.distilled.earth/p/the-republ...
May 14, 2025 at 3:29 PM
This week, Republicans released their budget bill that aims to repeal the Inflation Reduction Act.
I analyzed every clean energy project that has been built since the IRA passed—3,570 in all.
The proposed budget bill would hurt Republican districts the most.
www.distilled.earth/p/the-republ...
I analyzed every clean energy project that has been built since the IRA passed—3,570 in all.
The proposed budget bill would hurt Republican districts the most.
www.distilled.earth/p/the-republ...
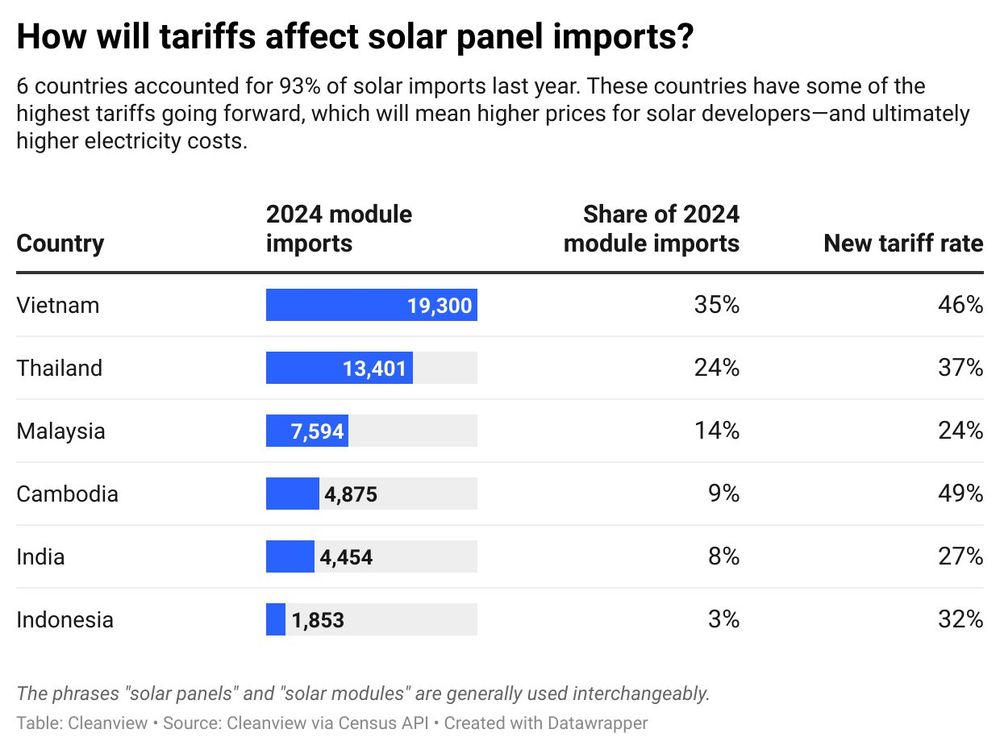
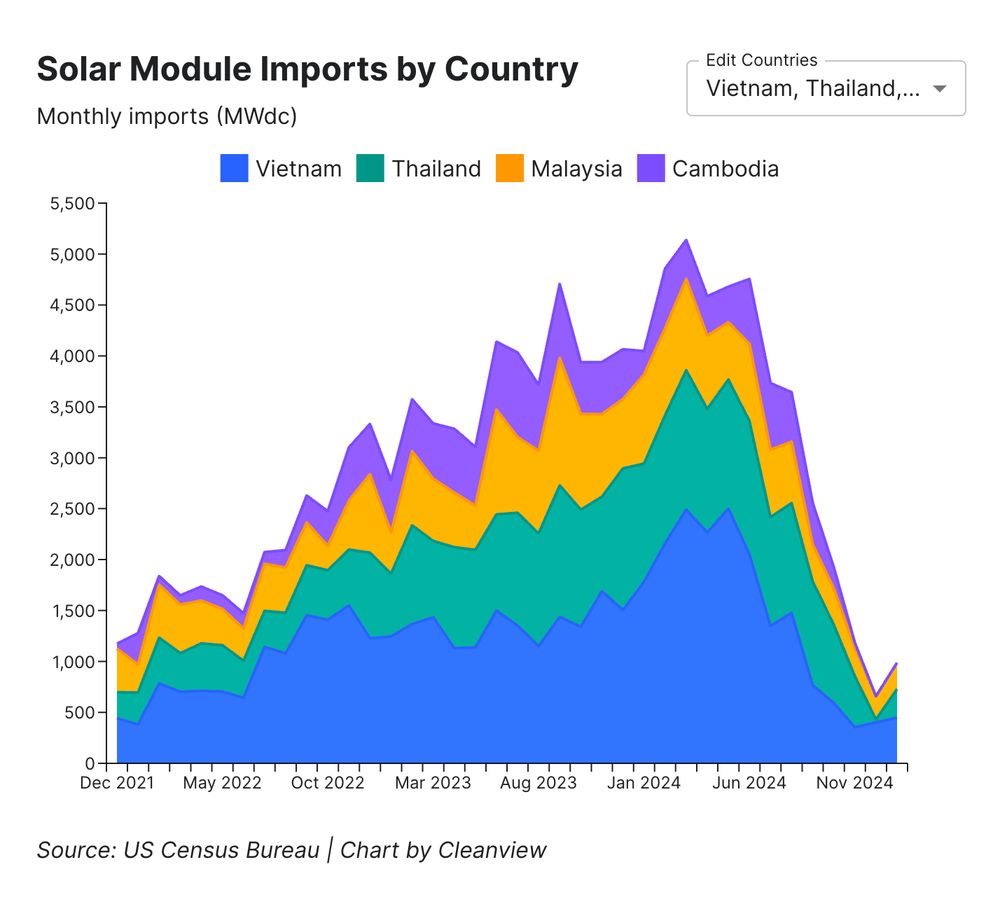
93% of solar panel imports came from just 6 countries in 2024. These countries have some of the highest tariffs going forward.
April 7, 2025 at 5:40 PM
93% of solar panel imports came from just 6 countries in 2024. These countries have some of the highest tariffs going forward.
How are tariffs going to impact the solar market in the US?
At Cleanview we just published a new dataset and dashboard to help folks understand the potential impact of the latest tariffs.
Here are a few takeaways from the data:
cleanview.co/content/sola...
At Cleanview we just published a new dataset and dashboard to help folks understand the potential impact of the latest tariffs.
Here are a few takeaways from the data:
cleanview.co/content/sola...
April 7, 2025 at 5:40 PM
How are tariffs going to impact the solar market in the US?
At Cleanview we just published a new dataset and dashboard to help folks understand the potential impact of the latest tariffs.
Here are a few takeaways from the data:
cleanview.co/content/sola...
At Cleanview we just published a new dataset and dashboard to help folks understand the potential impact of the latest tariffs.
Here are a few takeaways from the data:
cleanview.co/content/sola...
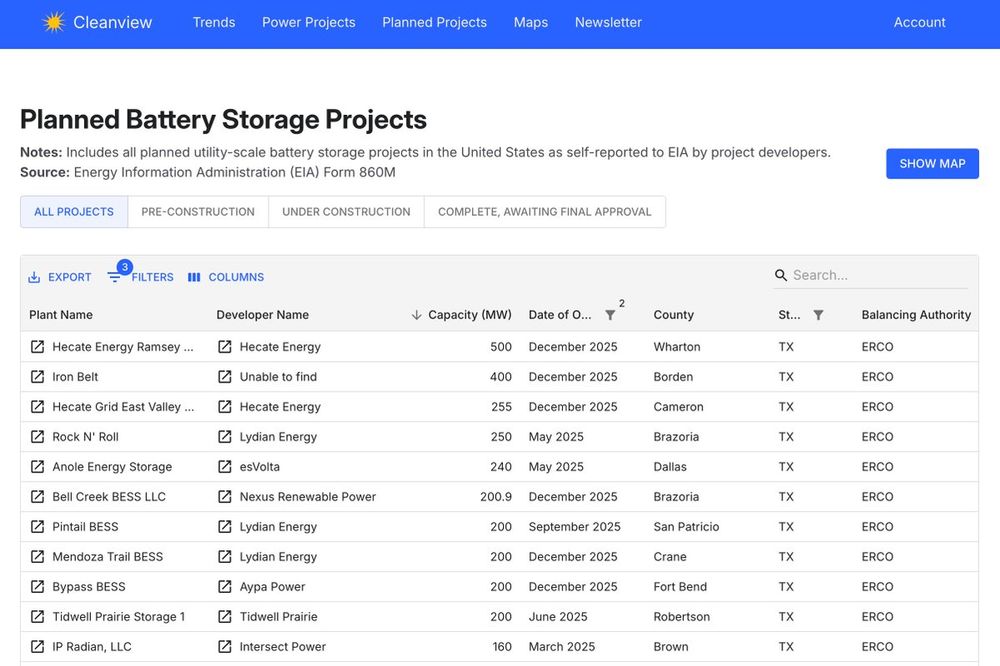
We're tracking hundreds of planned clean energy projects and 400+ developer pipelines at Cleanview.
More on our clean energy project tracker here: cleanview.co
More on our clean energy project tracker here: cleanview.co
March 6, 2025 at 2:57 PM
We're tracking hundreds of planned clean energy projects and 400+ developer pipelines at Cleanview.
More on our clean energy project tracker here: cleanview.co
More on our clean energy project tracker here: cleanview.co
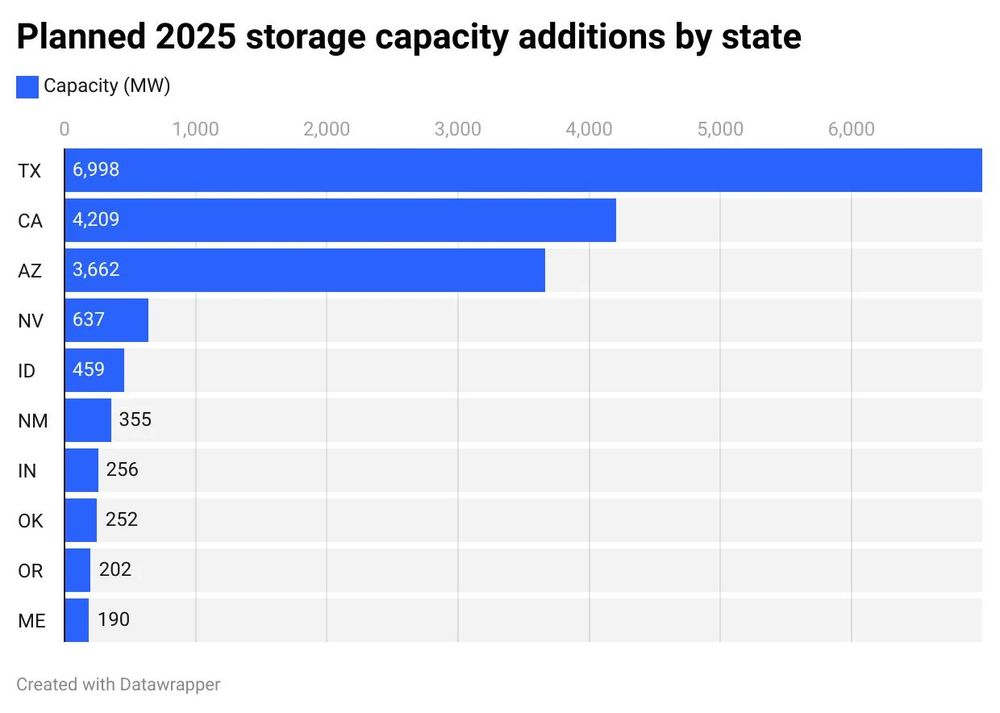
Texas will add more battery storage capacity in 2025 than any other state.
Developers plan to build 7 GW of new capacity—as much as the entire US built in 2023.
Developers plan to build 7 GW of new capacity—as much as the entire US built in 2023.
March 6, 2025 at 2:57 PM
Texas will add more battery storage capacity in 2025 than any other state.
Developers plan to build 7 GW of new capacity—as much as the entire US built in 2023.
Developers plan to build 7 GW of new capacity—as much as the entire US built in 2023.
One of the most overlooked energy stories of 2024:
Battery storage grew 65% last year, with the U.S. adding 10.9 GW of new capacity. And growth is accelerating—we're on track for 18.1 GW in 2025, a 68% increase.
Just 5 years ago, this technology was considered experimental.
Battery storage grew 65% last year, with the U.S. adding 10.9 GW of new capacity. And growth is accelerating—we're on track for 18.1 GW in 2025, a 68% increase.
Just 5 years ago, this technology was considered experimental.

March 5, 2025 at 5:19 PM
One of the most overlooked energy stories of 2024:
Battery storage grew 65% last year, with the U.S. adding 10.9 GW of new capacity. And growth is accelerating—we're on track for 18.1 GW in 2025, a 68% increase.
Just 5 years ago, this technology was considered experimental.
Battery storage grew 65% last year, with the U.S. adding 10.9 GW of new capacity. And growth is accelerating—we're on track for 18.1 GW in 2025, a 68% increase.
Just 5 years ago, this technology was considered experimental.
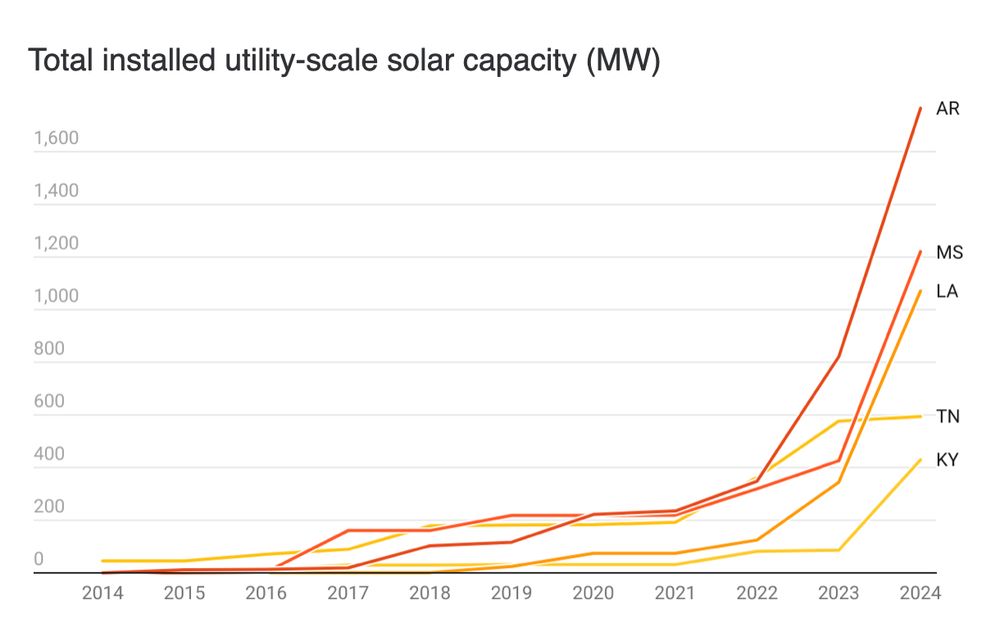
One of the most promising clean energy trends over the last year has been the growth of solar in Republican states in the South.
- AR added 943 MW of capacity (99% vs. 2023).
- MS added 794 MW of capacity (647% vs. 2023).
- LA added 726 MW of capacity (230% vs. 2023).
cleanview.co/annual-repor...
- AR added 943 MW of capacity (99% vs. 2023).
- MS added 794 MW of capacity (647% vs. 2023).
- LA added 726 MW of capacity (230% vs. 2023).
cleanview.co/annual-repor...
February 19, 2025 at 4:26 PM
One of the most promising clean energy trends over the last year has been the growth of solar in Republican states in the South.
- AR added 943 MW of capacity (99% vs. 2023).
- MS added 794 MW of capacity (647% vs. 2023).
- LA added 726 MW of capacity (230% vs. 2023).
cleanview.co/annual-repor...
- AR added 943 MW of capacity (99% vs. 2023).
- MS added 794 MW of capacity (647% vs. 2023).
- LA added 726 MW of capacity (230% vs. 2023).
cleanview.co/annual-repor...
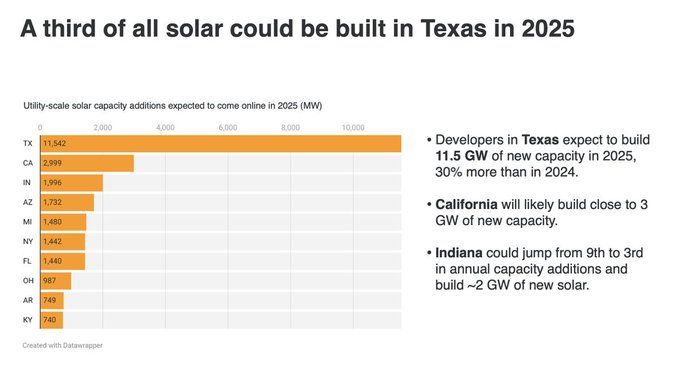
Texas is going to build a massive amount of solar this year.
It's worth noting that 80% of the capacity (~9 GW) in the chart below is already under construction and therefore protected against Trump's recent orders.
It's worth noting that 80% of the capacity (~9 GW) in the chart below is already under construction and therefore protected against Trump's recent orders.
February 17, 2025 at 4:23 PM
Texas is going to build a massive amount of solar this year.
It's worth noting that 80% of the capacity (~9 GW) in the chart below is already under construction and therefore protected against Trump's recent orders.
It's worth noting that 80% of the capacity (~9 GW) in the chart below is already under construction and therefore protected against Trump's recent orders.
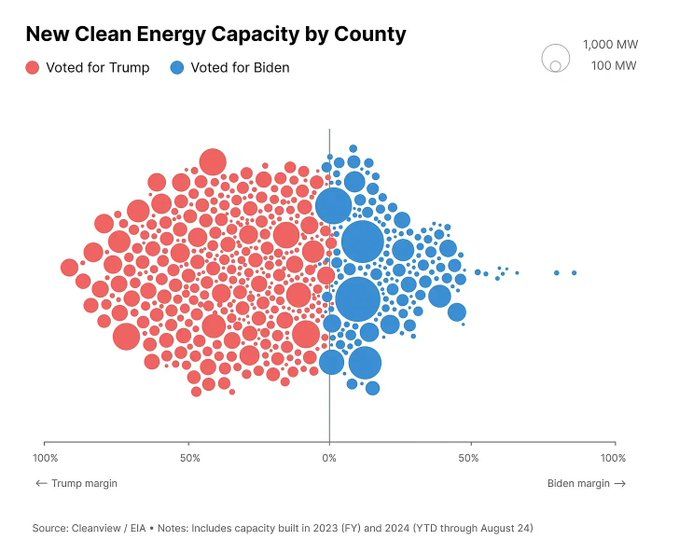
Beyond 2025, no one knows with certainty what will happen to clean energy in America.
Most clean energy is being built in counties that voted for Trump. Traditional political economy / theory would say it'd be unpopular to repeal the clean energy tax credits.
Most clean energy is being built in counties that voted for Trump. Traditional political economy / theory would say it'd be unpopular to repeal the clean energy tax credits.
February 12, 2025 at 4:09 PM
Beyond 2025, no one knows with certainty what will happen to clean energy in America.
Most clean energy is being built in counties that voted for Trump. Traditional political economy / theory would say it'd be unpopular to repeal the clean energy tax credits.
Most clean energy is being built in counties that voted for Trump. Traditional political economy / theory would say it'd be unpopular to repeal the clean energy tax credits.
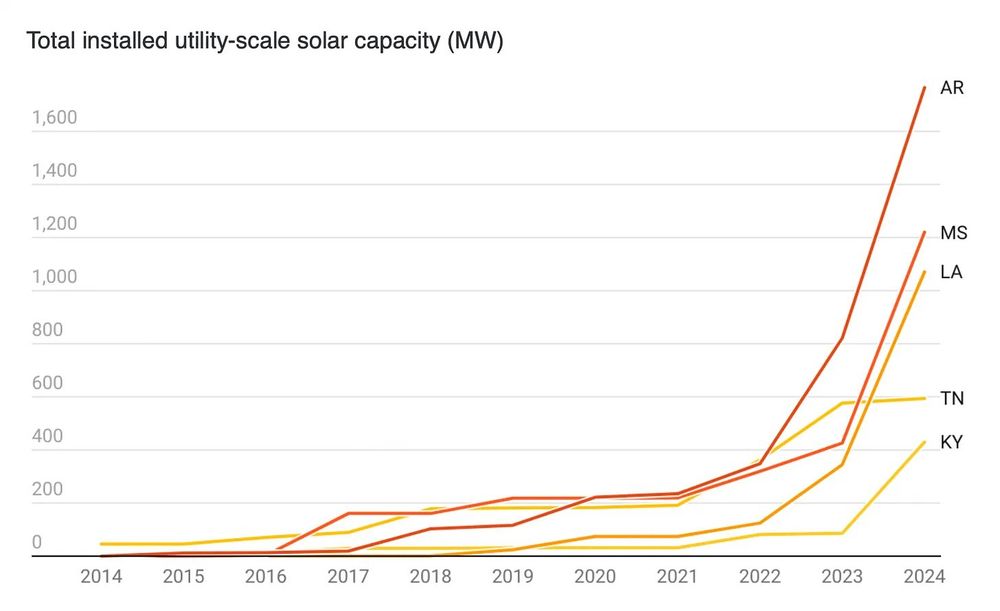
Solar also started to boom in the sunny South in states that have, up until now, been slow to adopt the technology.
Arkansas, Missouri, and Louisiana all saw solar surge in 2024. It’s worth noting that these are all deep red states.
Arkansas, Missouri, and Louisiana all saw solar surge in 2024. It’s worth noting that these are all deep red states.
February 12, 2025 at 4:09 PM
Solar also started to boom in the sunny South in states that have, up until now, been slow to adopt the technology.
Arkansas, Missouri, and Louisiana all saw solar surge in 2024. It’s worth noting that these are all deep red states.
Arkansas, Missouri, and Louisiana all saw solar surge in 2024. It’s worth noting that these are all deep red states.
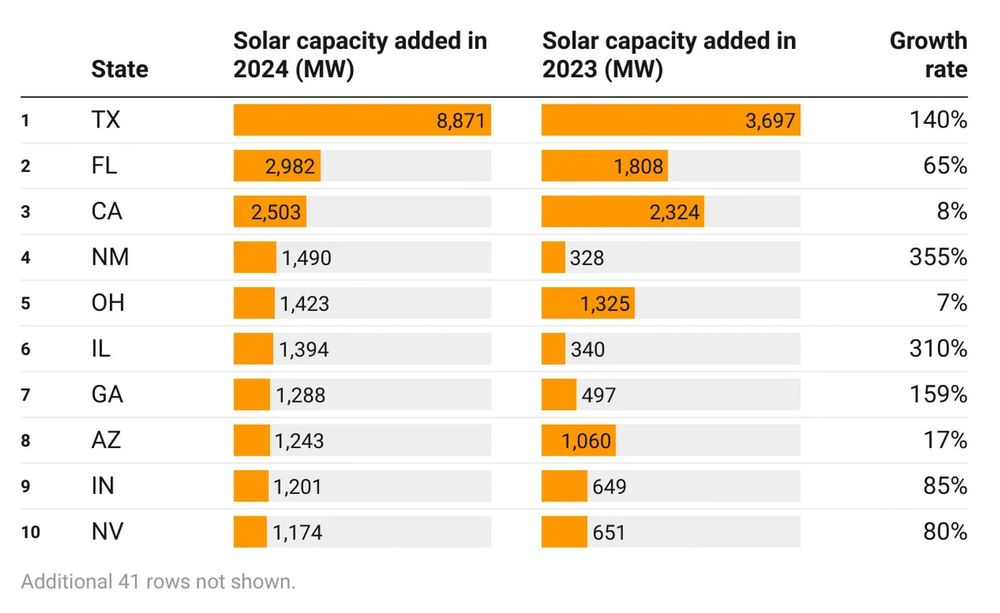
But solar’s growth was far from evenly distributed.
Texas added the most capacity, bringing 8.9 GW of new capacity online.
Florida added the second most capacity (~3 GW). The Sunshine State added more solar capacity than California (2.5 GW) for the first time.
Texas added the most capacity, bringing 8.9 GW of new capacity online.
Florida added the second most capacity (~3 GW). The Sunshine State added more solar capacity than California (2.5 GW) for the first time.
February 12, 2025 at 4:09 PM
But solar’s growth was far from evenly distributed.
Texas added the most capacity, bringing 8.9 GW of new capacity online.
Florida added the second most capacity (~3 GW). The Sunshine State added more solar capacity than California (2.5 GW) for the first time.
Texas added the most capacity, bringing 8.9 GW of new capacity online.
Florida added the second most capacity (~3 GW). The Sunshine State added more solar capacity than California (2.5 GW) for the first time.
Few states were untouched by this solar boom.
As the map below shows, developers built utility-scale solar projects in 45 different states, everywhere from Florida to Maine to Hawaii.
As the map below shows, developers built utility-scale solar projects in 45 different states, everywhere from Florida to Maine to Hawaii.

February 12, 2025 at 4:09 PM
Few states were untouched by this solar boom.
As the map below shows, developers built utility-scale solar projects in 45 different states, everywhere from Florida to Maine to Hawaii.
As the map below shows, developers built utility-scale solar projects in 45 different states, everywhere from Florida to Maine to Hawaii.
In 2024, the star of the clean energy show was without a doubt solar energy.
The U.S. added 32.1 GW of new utility-scale solar capacity in 2024. Annual solar capacity additions rose by 65% in 2024 compared to 2023 when the country added 19.5 GW.
The U.S. added 32.1 GW of new utility-scale solar capacity in 2024. Annual solar capacity additions rose by 65% in 2024 compared to 2023 when the country added 19.5 GW.

February 12, 2025 at 4:09 PM
In 2024, the star of the clean energy show was without a doubt solar energy.
The U.S. added 32.1 GW of new utility-scale solar capacity in 2024. Annual solar capacity additions rose by 65% in 2024 compared to 2023 when the country added 19.5 GW.
The U.S. added 32.1 GW of new utility-scale solar capacity in 2024. Annual solar capacity additions rose by 65% in 2024 compared to 2023 when the country added 19.5 GW.