


Martí Bosch
@martibosch.bsky.social
Doctor in Civil and Environmental Engineering, EPFL - Urban climate, Python, and a bit of remote sensing, landscape ecology and complexity - martibosch.github.io
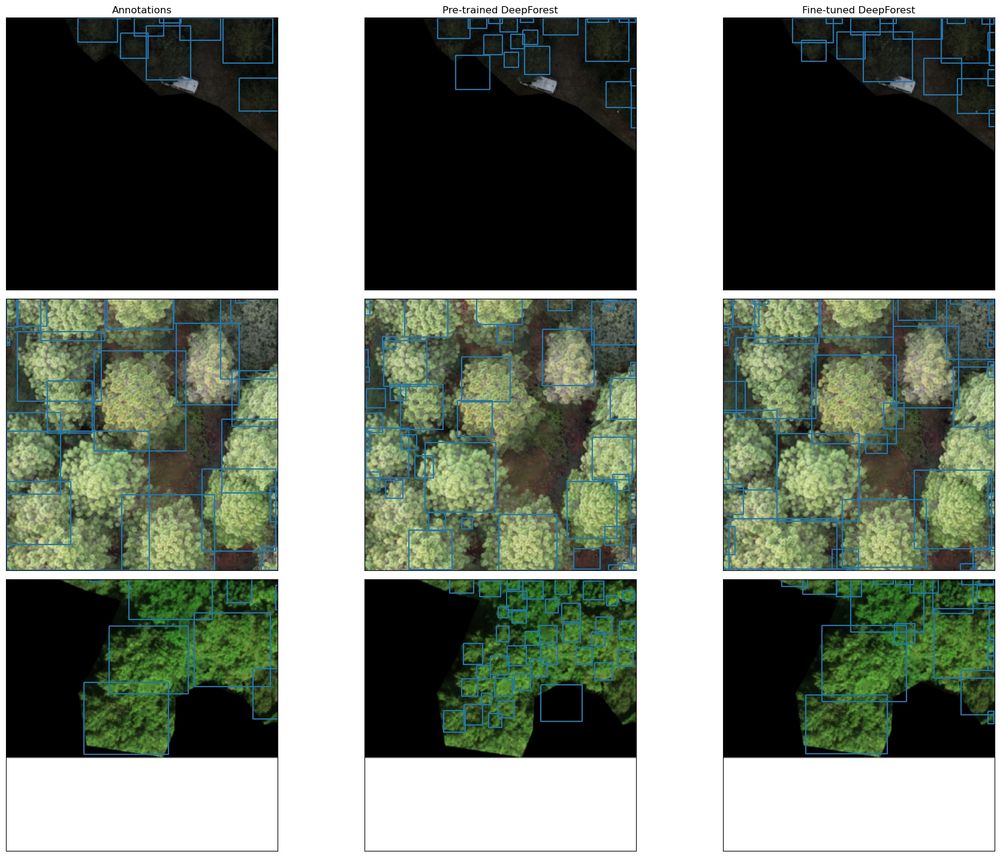
I have created a @modal-labs.bsky.social app for serverless DeepForest @weecology.bsky.social inference, training/fine tuning of tree crown detection and tree speciess classification models 🚀
🧵👇
t.co/K7uTEeR84q
🧵👇
t.co/K7uTEeR84q
June 17, 2025 at 2:17 PM
I have created a @modal-labs.bsky.social app for serverless DeepForest @weecology.bsky.social inference, training/fine tuning of tree crown detection and tree speciess classification models 🚀
🧵👇
t.co/K7uTEeR84q
🧵👇
t.co/K7uTEeR84q
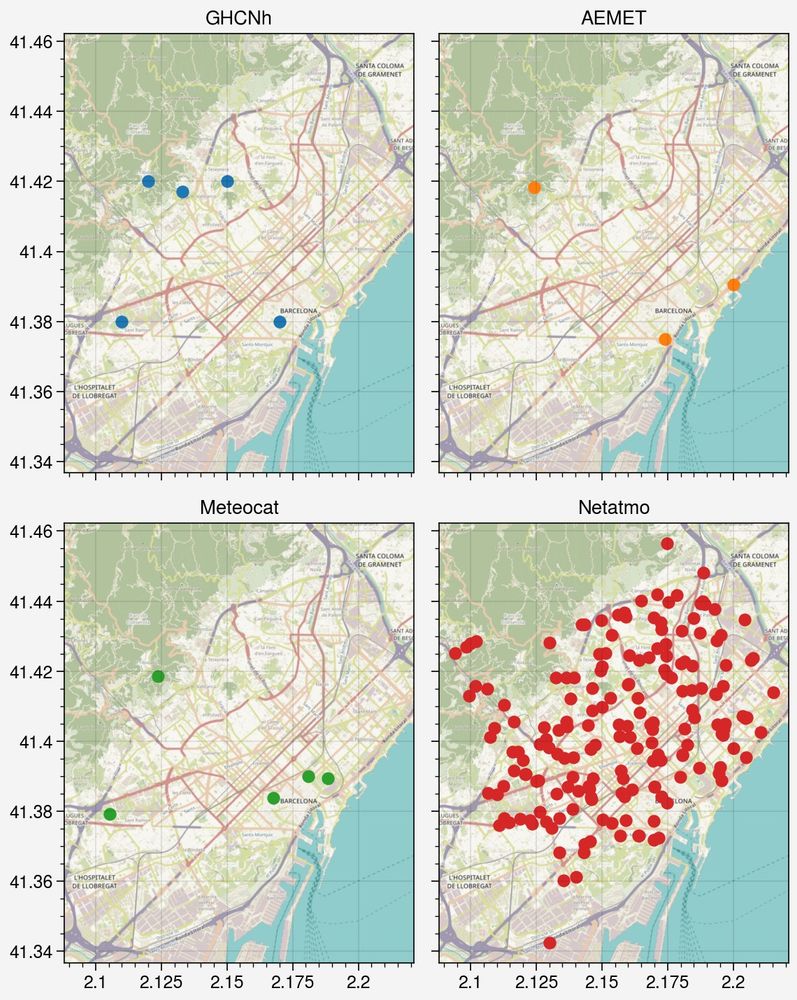
TL;DR: despite great global standardized datasets, e.g., GHCNh, there can be many other sources of meteorological data. The central objective of meteora is to provide a standardized API for meteorological stations data in Python, making it easy to assemble multi-source datasets, e.g., for Barcelona:

April 10, 2025 at 2:12 PM
TL;DR: despite great global standardized datasets, e.g., GHCNh, there can be many other sources of meteorological data. The central objective of meteora is to provide a standardized API for meteorological stations data in Python, making it easy to assemble multi-source datasets, e.g., for Barcelona:
But let me ask one last time, can we get more stations? Again, the answer is yes - enter citizen weather stations (CWS). Meteora features the `NetatmoClient` to access public data from Netatmo weather stations.
The spatial availability of CWS in urban areas can be a game changer. Here is Barcelona:
The spatial availability of CWS in urban areas can be a game changer. Here is Barcelona:
April 10, 2025 at 2:04 PM
But let me ask one last time, can we get more stations? Again, the answer is yes - enter citizen weather stations (CWS). Meteora features the `NetatmoClient` to access public data from Netatmo weather stations.
The spatial availability of CWS in urban areas can be a game changer. Here is Barcelona:
The spatial availability of CWS in urban areas can be a game changer. Here is Barcelona:
Again, can we find more stations? Yes, we can get data from the Meteorological Service of Catalonia (Meteocat) CC: @acam-cat.bsky.social
In fact, many of the Meteocat stations are featured in the GHCNh. But not all of them, i.e., there are 242 Meteocat stations vs. 93 GHCNh stations:
In fact, many of the Meteocat stations are featured in the GHCNh. But not all of them, i.e., there are 242 Meteocat stations vs. 93 GHCNh stations:

April 10, 2025 at 1:56 PM
Again, can we find more stations? Yes, we can get data from the Meteorological Service of Catalonia (Meteocat) CC: @acam-cat.bsky.social
In fact, many of the Meteocat stations are featured in the GHCNh. But not all of them, i.e., there are 242 Meteocat stations vs. 93 GHCNh stations:
In fact, many of the Meteocat stations are featured in the GHCNh. But not all of them, i.e., there are 242 Meteocat stations vs. 93 GHCNh stations:
But are these all the stations we can find? Obviously not. We can also use the `AEMETClient` to get data from @aemet.es.
Here we can see how we can improve the spatial density of stations by combining both sources:
Here we can see how we can improve the spatial density of stations by combining both sources:

April 10, 2025 at 1:56 PM
But are these all the stations we can find? Obviously not. We can also use the `AEMETClient` to get data from @aemet.es.
Here we can see how we can improve the spatial density of stations by combining both sources:
Here we can see how we can improve the spatial density of stations by combining both sources:
Imagine you want to get meteorological observations for any region of the world. A good starting point is always the Global Historical Climatology Network hourly (GHCNh) dataset by the @noaa.gov, which can be accessed in meteora via the `GHCNHourlyClient`.
These are the GHCNh stations in Catalonia:
These are the GHCNh stations in Catalonia:

April 10, 2025 at 1:56 PM
Imagine you want to get meteorological observations for any region of the world. A good starting point is always the Global Historical Climatology Network hourly (GHCNh) dataset by the @noaa.gov, which can be accessed in meteora via the `GHCNHourlyClient`.
These are the GHCNh stations in Catalonia:
These are the GHCNh stations in Catalonia:
The notebook concludes by comparing spatial signatures based on multiple landscape metrics or the entropy/relative mutual information approach suggested by Nowosad (@jakubnowosad.com) and Stepinski (2019).
This allows exploring the fundamental components of spatial patterns as we recently eviewed.
This allows exploring the fundamental components of spatial patterns as we recently eviewed.

January 29, 2025 at 3:25 PM
The notebook concludes by comparing spatial signatures based on multiple landscape metrics or the entropy/relative mutual information approach suggested by Nowosad (@jakubnowosad.com) and Stepinski (2019).
This allows exploring the fundamental components of spatial patterns as we recently eviewed.
This allows exploring the fundamental components of spatial patterns as we recently eviewed.
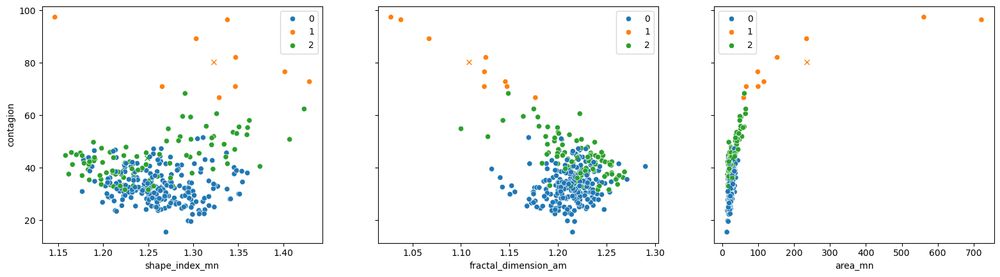
It also provides an interface to assist clustering landscapes using the clustergram library (credits to @martinfleischmann.net), which can be used to select the appropriate number of clusters.
We can then visualize landscape samples based on their cluster assignation and spatial signatures.
We can then visualize landscape samples based on their cluster assignation and spatial signatures.
January 29, 2025 at 3:25 PM
It also provides an interface to assist clustering landscapes using the clustergram library (credits to @martinfleischmann.net), which can be used to select the appropriate number of clusters.
We can then visualize landscape samples based on their cluster assignation and spatial signatures.
We can then visualize landscape samples based on their cluster assignation and spatial signatures.
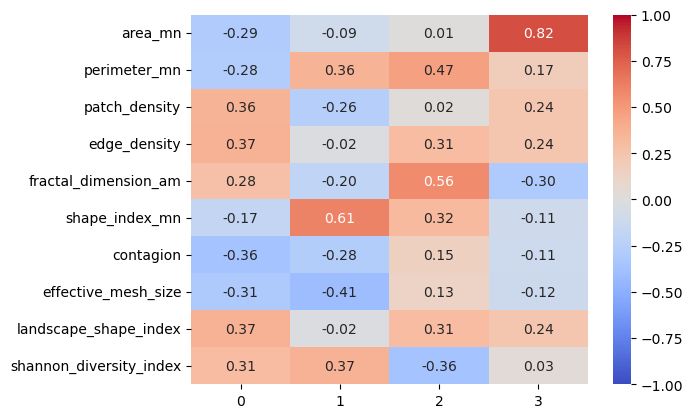
The example divides the land use/land cover map of Switzerland into a set of non-overlapping landscapes of 10x10km covering the whole Swiss extent.
Spatial signatures are first computed using ten landscape metrics, which allows for easy factorization (e.g. PCA) using scikit-learn-like classes:
Spatial signatures are first computed using ten landscape metrics, which allows for easy factorization (e.g. PCA) using scikit-learn-like classes:
January 29, 2025 at 3:25 PM
The example divides the land use/land cover map of Switzerland into a set of non-overlapping landscapes of 10x10km covering the whole Swiss extent.
Spatial signatures are first computed using ten landscape metrics, which allows for easy factorization (e.g. PCA) using scikit-learn-like classes:
Spatial signatures are first computed using ten landscape metrics, which allows for easy factorization (e.g. PCA) using scikit-learn-like classes: