


Leon Hilgers
@leonhilgers.bsky.social
Postdoc
@LOEWE_TBG @Senckenberg. Evolutionary genomics, gene expression, global change, novelties, climate, turtles & eels!
He/him
@LOEWE_TBG @Senckenberg. Evolutionary genomics, gene expression, global change, novelties, climate, turtles & eels!
He/him
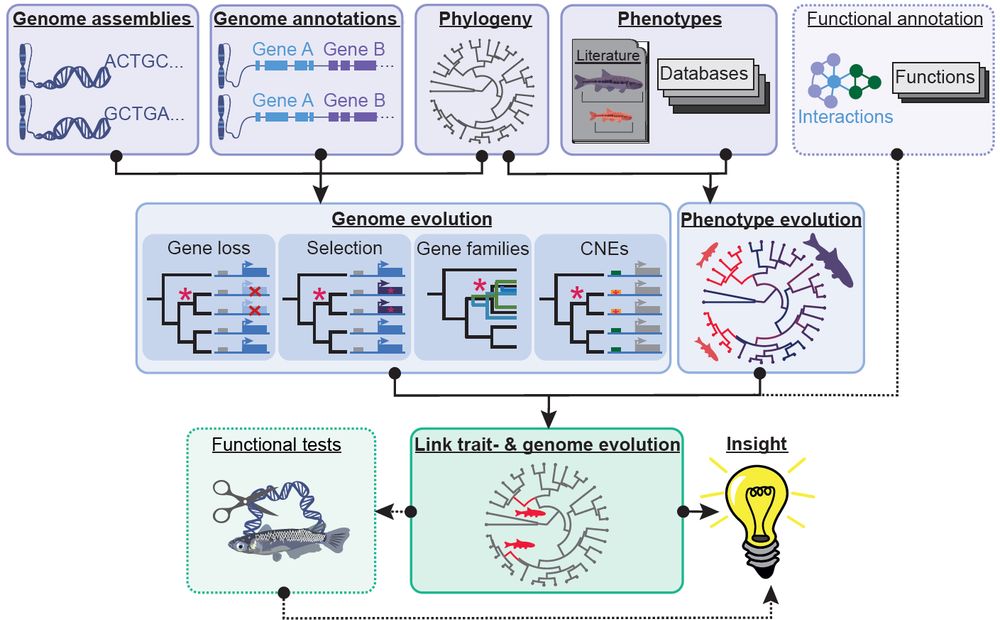
You link #phenotype 🦜 to #genotype 🧬 with #comparative #genomics 💻?
This #review is for you 📜: authors.elsevier.com/sd/article/S...
We review new #methods, remaining #challenges and #future directions and highlight recent key studies.
Thanks @hillermich.bsky.social!
Please share! 🙂
This #review is for you 📜: authors.elsevier.com/sd/article/S...
We review new #methods, remaining #challenges and #future directions and highlight recent key studies.
Thanks @hillermich.bsky.social!
Please share! 🙂
July 24, 2025 at 8:00 AM
You link #phenotype 🦜 to #genotype 🧬 with #comparative #genomics 💻?
This #review is for you 📜: authors.elsevier.com/sd/article/S...
We review new #methods, remaining #challenges and #future directions and highlight recent key studies.
Thanks @hillermich.bsky.social!
Please share! 🙂
This #review is for you 📜: authors.elsevier.com/sd/article/S...
We review new #methods, remaining #challenges and #future directions and highlight recent key studies.
Thanks @hillermich.bsky.social!
Please share! 🙂
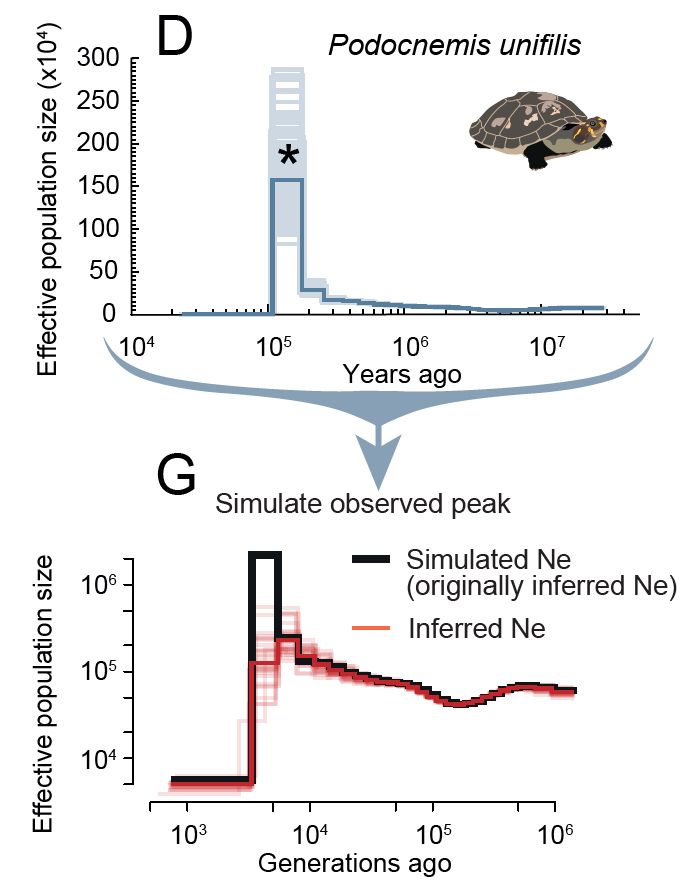
So: Beware of the turtle peaks in PSMC! 😉

February 7, 2025 at 8:15 AM
So: Beware of the turtle peaks in PSMC! 😉
Splitting the first time window also removes peaks for #published #primate data. Alternatively, the tool beta-PSMC seems to do a better job in most, but NOT all cases (see two turtles with * in O).

February 7, 2025 at 8:15 AM
Splitting the first time window also removes peaks for #published #primate data. Alternatively, the tool beta-PSMC seems to do a better job in most, but NOT all cases (see two turtles with * in O).
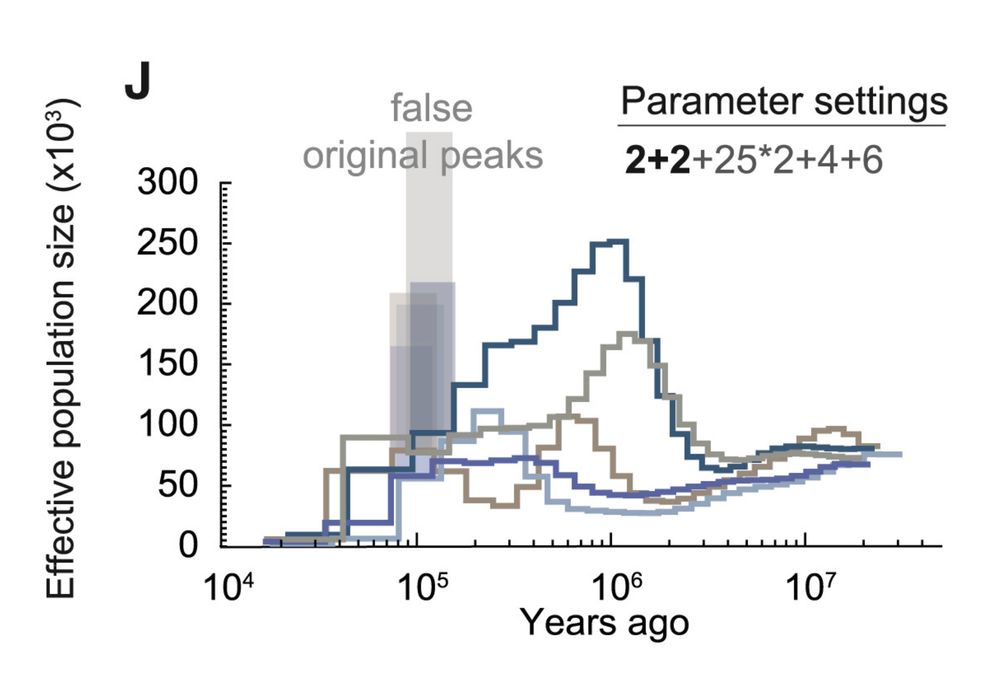
-p 4+... provides a single Ne for a large first window. Ne changes during this time cannot be adequately captured. Low Ne estimates for the first window, become overcompensated in the second time window causing erroneous peaks.
Set -p to 2+2... or even 1+1+1+1... to solve this!
Set -p to 2+2... or even 1+1+1+1... to solve this!

February 7, 2025 at 8:15 AM
-p 4+... provides a single Ne for a large first window. Ne changes during this time cannot be adequately captured. Low Ne estimates for the first window, become overcompensated in the second time window causing erroneous peaks.
Set -p to 2+2... or even 1+1+1+1... to solve this!
Set -p to 2+2... or even 1+1+1+1... to solve this!
Strikingly, the true answer seems to be:
‼️False parameter settings‼️
Changing parameter settings from -p 4+(...) used as default to -p 2+2+(...) removes the peaks in all of our turtle data 🤯
‼️False parameter settings‼️
Changing parameter settings from -p 4+(...) used as default to -p 2+2+(...) removes the peaks in all of our turtle data 🤯
February 7, 2025 at 8:15 AM
Strikingly, the true answer seems to be:
‼️False parameter settings‼️
Changing parameter settings from -p 4+(...) used as default to -p 2+2+(...) removes the peaks in all of our turtle data 🤯
‼️False parameter settings‼️
Changing parameter settings from -p 4+(...) used as default to -p 2+2+(...) removes the peaks in all of our turtle data 🤯
So if it is not population size...
What causes these peaks?🤔
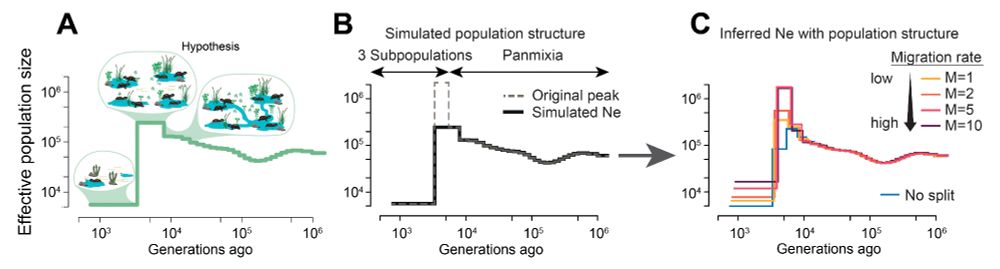
Increases in population structure before a collapse CAN cause similar patterns... however, it is unlikely that this is so common and always occurs in the second time window (Supplement).
What causes these peaks?🤔
Increases in population structure before a collapse CAN cause similar patterns... however, it is unlikely that this is so common and always occurs in the second time window (Supplement).
February 7, 2025 at 8:15 AM
So if it is not population size...
What causes these peaks?🤔
Increases in population structure before a collapse CAN cause similar patterns... however, it is unlikely that this is so common and always occurs in the second time window (Supplement).
What causes these peaks?🤔
Increases in population structure before a collapse CAN cause similar patterns... however, it is unlikely that this is so common and always occurs in the second time window (Supplement).
So we asked:
Might these peaks reflect true changes in Ne?🤔
The answer is: NO! 🔴
Even if a population underwent the population peak that we infer from our data (top blue = bottom black), simulations show that we would not be able to infer it (bottom red).
Might these peaks reflect true changes in Ne?🤔
The answer is: NO! 🔴
Even if a population underwent the population peak that we infer from our data (top blue = bottom black), simulations show that we would not be able to infer it (bottom red).
February 7, 2025 at 8:15 AM
So we asked:
Might these peaks reflect true changes in Ne?🤔
The answer is: NO! 🔴
Even if a population underwent the population peak that we infer from our data (top blue = bottom black), simulations show that we would not be able to infer it (bottom red).
Might these peaks reflect true changes in Ne?🤔
The answer is: NO! 🔴
Even if a population underwent the population peak that we infer from our data (top blue = bottom black), simulations show that we would not be able to infer it (bottom red).
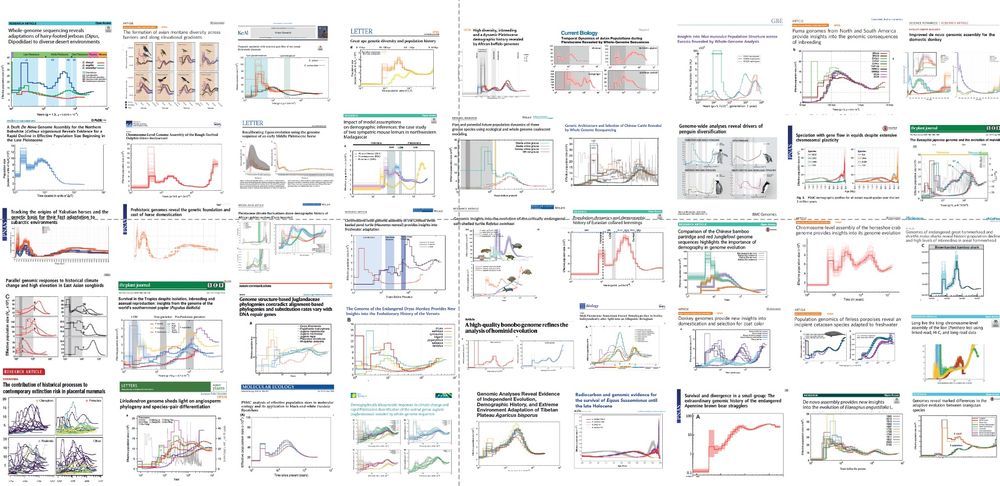
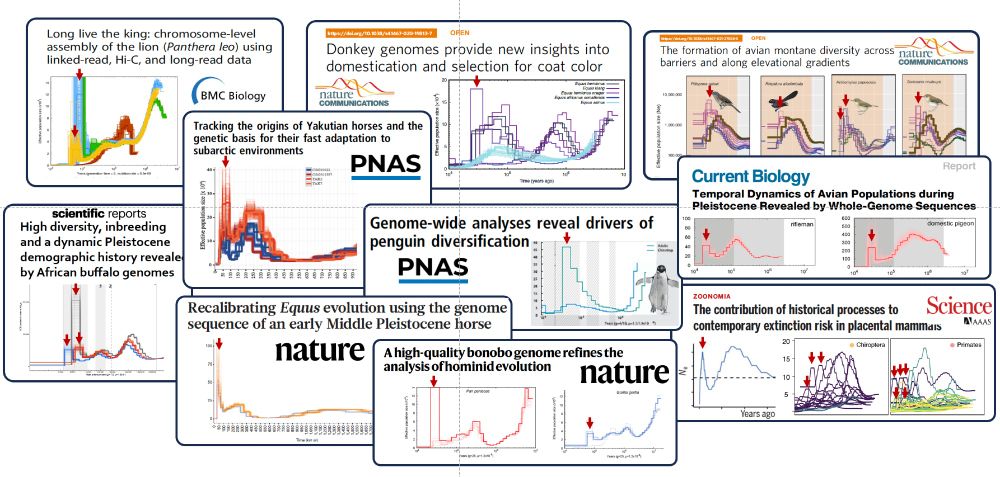
There are many, many more - we find hundreds of individual results like these (this is just a selection):

February 7, 2025 at 8:14 AM
There are many, many more - we find hundreds of individual results like these (this is just a selection):
These extreme peaks - spikes in effective population size (Ne) immediately followed by an even more extreme collapse are really common! Here are a few examples from the literature:
February 7, 2025 at 8:14 AM
These extreme peaks - spikes in effective population size (Ne) immediately followed by an even more extreme collapse are really common! Here are a few examples from the literature: