


Leo Feler
@leofeler.com
Chief Economist at Numerator and Visiting Economist at the Federal Reserve Bank of Chicago. Previously UCLA Anderson Forecast & Johns Hopkins.
I write about consumer behavior and macroeconomics.
Website: leofeler.com.
Chicago
Opinions are my own
I write about consumer behavior and macroeconomics.
Website: leofeler.com.
Chicago
Opinions are my own
Thanks to @bencasselman.bsky.social and @colbylsmith.bsky.social for featuring my comments. Here's a chart showing that spending on everyday household items tends to be more equal across income quintiles but has been growing more unequal over the past few years.
www.nytimes.com/2025/10/19/b...
www.nytimes.com/2025/10/19/b...

October 20, 2025 at 9:18 PM
Thanks to @bencasselman.bsky.social and @colbylsmith.bsky.social for featuring my comments. Here's a chart showing that spending on everyday household items tends to be more equal across income quintiles but has been growing more unequal over the past few years.
www.nytimes.com/2025/10/19/b...
www.nytimes.com/2025/10/19/b...
I think it's -38K for manufacturing and -78K for professional & business services.

September 5, 2025 at 8:33 PM
I think it's -38K for manufacturing and -78K for professional & business services.
This wouldn't even cover the higher costs the average American family will pay because of tariffs.
$3.3 Trillion in imports annually * 20% effective tariff rate = $660 Billion. Divide this by 132 million households in the US and each household is paying $5,000 a year in tariffs.
$3.3 Trillion in imports annually * 20% effective tariff rate = $660 Billion. Divide this by 132 million households in the US and each household is paying $5,000 a year in tariffs.

August 8, 2025 at 7:26 PM
This wouldn't even cover the higher costs the average American family will pay because of tariffs.
$3.3 Trillion in imports annually * 20% effective tariff rate = $660 Billion. Divide this by 132 million households in the US and each household is paying $5,000 a year in tariffs.
$3.3 Trillion in imports annually * 20% effective tariff rate = $660 Billion. Divide this by 132 million households in the US and each household is paying $5,000 a year in tariffs.
Looking forward to our new Congressional districts in Illinois.

August 4, 2025 at 9:11 PM
Looking forward to our new Congressional districts in Illinois.
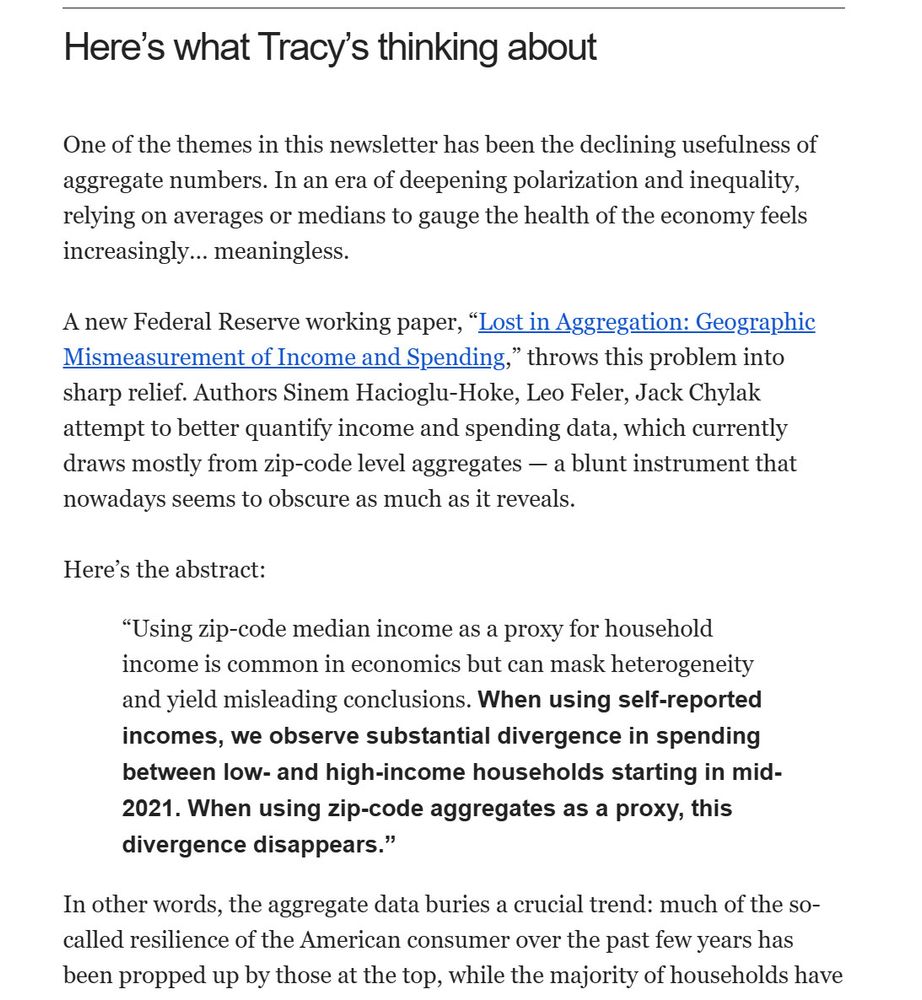
It's not every day that @tracyalloway.bsky.social mentions you in her Odd Lots newsletter. I have officially peaked!
cc: my all-star co-authors @shaciogluhoke.bsky.social and Jack Chylak.
www.bloomberg.com/news/newslet...
Thanks @tracyalloway.bsky.social and @bloomberg.com for featuring our work.
cc: my all-star co-authors @shaciogluhoke.bsky.social and Jack Chylak.
www.bloomberg.com/news/newslet...
Thanks @tracyalloway.bsky.social and @bloomberg.com for featuring our work.
July 21, 2025 at 4:41 PM
It's not every day that @tracyalloway.bsky.social mentions you in her Odd Lots newsletter. I have officially peaked!
cc: my all-star co-authors @shaciogluhoke.bsky.social and Jack Chylak.
www.bloomberg.com/news/newslet...
Thanks @tracyalloway.bsky.social and @bloomberg.com for featuring our work.
cc: my all-star co-authors @shaciogluhoke.bsky.social and Jack Chylak.
www.bloomberg.com/news/newslet...
Thanks @tracyalloway.bsky.social and @bloomberg.com for featuring our work.
Here's the gist of what I shared with Steve:
▪️ Low inc NYC residents don't consume that differently across grocery depts compared with high inc residents.
▪️ While there are food deserts, NYC is so dense and its residents are so mobile that there isn't an issue with access to nutritious foods.
▪️ Low inc NYC residents don't consume that differently across grocery depts compared with high inc residents.
▪️ While there are food deserts, NYC is so dense and its residents are so mobile that there isn't an issue with access to nutritious foods.

June 27, 2025 at 2:25 PM
Here's the gist of what I shared with Steve:
▪️ Low inc NYC residents don't consume that differently across grocery depts compared with high inc residents.
▪️ While there are food deserts, NYC is so dense and its residents are so mobile that there isn't an issue with access to nutritious foods.
▪️ Low inc NYC residents don't consume that differently across grocery depts compared with high inc residents.
▪️ While there are food deserts, NYC is so dense and its residents are so mobile that there isn't an issue with access to nutritious foods.
Fair point. Chicago 2018-2025 vs DC 2010-2018. Look at how cool our stations are: historic and you get to enjoy the beautiful Chicago weather*
* For 3 months each year.
* For 3 months each year.

June 2, 2025 at 10:40 PM
Fair point. Chicago 2018-2025 vs DC 2010-2018. Look at how cool our stations are: historic and you get to enjoy the beautiful Chicago weather*
* For 3 months each year.
* For 3 months each year.
We asked 2,000 representative US households what one word they would use to describe the United States.
We asked 1,000 representative Canadian households what one word they would use to describe Canada.
Here are the results from our latest survey (May 1-7):
We asked 1,000 representative Canadian households what one word they would use to describe Canada.
Here are the results from our latest survey (May 1-7):

May 12, 2025 at 9:50 PM
We asked 2,000 representative US households what one word they would use to describe the United States.
We asked 1,000 representative Canadian households what one word they would use to describe Canada.
Here are the results from our latest survey (May 1-7):
We asked 1,000 representative Canadian households what one word they would use to describe Canada.
Here are the results from our latest survey (May 1-7):
...Followed by actual receipt/transaction data for everyday purchases (e.g., what you buy at Walmart, Costco, Kroger, etc.) between 2019 and 2024, showing that even people who said "this is the worst we've been" were actually buying more things in 2024 than 2019.

May 7, 2025 at 8:30 PM
...Followed by actual receipt/transaction data for everyday purchases (e.g., what you buy at Walmart, Costco, Kroger, etc.) between 2019 and 2024, showing that even people who said "this is the worst we've been" were actually buying more things in 2024 than 2019.
We have this one from May-October 2024. Consumer sentiment depending on where you get your news/information from...

May 7, 2025 at 8:27 PM
We have this one from May-October 2024. Consumer sentiment depending on where you get your news/information from...
I wish I did. But instead, here's how this looks if we split among 20% of the population in the most right-leaning counties versus the 20% in the most left-leaning counties (by 2024 presidential vote share). From now on, we'll ask this question monthly as part of our consumer sentiment surveys.

May 7, 2025 at 8:25 PM
I wish I did. But instead, here's how this looks if we split among 20% of the population in the most right-leaning counties versus the 20% in the most left-leaning counties (by 2024 presidential vote share). From now on, we'll ask this question monthly as part of our consumer sentiment surveys.
So is the rest of the US. When asked to choose "one word" to describe the world today, here's what a representative sample of 2,500 households said.
You can barely see it, but "Jesus take the wheel" is my favorite.
You can barely see it, but "Jesus take the wheel" is my favorite.

May 7, 2025 at 7:45 PM
So is the rest of the US. When asked to choose "one word" to describe the world today, here's what a representative sample of 2,500 households said.
You can barely see it, but "Jesus take the wheel" is my favorite.
You can barely see it, but "Jesus take the wheel" is my favorite.
"What one word would you use to describe the world today?"
Here is a word cloud of the responses of 1,000 representative US households from Numerator panel data.
Here is a word cloud of the responses of 1,000 representative US households from Numerator panel data.

April 18, 2025 at 2:39 PM
"What one word would you use to describe the world today?"
Here is a word cloud of the responses of 1,000 representative US households from Numerator panel data.
Here is a word cloud of the responses of 1,000 representative US households from Numerator panel data.
@tracyalloway.bsky.social: to pay down the US deficit or fund regressive tax cuts?

March 26, 2025 at 3:23 PM
@tracyalloway.bsky.social: to pay down the US deficit or fund regressive tax cuts?
Thanks for your question! We should have clarified how big these differences are, so here's a version with standard deviations on the right axis.
Basically, from the healthiest point in January to the lowest point in December is a six standard deviation change and very statistically significant.
Basically, from the healthiest point in January to the lowest point in December is a six standard deviation change and very statistically significant.

March 16, 2025 at 8:42 PM
Thanks for your question! We should have clarified how big these differences are, so here's a version with standard deviations on the right axis.
Basically, from the healthiest point in January to the lowest point in December is a six standard deviation change and very statistically significant.
Basically, from the healthiest point in January to the lowest point in December is a six standard deviation change and very statistically significant.
@weisenthal.bsky.social can we really call this a "tariff negotiating strategy"? It seems to be more chaos, make things up as you go, than strategy.

March 7, 2025 at 10:33 PM
@weisenthal.bsky.social can we really call this a "tariff negotiating strategy"? It seems to be more chaos, make things up as you go, than strategy.
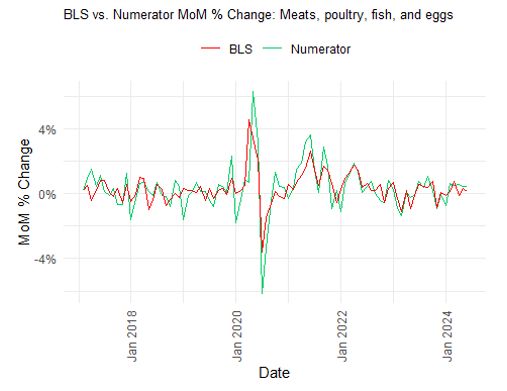
Econ friends with BLS experience: I'm getting close to replicating the BLS methodology to calculate the CPI for all the items we track at Numerator. This will be items purchased from retailers across the US. If anyone with BLS experience can help, please DM me.
#econsky
#econsky
February 5, 2025 at 3:10 AM
Econ friends with BLS experience: I'm getting close to replicating the BLS methodology to calculate the CPI for all the items we track at Numerator. This will be items purchased from retailers across the US. If anyone with BLS experience can help, please DM me.
#econsky
#econsky
Econ friends with BLS experience: I'm getting close to replicating the BLS methodology to calculate the CPI for all the items we track at Numerator. This will be items purchased from retailers across the US. If anyone with BLS experience can help, please DM me.
#econsky
@kairyssdal.bsky.social
#econsky
@kairyssdal.bsky.social
February 5, 2025 at 3:07 AM
Econ friends with BLS experience: I'm getting close to replicating the BLS methodology to calculate the CPI for all the items we track at Numerator. This will be items purchased from retailers across the US. If anyone with BLS experience can help, please DM me.
#econsky
@kairyssdal.bsky.social
#econsky
@kairyssdal.bsky.social
Will the Trump Administration reignite inflation?
Yes, most likely.
Full write-up here: www.macrobond.com/insights/out...
Yes, most likely.
Full write-up here: www.macrobond.com/insights/out...

January 15, 2025 at 6:54 PM
Will the Trump Administration reignite inflation?
Yes, most likely.
Full write-up here: www.macrobond.com/insights/out...
Yes, most likely.
Full write-up here: www.macrobond.com/insights/out...

Following-up on the FEDS Note doi.org/10.17016/238..., Numerator is now releasing a monthly decomposition of retail sales by household income:
leofeler.com/2024/12/17/n...
#econsky #numbersday
leofeler.com/2024/12/17/n...
#econsky #numbersday

December 17, 2024 at 2:49 PM
Following-up on the FEDS Note doi.org/10.17016/238..., Numerator is now releasing a monthly decomposition of retail sales by household income:
leofeler.com/2024/12/17/n...
#econsky #numbersday
leofeler.com/2024/12/17/n...
#econsky #numbersday
I keep looking at this chart and thinking of Margaret Thatcher's rebuke "you'd rather the poor were poorer provided the rich were less rich."

December 16, 2024 at 11:08 PM
I keep looking at this chart and thinking of Margaret Thatcher's rebuke "you'd rather the poor were poorer provided the rich were less rich."
TSA data:
Slightly less crowded than 2023 (as of 11/25). More crowded than prior years.
Slightly less crowded than 2023 (as of 11/25). More crowded than prior years.

November 26, 2024 at 11:59 PM
TSA data:
Slightly less crowded than 2023 (as of 11/25). More crowded than prior years.
Slightly less crowded than 2023 (as of 11/25). More crowded than prior years.
There are a lot of voters in Democratic leaning counties who now think things will be worse. But there are also a lot who now think things will be better. Perhaps that explains some of the voting shifts we saw between 2020 and 2024 in traditional Democratic strongholds.

November 25, 2024 at 8:54 PM
There are a lot of voters in Democratic leaning counties who now think things will be worse. But there are also a lot who now think things will be better. Perhaps that explains some of the voting shifts we saw between 2020 and 2024 in traditional Democratic strongholds.
Fascinating to see how consumers' views of their own financial conditions a year ahead changed pre and post election. We divide counties into quintiles of population (with roughly 20% of the US pop in each group) based on counties' vote shares for President in 2020. #EconSky

November 25, 2024 at 8:54 PM
Fascinating to see how consumers' views of their own financial conditions a year ahead changed pre and post election. We divide counties into quintiles of population (with roughly 20% of the US pop in each group) based on counties' vote shares for President in 2020. #EconSky