


Larissa Lachmann
@larissalachmann.bsky.social
Information Design | Infographics | Sustainability and Science Communication
Here’s one way to clarify your figures using contrast and font size. 👇 What would you like to improve in your next chart?
#sciviz #infodesign #scicomm #designprinciples
#sciviz #infodesign #scicomm #designprinciples

May 28, 2025 at 10:42 AM
Here’s one way to clarify your figures using contrast and font size. 👇 What would you like to improve in your next chart?
#sciviz #infodesign #scicomm #designprinciples
#sciviz #infodesign #scicomm #designprinciples
In science, we often assume the numbers will speak for themselves – but it’s a clear structure that makes them truly understandable.

May 28, 2025 at 10:42 AM
In science, we often assume the numbers will speak for themselves – but it’s a clear structure that makes them truly understandable.
You’ve got the data. You’ve got the chart.
But people still don’t understand your results?

May 28, 2025 at 10:42 AM
You’ve got the data. You’ve got the chart.
But people still don’t understand your results?
Visual Science Communication connects science with design – from one infographic to a whole project identity. Bridging both worlds is my strength. Let’s make your research visible.

May 22, 2025 at 8:57 AM
Visual Science Communication connects science with design – from one infographic to a whole project identity. Bridging both worlds is my strength. Let’s make your research visible.
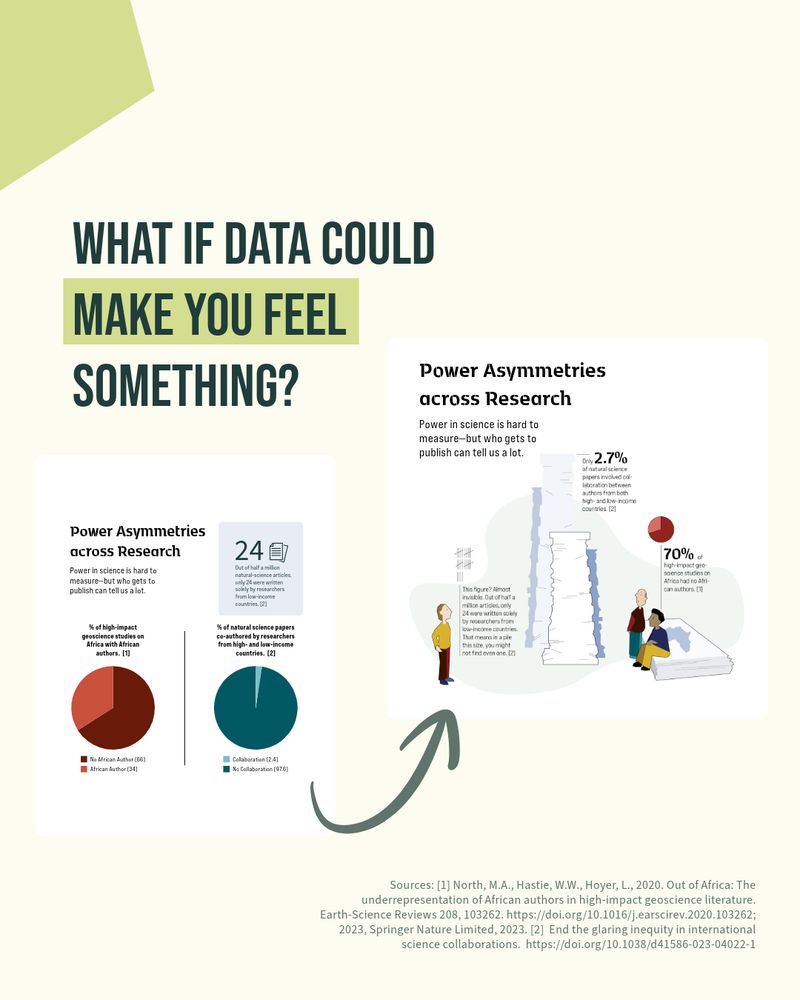
📚 Out of half a million natural-science articles, only 24 were written solely by researchers from low-income countries.https://doi.org/10.1038/d41586-023-04022-1
🌍 Over 70% of published geoscience articles on Africa included no African authors. doi.org/10.1016/j.ea...
🌍 Over 70% of published geoscience articles on Africa included no African authors. doi.org/10.1016/j.ea...

April 30, 2025 at 1:05 PM
📚 Out of half a million natural-science articles, only 24 were written solely by researchers from low-income countries.https://doi.org/10.1038/d41586-023-04022-1
🌍 Over 70% of published geoscience articles on Africa included no African authors. doi.org/10.1016/j.ea...
🌍 Over 70% of published geoscience articles on Africa included no African authors. doi.org/10.1016/j.ea...
There’s more than one way to show data. And sometimes, we need formats that don’t just inform — but move us.
👉 Which version would you use? How does it make you feel?
👉 Which version would you use? How does it make you feel?

April 30, 2025 at 1:05 PM
There’s more than one way to show data. And sometimes, we need formats that don’t just inform — but move us.
👉 Which version would you use? How does it make you feel?
👉 Which version would you use? How does it make you feel?
Most scientific figures aim to be clear.
But what if they also aimed to be compelling?
I love clean, well-structured data visuals — often, they’re exactly what’s needed.
But when data is about people — shouldn’t we also show them? #DataVisualization #SciComm @humboldteolab.bsky.social
But what if they also aimed to be compelling?
I love clean, well-structured data visuals — often, they’re exactly what’s needed.
But when data is about people — shouldn’t we also show them? #DataVisualization #SciComm @humboldteolab.bsky.social
April 30, 2025 at 1:05 PM
Most scientific figures aim to be clear.
But what if they also aimed to be compelling?
I love clean, well-structured data visuals — often, they’re exactly what’s needed.
But when data is about people — shouldn’t we also show them? #DataVisualization #SciComm @humboldteolab.bsky.social
But what if they also aimed to be compelling?
I love clean, well-structured data visuals — often, they’re exactly what’s needed.
But when data is about people — shouldn’t we also show them? #DataVisualization #SciComm @humboldteolab.bsky.social
Outreach can feel overwhelming: too short = oversimplified, too long = confusing, visuals = time sink, social media = full-time job. But with a solid plan & support, it gets easier, more fun—and less time-consuming. Curious? Let’s talk. #scicomm #sciart #infographics

March 26, 2025 at 9:36 AM
Outreach can feel overwhelming: too short = oversimplified, too long = confusing, visuals = time sink, social media = full-time job. But with a solid plan & support, it gets easier, more fun—and less time-consuming. Curious? Let’s talk. #scicomm #sciart #infographics
Things aren’t fine. A day on the water: beavers build, kingfishers hunt. Idyllic? Yet, environmental issues are treated as “nice-to-have.”
🔥 Fear alone won’t spark change - it leads to paralysis.
📈 Visualisation matters. Let’s get clearer, braver, better.
#scicomm #sciencecommunication #infographic
🔥 Fear alone won’t spark change - it leads to paralysis.
📈 Visualisation matters. Let’s get clearer, braver, better.
#scicomm #sciencecommunication #infographic


March 10, 2025 at 3:20 PM
Things aren’t fine. A day on the water: beavers build, kingfishers hunt. Idyllic? Yet, environmental issues are treated as “nice-to-have.”
🔥 Fear alone won’t spark change - it leads to paralysis.
📈 Visualisation matters. Let’s get clearer, braver, better.
#scicomm #sciencecommunication #infographic
🔥 Fear alone won’t spark change - it leads to paralysis.
📈 Visualisation matters. Let’s get clearer, braver, better.
#scicomm #sciencecommunication #infographic
You spend years on research - don’t let your findings get lost in complex charts or hidden reports. A well-designed #infographic can be used across formats: posters, social media, presentations, websites - saving time + increasing impact. #scicomm
Need visuals for your research group? Let’s talk!
Need visuals for your research group? Let’s talk!

March 5, 2025 at 3:47 PM
You spend years on research - don’t let your findings get lost in complex charts or hidden reports. A well-designed #infographic can be used across formats: posters, social media, presentations, websites - saving time + increasing impact. #scicomm
Need visuals for your research group? Let’s talk!
Need visuals for your research group? Let’s talk!
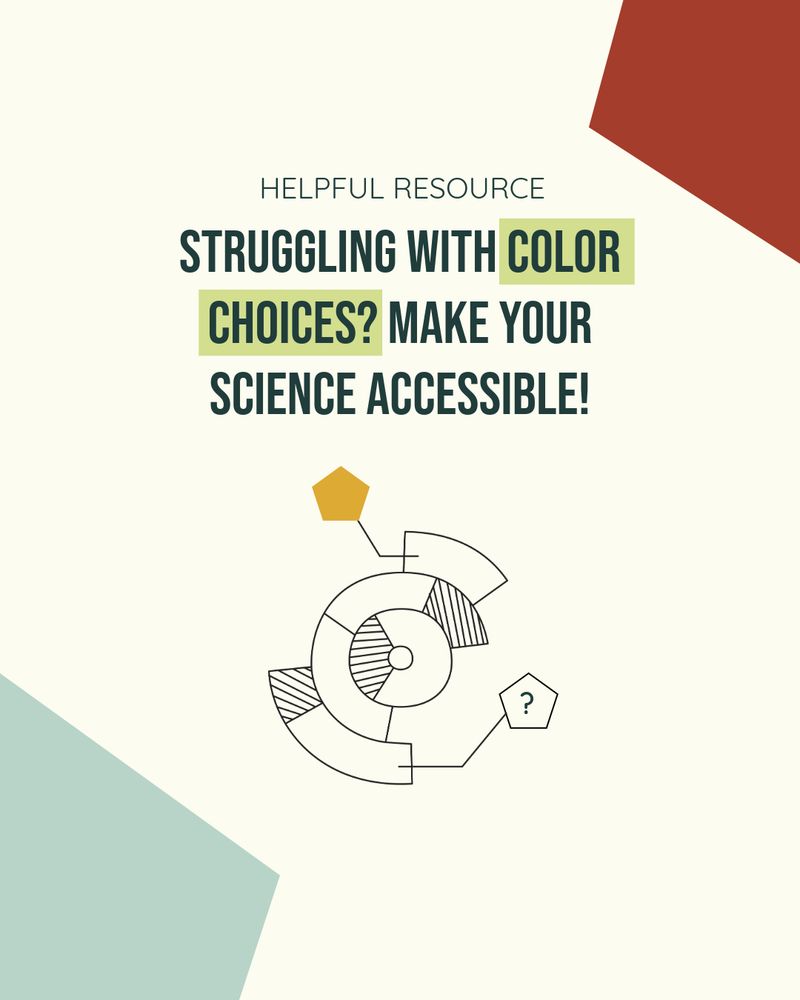
🎨 Need help choosing colors for scientific visuals? This tool ensures your graphics are not only beautiful but also colorblind-friendly! 📊 Check it out: personal.sron.nl/~pault/#sec:...
#SciComm #DataViz #ColorBlindness @lasseharkort.bsky.social
#SciComm #DataViz #ColorBlindness @lasseharkort.bsky.social
February 26, 2025 at 9:08 AM
🎨 Need help choosing colors for scientific visuals? This tool ensures your graphics are not only beautiful but also colorblind-friendly! 📊 Check it out: personal.sron.nl/~pault/#sec:...
#SciComm #DataViz #ColorBlindness @lasseharkort.bsky.social
#SciComm #DataViz #ColorBlindness @lasseharkort.bsky.social
Wie begeistere ich Menschen für komplexe Themen, wenn sie wenig Zeit haben? Mit Motivation! 5 Gestaltungstipps helfen: Relevanz zeigen, Ästhetik nutzen, klare Einstiege bieten, Komplexität schrittweise aufbauen & Geschichten erzählen. Mehr dazu im Post! #Infodesign #infographic #sciencecommunication

February 19, 2025 at 10:14 AM
Wie begeistere ich Menschen für komplexe Themen, wenn sie wenig Zeit haben? Mit Motivation! 5 Gestaltungstipps helfen: Relevanz zeigen, Ästhetik nutzen, klare Einstiege bieten, Komplexität schrittweise aufbauen & Geschichten erzählen. Mehr dazu im Post! #Infodesign #infographic #sciencecommunication
Fakten reichen nicht, um Probleme zu lösen. Ein Beispiel: die Klimakrise. Das Wissen ist da, doch das Verstehen fehlt oft – es wirkt zu komplex. Genau hier setzt gutes #Informationsdesign an: Es hilft, Wissen in Verstehen zu verwandeln – und damit wirksame Kommunikation zu ermöglichen.
February 11, 2025 at 3:54 PM
Fakten reichen nicht, um Probleme zu lösen. Ein Beispiel: die Klimakrise. Das Wissen ist da, doch das Verstehen fehlt oft – es wirkt zu komplex. Genau hier setzt gutes #Informationsdesign an: Es hilft, Wissen in Verstehen zu verwandeln – und damit wirksame Kommunikation zu ermöglichen.
🔍 Infografik oder nicht? Eine gute Visualisierung kann komplexe Inhalte verständlicher machen – aber ist sie immer die beste Wahl? Diese 4 Fragen helfen dir, die richtige Entscheidung zu treffen. ⬇️


February 5, 2025 at 2:28 PM
🔍 Infografik oder nicht? Eine gute Visualisierung kann komplexe Inhalte verständlicher machen – aber ist sie immer die beste Wahl? Diese 4 Fragen helfen dir, die richtige Entscheidung zu treffen. ⬇️
Physical Limits of Data Storage. 90% of global data created in just 2 years, yet storage remains physical. Even clouds need real servers, energy & resources.
The future? AI compression, flash storage & quantum solutions might save our digital footprint. #infographic #datastorageA
The future? AI compression, flash storage & quantum solutions might save our digital footprint. #infographic #datastorageA


January 29, 2025 at 11:18 AM
Physical Limits of Data Storage. 90% of global data created in just 2 years, yet storage remains physical. Even clouds need real servers, energy & resources.
The future? AI compression, flash storage & quantum solutions might save our digital footprint. #infographic #datastorageA
The future? AI compression, flash storage & quantum solutions might save our digital footprint. #infographic #datastorageA
2025 is here, and I'm ready for big adventures: Taking the leap into self-employment as an infographic designer, bringing complex topics to life visually. Along with this, a personal challenge awaits - my first triathlon. I'm excited to tackle both with full energy!
January 21, 2025 at 2:35 PM
2025 is here, and I'm ready for big adventures: Taking the leap into self-employment as an infographic designer, bringing complex topics to life visually. Along with this, a personal challenge awaits - my first triathlon. I'm excited to tackle both with full energy!
Here are the first close-ups from my infographic about city-animals and their survival strategies in winter. This overview shows which amazing survival artists live in our cities - from foraging for food (🌱) to sleeping spots (★) to sophisticated methods of staying warm (♨).


January 15, 2025 at 10:13 AM
Here are the first close-ups from my infographic about city-animals and their survival strategies in winter. This overview shows which amazing survival artists live in our cities - from foraging for food (🌱) to sleeping spots (★) to sophisticated methods of staying warm (♨).
Wie halten sich Tiere warm, wenn's draußen kalt wird? 🥶 Hier ein paar Antworten. Die Arbeit an dieser Infografik hat mir wieder gezeigt, wie toll es ist, mit Vektoren zu arbeiten - sie lassen sich so leicht anpassen. Die Close-Ups kommen in den nächsten Tagen 🔎

January 10, 2025 at 10:51 AM
Wie halten sich Tiere warm, wenn's draußen kalt wird? 🥶 Hier ein paar Antworten. Die Arbeit an dieser Infografik hat mir wieder gezeigt, wie toll es ist, mit Vektoren zu arbeiten - sie lassen sich so leicht anpassen. Die Close-Ups kommen in den nächsten Tagen 🔎
Tiere der Nacht - führen ein aufregendes Leben. Gerade aktuell, kann man sie überall beobachten. Außer natürlich den Igel - der macht Winterschlaf 🦔

January 9, 2025 at 11:37 AM
Tiere der Nacht - führen ein aufregendes Leben. Gerade aktuell, kann man sie überall beobachten. Außer natürlich den Igel - der macht Winterschlaf 🦔