


The Keeling Curve
@keelingcurve.bsky.social
Official daily update on atmospheric CO2 levels in the post-400 ppm era from Scripps Institution of Oceanography's iconic Keeling Curve.
426.15 parts per million (ppm) CO2 in air 18-Nov-2025
keelingcurve.ucsd.edu
keelingcurve.ucsd.edu
The Keeling Curve
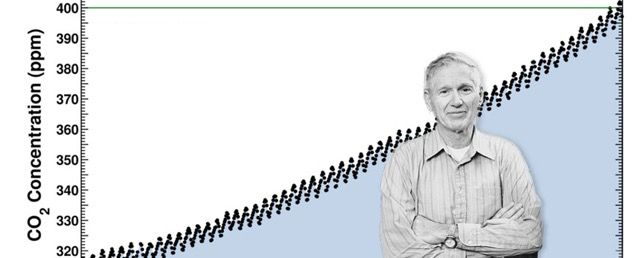
The Keeling Curve is a daily record of global atmospheric carbon dioxide concentration maintained by Scripps Institution of Oceanography at UC San Diego.
keelingcurve.ucsd.edu
November 19, 2025 at 11:25 PM
426.15 parts per million (ppm) CO2 in air 18-Nov-2025
keelingcurve.ucsd.edu
keelingcurve.ucsd.edu
426.48 parts per million (ppm) CO2 in air 17-Nov-2025
keelingcurve.ucsd.edu
keelingcurve.ucsd.edu
The Keeling Curve
The Keeling Curve is a daily record of global atmospheric carbon dioxide concentration maintained by Scripps Institution of Oceanography at UC San Diego.
keelingcurve.ucsd.edu
November 18, 2025 at 6:51 PM
426.48 parts per million (ppm) CO2 in air 17-Nov-2025
keelingcurve.ucsd.edu
keelingcurve.ucsd.edu
426.32 parts per million (ppm) CO2 in air 16-Nov-2025
keelingcurve.ucsd.edu
keelingcurve.ucsd.edu
The Keeling Curve
The Keeling Curve is a daily record of global atmospheric carbon dioxide concentration maintained by Scripps Institution of Oceanography at UC San Diego.
keelingcurve.ucsd.edu
November 17, 2025 at 5:11 PM
426.32 parts per million (ppm) CO2 in air 16-Nov-2025
keelingcurve.ucsd.edu
keelingcurve.ucsd.edu
426.46 parts per million (ppm) CO2 in air 15-Nov-2025
keelingcurve.ucsd.edu
keelingcurve.ucsd.edu
The Keeling Curve
The Keeling Curve is a daily record of global atmospheric carbon dioxide concentration maintained by Scripps Institution of Oceanography at UC San Diego.
keelingcurve.ucsd.edu
November 16, 2025 at 7:31 PM
426.46 parts per million (ppm) CO2 in air 15-Nov-2025
keelingcurve.ucsd.edu
keelingcurve.ucsd.edu
427.55 parts per million (ppm) CO2 in air 14-Nov-2025
keelingcurve.ucsd.edu
keelingcurve.ucsd.edu
The Keeling Curve
The Keeling Curve is a daily record of global atmospheric carbon dioxide concentration maintained by Scripps Institution of Oceanography at UC San Diego.
keelingcurve.ucsd.edu
November 15, 2025 at 7:36 PM
427.55 parts per million (ppm) CO2 in air 14-Nov-2025
keelingcurve.ucsd.edu
keelingcurve.ucsd.edu
426.57 parts per million (ppm) CO2 in air 13-Nov-2025
keelingcurve.ucsd.edu
keelingcurve.ucsd.edu
The Keeling Curve
The Keeling Curve is a daily record of global atmospheric carbon dioxide concentration maintained by Scripps Institution of Oceanography at UC San Diego.
keelingcurve.ucsd.edu
November 14, 2025 at 5:17 PM
426.57 parts per million (ppm) CO2 in air 13-Nov-2025
keelingcurve.ucsd.edu
keelingcurve.ucsd.edu
426.31 parts per million (ppm) CO2 in air 12-Nov-2025
keelingcurve.ucsd.edu
keelingcurve.ucsd.edu
The Keeling Curve
The Keeling Curve is a daily record of global atmospheric carbon dioxide concentration maintained by Scripps Institution of Oceanography at UC San Diego.
keelingcurve.ucsd.edu
November 13, 2025 at 5:16 PM
426.31 parts per million (ppm) CO2 in air 12-Nov-2025
keelingcurve.ucsd.edu
keelingcurve.ucsd.edu
426.35 parts per million (ppm) CO2 in air 11-Nov-2025
keelingcurve.ucsd.edu
keelingcurve.ucsd.edu
The Keeling Curve
The Keeling Curve is a daily record of global atmospheric carbon dioxide concentration maintained by Scripps Institution of Oceanography at UC San Diego.
keelingcurve.ucsd.edu
November 12, 2025 at 5:12 PM
426.35 parts per million (ppm) CO2 in air 11-Nov-2025
keelingcurve.ucsd.edu
keelingcurve.ucsd.edu
425.61 parts per million (ppm) CO2 in air 10-Nov-2025
keelingcurve.ucsd.edu
keelingcurve.ucsd.edu
The Keeling Curve
The Keeling Curve is a daily record of global atmospheric carbon dioxide concentration maintained by Scripps Institution of Oceanography at UC San Diego.
keelingcurve.ucsd.edu
November 11, 2025 at 9:20 PM
425.61 parts per million (ppm) CO2 in air 10-Nov-2025
keelingcurve.ucsd.edu
keelingcurve.ucsd.edu
Baseline reading not available, data too variable 09-Nov-2025
keelingcurve.ucsd.edu
keelingcurve.ucsd.edu
The Keeling Curve
The Keeling Curve is a daily record of global atmospheric carbon dioxide concentration maintained by Scripps Institution of Oceanography at UC San Diego.
keelingcurve.ucsd.edu
November 10, 2025 at 5:51 PM
Baseline reading not available, data too variable 09-Nov-2025
keelingcurve.ucsd.edu
keelingcurve.ucsd.edu
424.54 parts per million (ppm) CO2 in air 08-Nov-2025
keelingcurve.ucsd.edu
keelingcurve.ucsd.edu
The Keeling Curve
The Keeling Curve is a daily record of global atmospheric carbon dioxide concentration maintained by Scripps Institution of Oceanography at UC San Diego.
keelingcurve.ucsd.edu
November 9, 2025 at 6:40 PM
424.54 parts per million (ppm) CO2 in air 08-Nov-2025
keelingcurve.ucsd.edu
keelingcurve.ucsd.edu
Baseline reading not available, data too variable 07-Nov-2025
keelingcurve.ucsd.edu
keelingcurve.ucsd.edu
The Keeling Curve
The Keeling Curve is a daily record of global atmospheric carbon dioxide concentration maintained by Scripps Institution of Oceanography at UC San Diego.
keelingcurve.ucsd.edu
November 8, 2025 at 10:20 PM
Baseline reading not available, data too variable 07-Nov-2025
keelingcurve.ucsd.edu
keelingcurve.ucsd.edu
424.47 parts per million (ppm) CO2 in air 06-Nov-2025
keelingcurve.ucsd.edu
keelingcurve.ucsd.edu
The Keeling Curve
The Keeling Curve is a daily record of global atmospheric carbon dioxide concentration maintained by Scripps Institution of Oceanography at UC San Diego.
keelingcurve.ucsd.edu
November 7, 2025 at 8:37 PM
424.47 parts per million (ppm) CO2 in air 06-Nov-2025
keelingcurve.ucsd.edu
keelingcurve.ucsd.edu
424.33 parts per million (ppm) CO2 in air 05-Nov-2025
keelingcurve.ucsd.edu
keelingcurve.ucsd.edu
The Keeling Curve
The Keeling Curve is a daily record of global atmospheric carbon dioxide concentration maintained by Scripps Institution of Oceanography at UC San Diego.
keelingcurve.ucsd.edu
November 6, 2025 at 5:26 PM
424.33 parts per million (ppm) CO2 in air 05-Nov-2025
keelingcurve.ucsd.edu
keelingcurve.ucsd.edu
423.82 parts per million (ppm) CO2 in air 03-Nov-2025
keelingcurve.ucsd.edu
keelingcurve.ucsd.edu
The Keeling Curve
The Keeling Curve is a daily record of global atmospheric carbon dioxide concentration maintained by Scripps Institution of Oceanography at UC San Diego.
keelingcurve.ucsd.edu
November 5, 2025 at 3:22 AM
423.82 parts per million (ppm) CO2 in air 03-Nov-2025
keelingcurve.ucsd.edu
keelingcurve.ucsd.edu
Baseline reading not available, data too variable 02-Nov-2025
keelingcurve.ucsd.edu
keelingcurve.ucsd.edu
The Keeling Curve
The Keeling Curve is a daily record of global atmospheric carbon dioxide concentration maintained by Scripps Institution of Oceanography at UC San Diego.
keelingcurve.ucsd.edu
November 3, 2025 at 5:11 PM
Baseline reading not available, data too variable 02-Nov-2025
keelingcurve.ucsd.edu
keelingcurve.ucsd.edu
425.27 parts per million (ppm) CO2 in air 01-Nov-2025
keelingcurve.ucsd.edu
keelingcurve.ucsd.edu
The Keeling Curve
The Keeling Curve is a daily record of global atmospheric carbon dioxide concentration maintained by Scripps Institution of Oceanography at UC San Diego.
keelingcurve.ucsd.edu
November 3, 2025 at 1:17 AM
425.27 parts per million (ppm) CO2 in air 01-Nov-2025
keelingcurve.ucsd.edu
keelingcurve.ucsd.edu
Baseline reading not available, data too variable 31-Oct-2025
keelingcurve.ucsd.edu
keelingcurve.ucsd.edu
The Keeling Curve
The Keeling Curve is a daily record of global atmospheric carbon dioxide concentration maintained by Scripps Institution of Oceanography at UC San Diego.
keelingcurve.ucsd.edu
November 1, 2025 at 4:07 PM
Baseline reading not available, data too variable 31-Oct-2025
keelingcurve.ucsd.edu
keelingcurve.ucsd.edu
425.19 parts per million (ppm) CO2 in air 30-Oct-2025
keelingcurve.ucsd.edu
keelingcurve.ucsd.edu
The Keeling Curve
The Keeling Curve is a daily record of global atmospheric carbon dioxide concentration maintained by Scripps Institution of Oceanography at UC San Diego.
keelingcurve.ucsd.edu
November 1, 2025 at 1:45 AM
425.19 parts per million (ppm) CO2 in air 30-Oct-2025
keelingcurve.ucsd.edu
keelingcurve.ucsd.edu
425.34 parts per million (ppm) CO2 in air 29-Oct-2025
keelingcurve.ucsd.edu
keelingcurve.ucsd.edu
The Keeling Curve
The Keeling Curve is a daily record of global atmospheric carbon dioxide concentration maintained by Scripps Institution of Oceanography at UC San Diego.
keelingcurve.ucsd.edu
October 30, 2025 at 5:18 PM
425.34 parts per million (ppm) CO2 in air 29-Oct-2025
keelingcurve.ucsd.edu
keelingcurve.ucsd.edu
424.64 parts per million (ppm) CO2 in air 28-Oct-2025
keelingcurve.ucsd.edu
keelingcurve.ucsd.edu
The Keeling Curve
The Keeling Curve is a daily record of global atmospheric carbon dioxide concentration maintained by Scripps Institution of Oceanography at UC San Diego.
keelingcurve.ucsd.edu
October 29, 2025 at 9:56 PM
424.64 parts per million (ppm) CO2 in air 28-Oct-2025
keelingcurve.ucsd.edu
keelingcurve.ucsd.edu
424.71 parts per million (ppm) CO2 in air 27-Oct-2025
keelingcurve.ucsd.edu
keelingcurve.ucsd.edu
The Keeling Curve
The Keeling Curve is a daily record of global atmospheric carbon dioxide concentration maintained by Scripps Institution of Oceanography at UC San Diego.
keelingcurve.ucsd.edu
October 29, 2025 at 4:10 AM
424.71 parts per million (ppm) CO2 in air 27-Oct-2025
keelingcurve.ucsd.edu
keelingcurve.ucsd.edu
424.80 parts per million (ppm) CO2 in air 25-Oct-2025
keelingcurve.ucsd.edu
keelingcurve.ucsd.edu
The Keeling Curve
The Keeling Curve is a daily record of global atmospheric carbon dioxide concentration maintained by Scripps Institution of Oceanography at UC San Diego.
keelingcurve.ucsd.edu
October 26, 2025 at 4:13 PM
424.80 parts per million (ppm) CO2 in air 25-Oct-2025
keelingcurve.ucsd.edu
keelingcurve.ucsd.edu
425.45 parts per million (ppm) CO2 in air 24-Oct-2025
keelingcurve.ucsd.edu
keelingcurve.ucsd.edu
The Keeling Curve
The Keeling Curve is a daily record of global atmospheric carbon dioxide concentration maintained by Scripps Institution of Oceanography at UC San Diego.
keelingcurve.ucsd.edu
October 25, 2025 at 4:28 PM
425.45 parts per million (ppm) CO2 in air 24-Oct-2025
keelingcurve.ucsd.edu
keelingcurve.ucsd.edu
424.89 parts per million (ppm) CO2 in air 22-Oct-2025
keelingcurve.ucsd.edu
keelingcurve.ucsd.edu
The Keeling Curve
The Keeling Curve is a daily record of global atmospheric carbon dioxide concentration maintained by Scripps Institution of Oceanography at UC San Diego.
keelingcurve.ucsd.edu
October 23, 2025 at 4:07 PM
424.89 parts per million (ppm) CO2 in air 22-Oct-2025
keelingcurve.ucsd.edu
keelingcurve.ucsd.edu