


Jon Rothbaum
@jlrothbaum.bsky.social
Economist, U.S. Census Bureau,
Returned Peace Corps Volunteer, Ecuador
(All opinions are mine).
https://jrothbaum.github.io/
Returned Peace Corps Volunteer, Ecuador
(All opinions are mine).
https://jrothbaum.github.io/
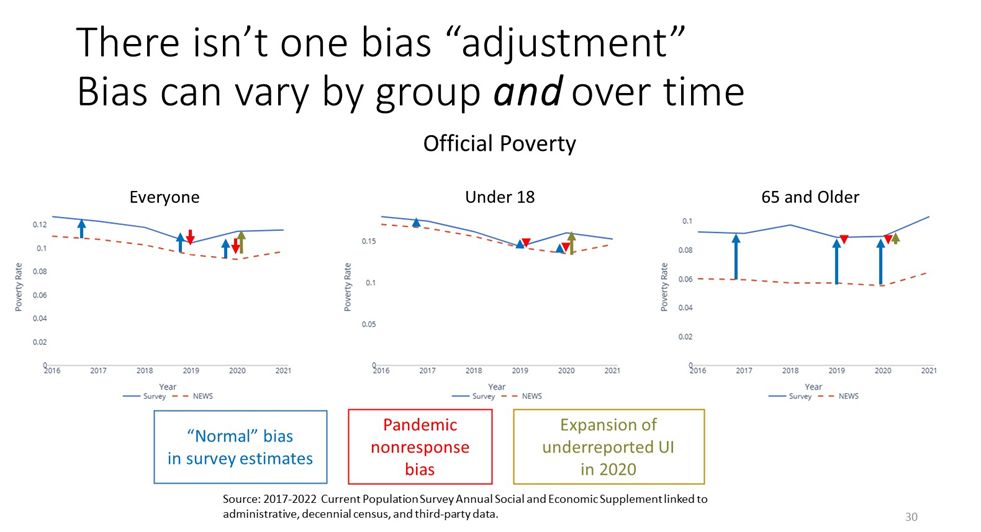
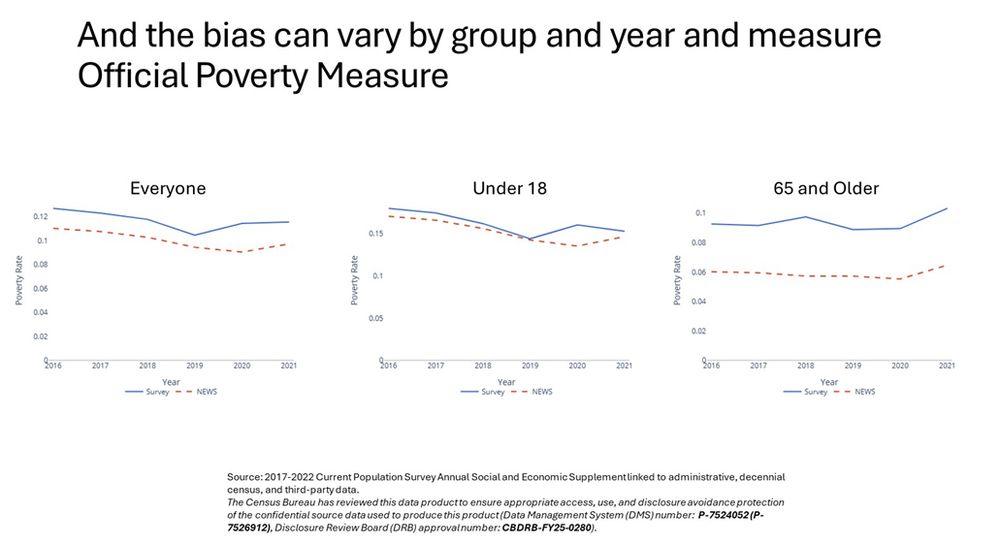
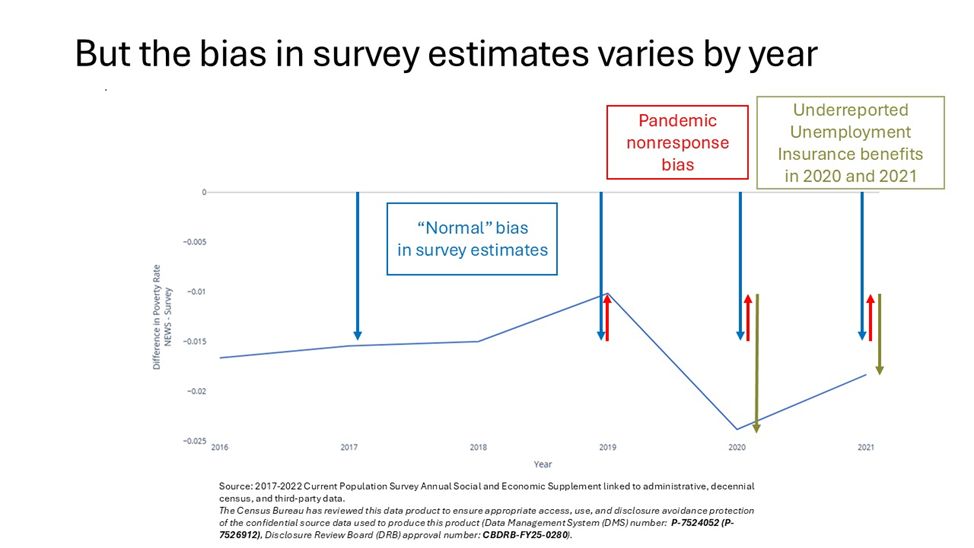
As noted above, the bias can vary a lot across groups and over time. Underreporting of UI benefits can cause bias in child poverty (their parents are likely to work and therefore collect UI in a downturn) but won’t impact elderly poverty much.
July 14, 2025 at 12:38 PM
As noted above, the bias can vary a lot across groups and over time. Underreporting of UI benefits can cause bias in child poverty (their parents are likely to work and therefore collect UI in a downturn) but won’t impact elderly poverty much.
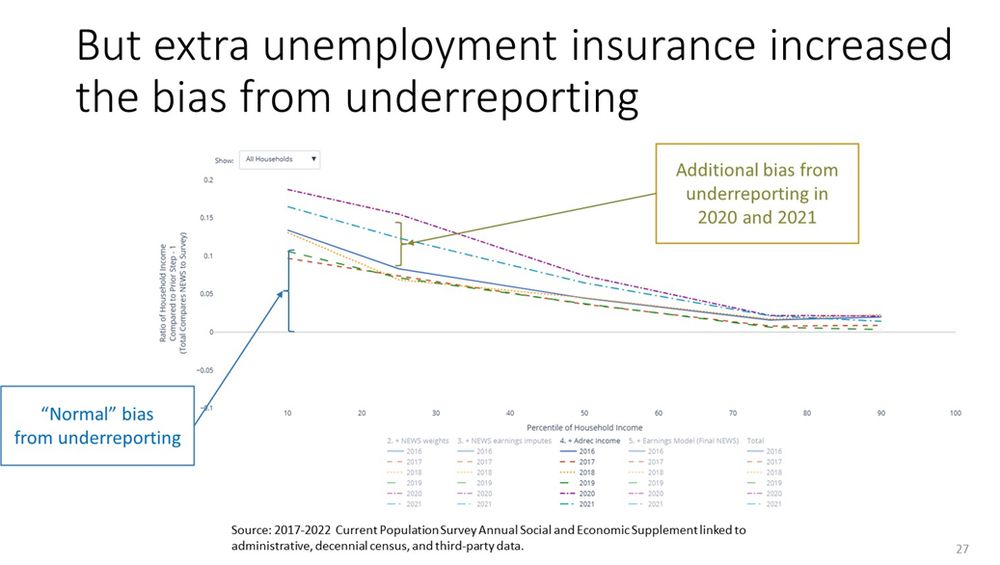
Likewise, we see more missing income, when income shifts from well-reported sources (like wage and salary earnings) to ones with greater underreporting (like unemployment insurance, or UI) in 2020 and 2021.
July 14, 2025 at 12:38 PM
Likewise, we see more missing income, when income shifts from well-reported sources (like wage and salary earnings) to ones with greater underreporting (like unemployment insurance, or UI) in 2020 and 2021.
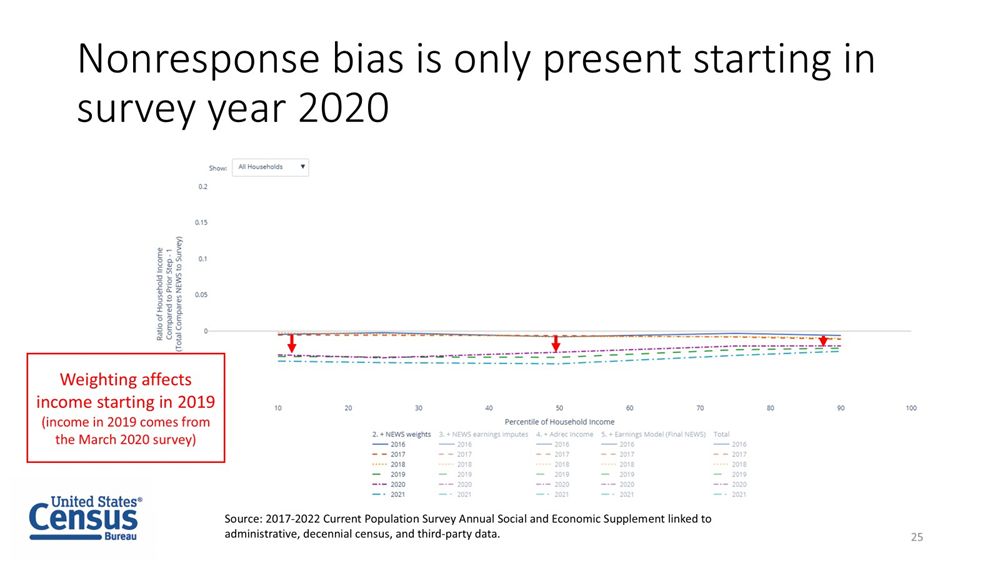
We said Pandemic nonresponse bias started affecting the data in 2020, but how do we know this? We can look at the results after each step. Our weighting adjustment only starts affecting our estimates for surveys conducted in 2020, affecting income estimates from 2019 forward.
July 14, 2025 at 12:38 PM
We said Pandemic nonresponse bias started affecting the data in 2020, but how do we know this? We can look at the results after each step. Our weighting adjustment only starts affecting our estimates for surveys conducted in 2020, affecting income estimates from 2019 forward.
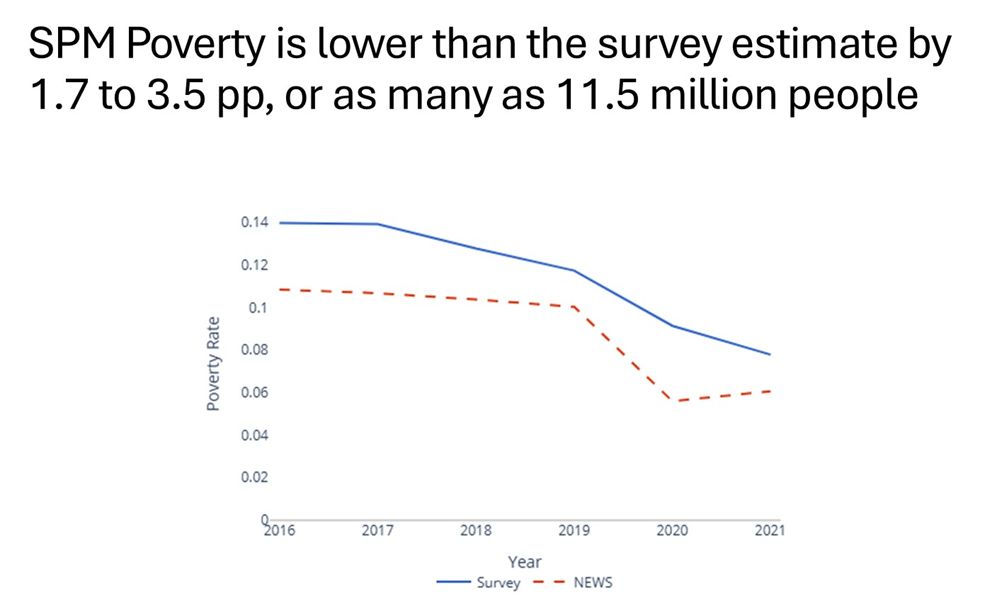
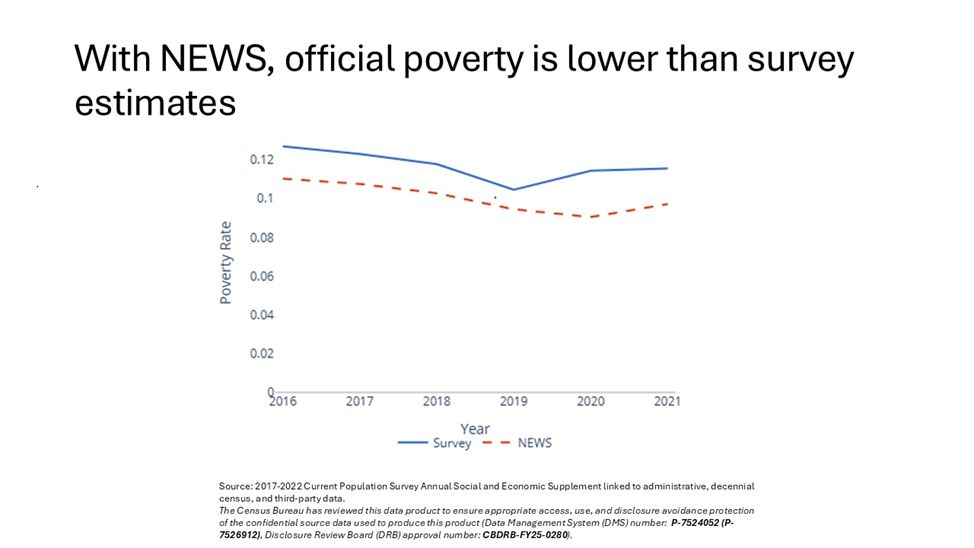
Our post-tax income+in-kind transfer measure mirrors the resource measure used to calculate the Supplemental Poverty Measure (SPM).
The NEWS SPM rate is 1.7 to 3.5pp lower than the survey, depending on the year, with as many as 11.5 million fewer people in poverty.
The NEWS SPM rate is 1.7 to 3.5pp lower than the survey, depending on the year, with as many as 11.5 million fewer people in poverty.
July 14, 2025 at 12:38 PM
Our post-tax income+in-kind transfer measure mirrors the resource measure used to calculate the Supplemental Poverty Measure (SPM).
The NEWS SPM rate is 1.7 to 3.5pp lower than the survey, depending on the year, with as many as 11.5 million fewer people in poverty.
The NEWS SPM rate is 1.7 to 3.5pp lower than the survey, depending on the year, with as many as 11.5 million fewer people in poverty.
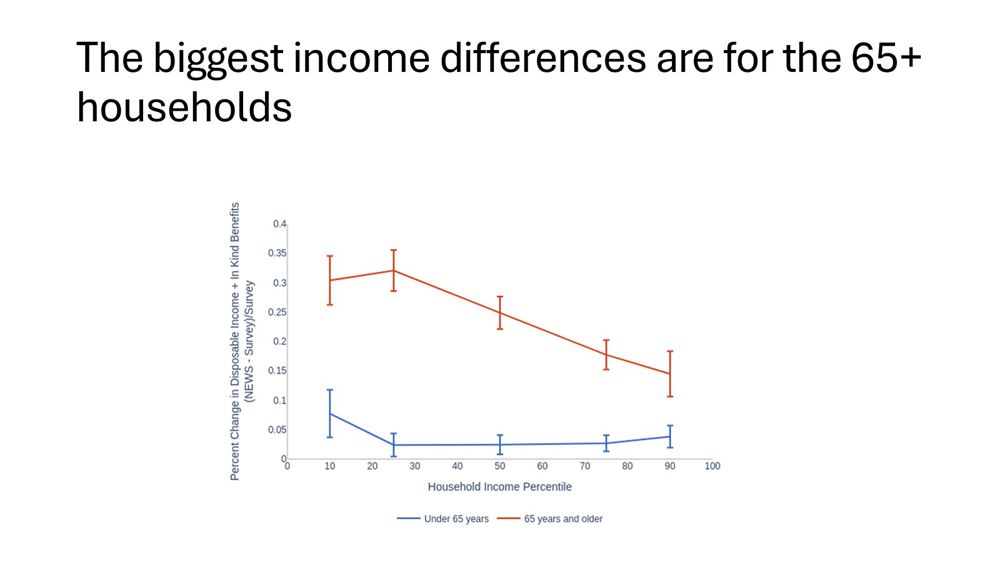
Split the effect by age, and we see the biggest change is among seniors, who tend to underreport other sources of retirement income (from 2018).
July 14, 2025 at 12:38 PM
Split the effect by age, and we see the biggest change is among seniors, who tend to underreport other sources of retirement income (from 2018).
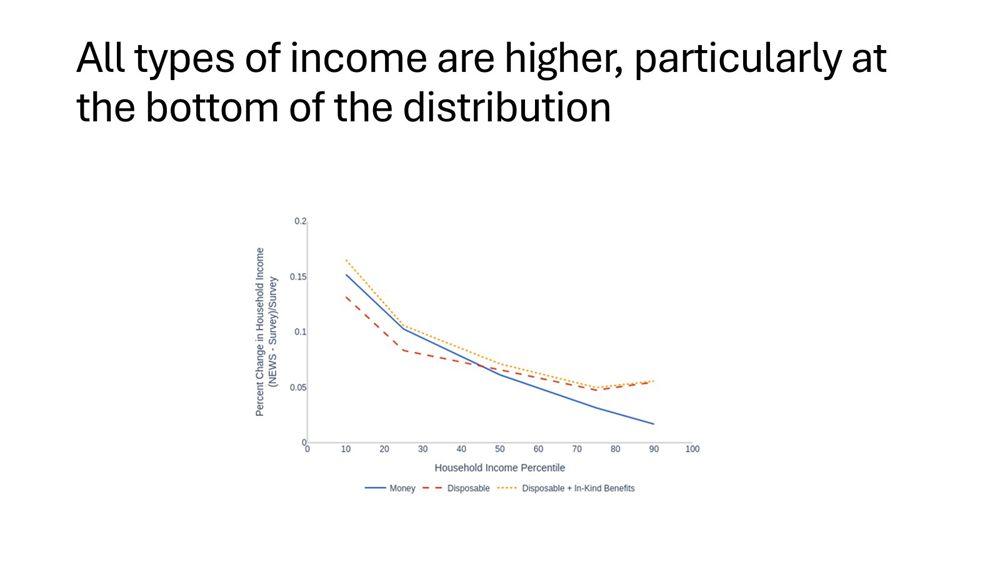
We estimate three income measures: money income, post-tax income, and post-tax income+in-kind transfers (excluding health insurance).
Relative to the survey, our estimates of all three measures increase across the income distribution (shown from 2018)
Relative to the survey, our estimates of all three measures increase across the income distribution (shown from 2018)
July 14, 2025 at 12:38 PM
We estimate three income measures: money income, post-tax income, and post-tax income+in-kind transfers (excluding health insurance).
Relative to the survey, our estimates of all three measures increase across the income distribution (shown from 2018)
Relative to the survey, our estimates of all three measures increase across the income distribution (shown from 2018)
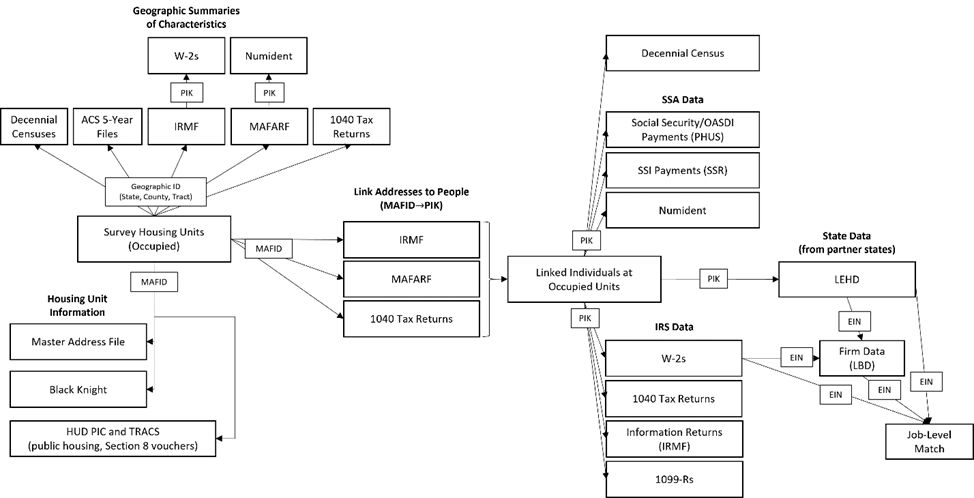
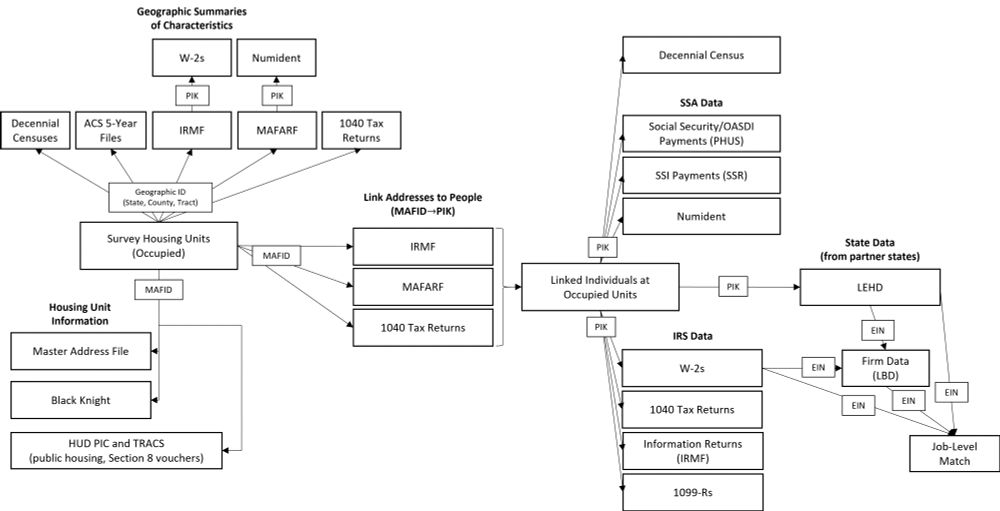
Beyond the tldr;! We use CPS ASEC (source of official income and poverty), 1040s, W2s, info tax returns, LEHD, ACS, census, OASDI and SSI payments, federal and state safety net data (housing assistance, SNAP, TANF, and WIC), firm data, and commercial data on home values.
July 14, 2025 at 12:38 PM
Beyond the tldr;! We use CPS ASEC (source of official income and poverty), 1040s, W2s, info tax returns, LEHD, ACS, census, OASDI and SSI payments, federal and state safety net data (housing assistance, SNAP, TANF, and WIC), firm data, and commercial data on home values.
This varies by group. Parents have mostly wage and salary earnings, which is well reported: not much normal bias, but lots of underreporting of UI in 2020. Those 65+ have lots of retirement income: lots of normal bias, but not much change in 2020 or 2021.
July 14, 2025 at 12:38 PM
This varies by group. Parents have mostly wage and salary earnings, which is well reported: not much normal bias, but lots of underreporting of UI in 2020. Those 65+ have lots of retirement income: lots of normal bias, but not much change in 2020 or 2021.
But the bias varies by year 1) in each year there’s “normal” bias from underreporting of income, like pensions, 2) From 2020 on, high income households respond at higher rates, 3) some income is reported better than others, and UI is not well reported, so UI ↑ in 2020 => bias ↑
July 14, 2025 at 12:38 PM
But the bias varies by year 1) in each year there’s “normal” bias from underreporting of income, like pensions, 2) From 2020 on, high income households respond at higher rates, 3) some income is reported better than others, and UI is not well reported, so UI ↑ in 2020 => bias ↑
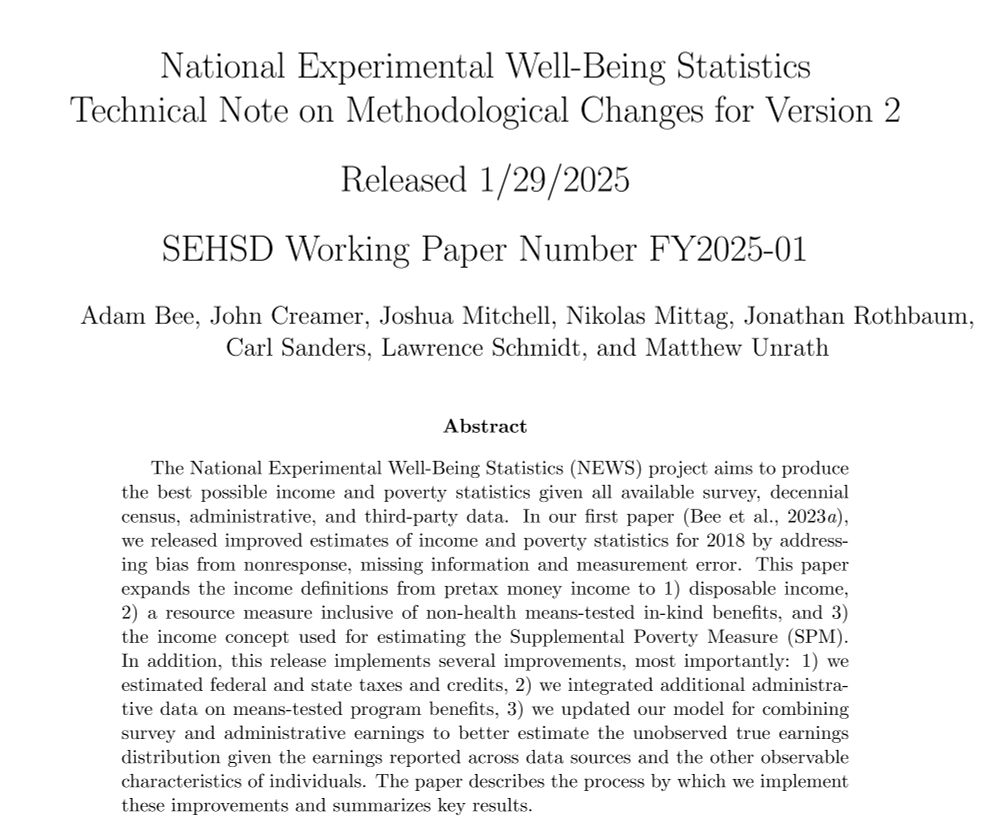
New research from the NEWS project on income and poverty from 2016-2021
Using survey, census, admin and commercial data, we show that survey estimates understate income and overstate poverty.
Release at www.census.gov/data/experim..., interactive plots at jrothbaum.github.io/news.html
Using survey, census, admin and commercial data, we show that survey estimates understate income and overstate poverty.
Release at www.census.gov/data/experim..., interactive plots at jrothbaum.github.io/news.html
July 14, 2025 at 12:38 PM
New research from the NEWS project on income and poverty from 2016-2021
Using survey, census, admin and commercial data, we show that survey estimates understate income and overstate poverty.
Release at www.census.gov/data/experim..., interactive plots at jrothbaum.github.io/news.html
Using survey, census, admin and commercial data, we show that survey estimates understate income and overstate poverty.
Release at www.census.gov/data/experim..., interactive plots at jrothbaum.github.io/news.html
Reposting the image in a different format...
January 29, 2025 at 3:28 PM
Reposting the image in a different format...
Our adjustments imply different anti-poverty effects of some programs and expenses.
The biggest change is for Social Security, which has a smaller impact because fewer people 65+ are poor before its inclusion.
Effects of SNAP and housing rise, but SSI and tax credits fall. (10/n)
The biggest change is for Social Security, which has a smaller impact because fewer people 65+ are poor before its inclusion.
Effects of SNAP and housing rise, but SSI and tax credits fall. (10/n)

January 29, 2025 at 3:22 PM
Our adjustments imply different anti-poverty effects of some programs and expenses.
The biggest change is for Social Security, which has a smaller impact because fewer people 65+ are poor before its inclusion.
Effects of SNAP and housing rise, but SSI and tax credits fall. (10/n)
The biggest change is for Social Security, which has a smaller impact because fewer people 65+ are poor before its inclusion.
Effects of SNAP and housing rise, but SSI and tax credits fall. (10/n)
We see the largest changes in the SPM rate (in pp terms) for seniors, Black, Hispanic and female-headed households, and those with a disability and less than a HS diploma. (9/n)

January 29, 2025 at 3:22 PM
We see the largest changes in the SPM rate (in pp terms) for seniors, Black, Hispanic and female-headed households, and those with a disability and less than a HS diploma. (9/n)
Our post-tax income+in-kind transfer measure mirrors the resource measure used to calculate the Supplemental Poverty Measure.
Using the additional data, the SPM rate declines from the survey estimate of 12.8 percent to 10.37 percent – a decrease of 2.4pp or 8m people. (8/n)
Using the additional data, the SPM rate declines from the survey estimate of 12.8 percent to 10.37 percent – a decrease of 2.4pp or 8m people. (8/n)

January 29, 2025 at 3:22 PM
Our post-tax income+in-kind transfer measure mirrors the resource measure used to calculate the Supplemental Poverty Measure.
Using the additional data, the SPM rate declines from the survey estimate of 12.8 percent to 10.37 percent – a decrease of 2.4pp or 8m people. (8/n)
Using the additional data, the SPM rate declines from the survey estimate of 12.8 percent to 10.37 percent – a decrease of 2.4pp or 8m people. (8/n)
Split the effect by age, and we see the biggest change is among seniors, who tend to underreport other sources of retirement income. (7/n)

January 29, 2025 at 3:22 PM
Split the effect by age, and we see the biggest change is among seniors, who tend to underreport other sources of retirement income. (7/n)
We estimate three income measures: money income, post-tax income, and post-tax income+in-kind transfers (excluding health insurance).
Relative to the survey, our estimates of all three measures increase across the income distribution. (6/n)
Relative to the survey, our estimates of all three measures increase across the income distribution. (6/n)

January 29, 2025 at 3:22 PM
We estimate three income measures: money income, post-tax income, and post-tax income+in-kind transfers (excluding health insurance).
Relative to the survey, our estimates of all three measures increase across the income distribution. (6/n)
Relative to the survey, our estimates of all three measures increase across the income distribution. (6/n)
Along with the CPS ASEC (source of official income and poverty), we use 1040s, W2s, info tax returns, LEHD, ACS, census, OASDI and SSI payments, federal and state safety net data (housing assistance, SNAP, TANF, and WIC), and LBD firm data and commercial data on home values. (4/n)

January 29, 2025 at 3:22 PM
Along with the CPS ASEC (source of official income and poverty), we use 1040s, W2s, info tax returns, LEHD, ACS, census, OASDI and SSI payments, federal and state safety net data (housing assistance, SNAP, TANF, and WIC), and LBD firm data and commercial data on home values. (4/n)
*new research from NEWS project*
Using linked survey, census, admin and commercial data, we aim to produce the best estimates of income & poverty in the US.
We find disposable median hhld income is 7.1% higher and SPM poverty is 2.4pp lower than 2018 survey-based estimates. (1/n)
Using linked survey, census, admin and commercial data, we aim to produce the best estimates of income & poverty in the US.
We find disposable median hhld income is 7.1% higher and SPM poverty is 2.4pp lower than 2018 survey-based estimates. (1/n)
January 29, 2025 at 3:22 PM
*new research from NEWS project*
Using linked survey, census, admin and commercial data, we aim to produce the best estimates of income & poverty in the US.
We find disposable median hhld income is 7.1% higher and SPM poverty is 2.4pp lower than 2018 survey-based estimates. (1/n)
Using linked survey, census, admin and commercial data, we aim to produce the best estimates of income & poverty in the US.
We find disposable median hhld income is 7.1% higher and SPM poverty is 2.4pp lower than 2018 survey-based estimates. (1/n)