


Jonathan Pritchard
@jkpritch.bsky.social
My lab at Stanford studies human population genetics and complex traits.
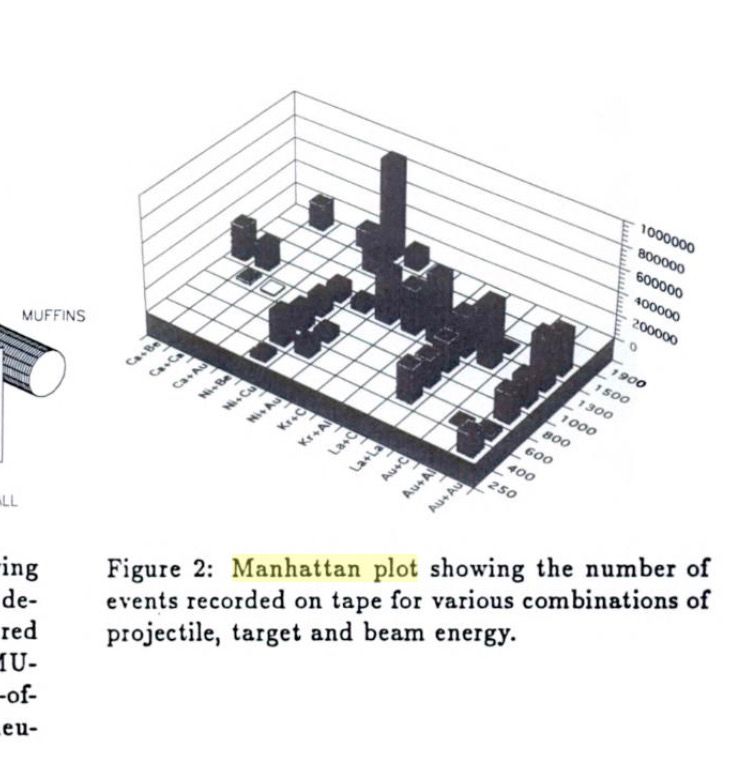
Thanks! This is amazing! So the term 'Manhattan Plot' is not originally a GWAS term at all.
Screenshotting the image here from a 1994 book on nuclear physics, for others who may be interested:
Screenshotting the image here from a 1994 book on nuclear physics, for others who may be interested:
July 29, 2025 at 6:18 PM
Thanks! This is amazing! So the term 'Manhattan Plot' is not originally a GWAS term at all.
Screenshotting the image here from a 1994 book on nuclear physics, for others who may be interested:
Screenshotting the image here from a 1994 book on nuclear physics, for others who may be interested:
Rather amusingly, ChatGPT answered this for me by hallucinating a non-existent article, allegedly published far too early and, luckily, by an author whose work I am well familiar with:

July 28, 2025 at 4:08 PM
Rather amusingly, ChatGPT answered this for me by hallucinating a non-existent article, allegedly published far too early and, luckily, by an author whose work I am well familiar with:
Thank you @sinamajidian.bsky.social
Followup, does anyone know who made the original version so that I can credit them?
Followup, does anyone know who made the original version so that I can credit them?

July 26, 2025 at 7:09 PM
Thank you @sinamajidian.bsky.social
Followup, does anyone know who made the original version so that I can credit them?
Followup, does anyone know who made the original version so that I can credit them?
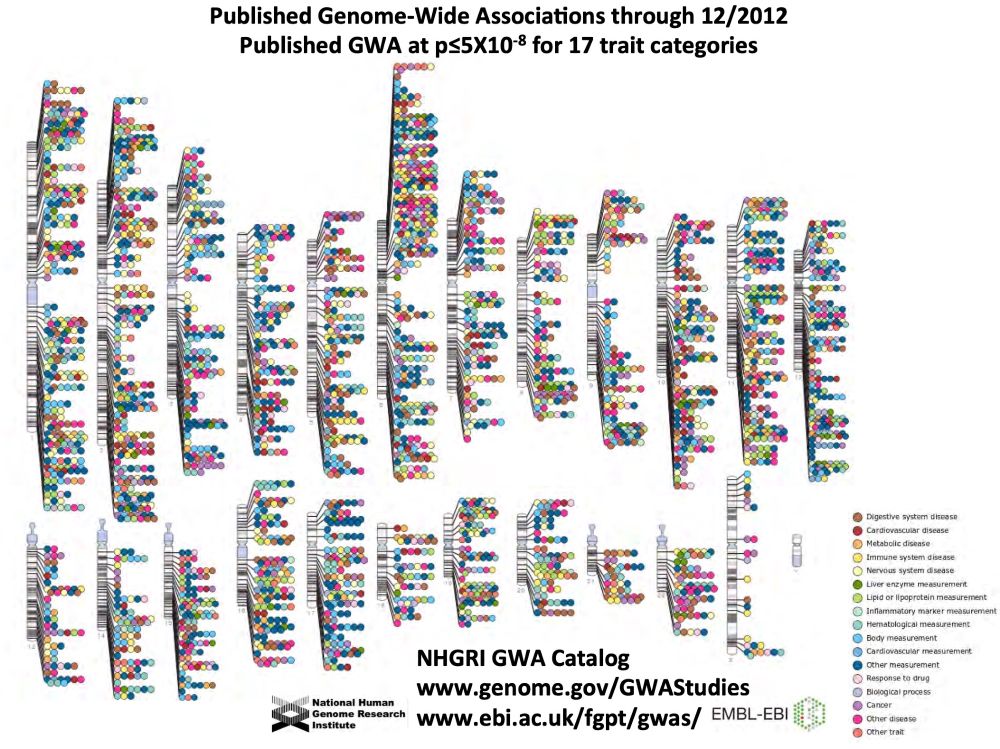
Can anyone point me to full resolution versions of these classic images from NHGRI that show the growth of GWAS from ~2006--2015? I'm looking for the timelapse versions.
(I know many of you are waiting for the GWAS chapters of my free online textbook on human genetics--they are coming, but slowly!)
(I know many of you are waiting for the GWAS chapters of my free online textbook on human genetics--they are coming, but slowly!)
July 26, 2025 at 1:45 PM
Can anyone point me to full resolution versions of these classic images from NHGRI that show the growth of GWAS from ~2006--2015? I'm looking for the timelapse versions.
(I know many of you are waiting for the GWAS chapters of my free online textbook on human genetics--they are coming, but slowly!)
(I know many of you are waiting for the GWAS chapters of my free online textbook on human genetics--they are coming, but slowly!)
Here were my thoughts on this a couple of years ago (Ch1.3/p46 of my online textbook):

May 25, 2025 at 9:09 PM
Here were my thoughts on this a couple of years ago (Ch1.3/p46 of my online textbook):
I hope to see you at ProbGen 2026 on March 25th-28th! I expect a wonderful meeting as always!

May 7, 2025 at 2:57 PM
I hope to see you at ProbGen 2026 on March 25th-28th! I expect a wonderful meeting as always!
We inferred cell cycle stage in all the Perturb-seq cells to check our model and got something curious: regulators had the expected direction of effect on the fraction of cells in each stage, but program genes didn't really change the fractions.

January 27, 2025 at 7:19 PM
We inferred cell cycle stage in all the Perturb-seq cells to check our model and got something curious: regulators had the expected direction of effect on the fraction of cells in each stage, but program genes didn't really change the fractions.
This suggests that for R_a genes, the effects via S phase and G2/M add together, while for R_b they tend to cancel.
Prediction: R_a genes should have much stronger effects on MCH than R_b genes. This is in fact correct!
Even being able to test this is a huge win for quantitative effect sizes
Prediction: R_a genes should have much stronger effects on MCH than R_b genes. This is in fact correct!
Even being able to test this is a huge win for quantitative effect sizes

January 27, 2025 at 7:19 PM
This suggests that for R_a genes, the effects via S phase and G2/M add together, while for R_b they tend to cancel.
Prediction: R_a genes should have much stronger effects on MCH than R_b genes. This is in fact correct!
Even being able to test this is a huge win for quantitative effect sizes
Prediction: R_a genes should have much stronger effects on MCH than R_b genes. This is in fact correct!
Even being able to test this is a huge win for quantitative effect sizes
Multiple regression shows us that G2/M and autophagy regulators both have repressing effects on MCH, while S phase regulators have weakly increasing effects:

January 27, 2025 at 7:19 PM
Multiple regression shows us that G2/M and autophagy regulators both have repressing effects on MCH, while S phase regulators have weakly increasing effects:
We defined two categories of regulator genes, labeled R_a and R_b, based on their effects on G2/M. They affect the three programs as shown in this simple graph:

January 27, 2025 at 7:19 PM
We defined two categories of regulator genes, labeled R_a and R_b, based on their effects on G2/M. They affect the three programs as shown in this simple graph:
Why?
We noticed that the regulator genes are largely shared across 3 critical programs: G2/M and S phase, and autophagy.
Here are the Perturb-seq effects of G2/M regulators on S and autophagy. The phases of cell cycle are oppositely regulated, and both repress autophagy.
We noticed that the regulator genes are largely shared across 3 critical programs: G2/M and S phase, and autophagy.
Here are the Perturb-seq effects of G2/M regulators on S and autophagy. The phases of cell cycle are oppositely regulated, and both repress autophagy.

January 27, 2025 at 7:19 PM
Why?
We noticed that the regulator genes are largely shared across 3 critical programs: G2/M and S phase, and autophagy.
Here are the Perturb-seq effects of G2/M regulators on S and autophagy. The phases of cell cycle are oppositely regulated, and both repress autophagy.
We noticed that the regulator genes are largely shared across 3 critical programs: G2/M and S phase, and autophagy.
Here are the Perturb-seq effects of G2/M regulators on S and autophagy. The phases of cell cycle are oppositely regulated, and both repress autophagy.
but for some, the directions were puzzling.
For example, for S phase the program genes repress MCH, but the regulators activate MCH. How could we explain this?
[Remember, we wouldn't have noticed this without the directional information implicit in LoFs!]
For example, for S phase the program genes repress MCH, but the regulators activate MCH. How could we explain this?
[Remember, we wouldn't have noticed this without the directional information implicit in LoFs!]

January 27, 2025 at 7:19 PM
but for some, the directions were puzzling.
For example, for S phase the program genes repress MCH, but the regulators activate MCH. How could we explain this?
[Remember, we wouldn't have noticed this without the directional information implicit in LoFs!]
For example, for S phase the program genes repress MCH, but the regulators activate MCH. How could we explain this?
[Remember, we wouldn't have noticed this without the directional information implicit in LoFs!]
We were happy to get a bunch of significant signals in programs that make biological sense...

January 27, 2025 at 7:19 PM
We were happy to get a bunch of significant signals in programs that make biological sense...
We next decomposed the Perturb-seq data into transcriptional programs of coexpressed genes, usually functionally coherent.
For each program we asked if the Program or the Regulators show a significant DIRECTIONAL effect on each trait.
For each program we asked if the Program or the Regulators show a significant DIRECTIONAL effect on each trait.

January 27, 2025 at 7:19 PM
We next decomposed the Perturb-seq data into transcriptional programs of coexpressed genes, usually functionally coherent.
For each program we asked if the Program or the Regulators show a significant DIRECTIONAL effect on each trait.
For each program we asked if the Program or the Regulators show a significant DIRECTIONAL effect on each trait.
The directional information was particularly useful when we wanted to understand how gene effects flow through cellular regulatory networks (using Perturb-seq data).
As expected, positive regulators of HBA1 (knockdown reduces expression) are also positive regulators of MCH (LoFs lower MCH)
As expected, positive regulators of HBA1 (knockdown reduces expression) are also positive regulators of MCH (LoFs lower MCH)

January 27, 2025 at 7:19 PM
The directional information was particularly useful when we wanted to understand how gene effects flow through cellular regulatory networks (using Perturb-seq data).
As expected, positive regulators of HBA1 (knockdown reduces expression) are also positive regulators of MCH (LoFs lower MCH)
As expected, positive regulators of HBA1 (knockdown reduces expression) are also positive regulators of MCH (LoFs lower MCH)
LoF burden tests give us quantitative directional information about how 50% expression relates to phenotype.
eg here's a volcano plot of LoF tests for hemoglobin (MCH) in UKB. As you would expect the biggest negative hits include hemoglobin components: HBB, HBA1, HBA2.
eg here's a volcano plot of LoF tests for hemoglobin (MCH) in UKB. As you would expect the biggest negative hits include hemoglobin components: HBB, HBA1, HBA2.

January 27, 2025 at 7:19 PM
LoF burden tests give us quantitative directional information about how 50% expression relates to phenotype.
eg here's a volcano plot of LoF tests for hemoglobin (MCH) in UKB. As you would expect the biggest negative hits include hemoglobin components: HBB, HBA1, HBA2.
eg here's a volcano plot of LoF tests for hemoglobin (MCH) in UKB. As you would expect the biggest negative hits include hemoglobin components: HBB, HBA1, HBA2.
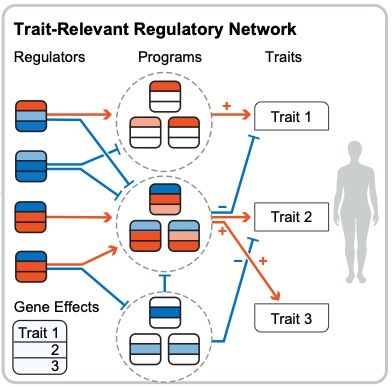
We can also build graphs for multiple traits. This is the subway map view of these traits (or 'tube map' in my native British). This links regulator effects to traits:

January 26, 2025 at 12:13 AM
We can also build graphs for multiple traits. This is the subway map view of these traits (or 'tube map' in my native British). This links regulator effects to traits:
We're now ready to build graphs that connect genes, regulators, programs, and traits. Here's the graph for hemoglobin (MCH), with p-value comparing against null by 2 analyses:

January 26, 2025 at 12:13 AM
We're now ready to build graphs that connect genes, regulators, programs, and traits. Here's the graph for hemoglobin (MCH), with p-value comparing against null by 2 analyses:
So to recap, for each trait, we can estimate directional relationships between LoF effects on the trait and activity of transcriptional programs and/or direction effects of regulators.
This highlights programs including hemoglobin synthesis, cell cycle, autophagy, and progenitor maintenance.
This highlights programs including hemoglobin synthesis, cell cycle, autophagy, and progenitor maintenance.

January 26, 2025 at 12:13 AM
So to recap, for each trait, we can estimate directional relationships between LoF effects on the trait and activity of transcriptional programs and/or direction effects of regulators.
This highlights programs including hemoglobin synthesis, cell cycle, autophagy, and progenitor maintenance.
This highlights programs including hemoglobin synthesis, cell cycle, autophagy, and progenitor maintenance.
Now we want to learn new biology. It's too hard to learn full networks from Perturb-seq; instead we follow key work from Jesse Engreitz's lab using NMF to identify transcriptional programs for this.
Next we test for DIRECTIONAL relationships between LoF gene effects and regulators and programs.
Next we test for DIRECTIONAL relationships between LoF gene effects and regulators and programs.

January 26, 2025 at 12:13 AM
Now we want to learn new biology. It's too hard to learn full networks from Perturb-seq; instead we follow key work from Jesse Engreitz's lab using NMF to identify transcriptional programs for this.
Next we test for DIRECTIONAL relationships between LoF gene effects and regulators and programs.
Next we test for DIRECTIONAL relationships between LoF gene effects and regulators and programs.
One critical finding is that we get much clearer results using LoF burden stats than we do from GWAS hits.
LoFs help for 2 reasons: they give us stronger enrichment in regulators, and they are inherently DIRECTIONAL, information we use later.
LoFs help for 2 reasons: they give us stronger enrichment in regulators, and they are inherently DIRECTIONAL, information we use later.

January 26, 2025 at 12:13 AM
One critical finding is that we get much clearer results using LoF burden stats than we do from GWAS hits.
LoFs help for 2 reasons: they give us stronger enrichment in regulators, and they are inherently DIRECTIONAL, information we use later.
LoFs help for 2 reasons: they give us stronger enrichment in regulators, and they are inherently DIRECTIONAL, information we use later.
Here we have a simple prediction. If a gene is a positive regulator of HBA1 in Perturb-seq, it should be a positive regulator of MCH in UK Biobank data (and the opposite for negative regs).
Using directional information from LoF data we see a strong signal that this is true. Game on!
Using directional information from LoF data we see a strong signal that this is true. Game on!

January 26, 2025 at 12:13 AM
Here we have a simple prediction. If a gene is a positive regulator of HBA1 in Perturb-seq, it should be a positive regulator of MCH in UK Biobank data (and the opposite for negative regs).
Using directional information from LoF data we see a strong signal that this is true. Game on!
Using directional information from LoF data we see a strong signal that this is true. Game on!
Standard analysis with GWAS and Loss-of-Function (LoF) burden tests implicated pathways including heme metabolism, hematopoiesis, cell cycle and autophagy.
But this is still a very limited picture. eg, WHICH aspects of cell cycle matter? WHY? And does c.c. increase or decrease MCH?
But this is still a very limited picture. eg, WHICH aspects of cell cycle matter? WHY? And does c.c. increase or decrease MCH?


January 26, 2025 at 12:13 AM
Standard analysis with GWAS and Loss-of-Function (LoF) burden tests implicated pathways including heme metabolism, hematopoiesis, cell cycle and autophagy.
But this is still a very limited picture. eg, WHICH aspects of cell cycle matter? WHY? And does c.c. increase or decrease MCH?
But this is still a very limited picture. eg, WHICH aspects of cell cycle matter? WHY? And does c.c. increase or decrease MCH?
This is something that Alex Marson and I have been working toward for ~8 years. A brilliant postdoc with us, @minetoota.bsky.social, decided to build a proof of principle by using the only current genome-scale Perturb-seq, in K562 cells, to model red blood cell phenotypes such as hemoglobin (MCH)

January 26, 2025 at 12:13 AM
This is something that Alex Marson and I have been working toward for ~8 years. A brilliant postdoc with us, @minetoota.bsky.social, decided to build a proof of principle by using the only current genome-scale Perturb-seq, in K562 cells, to model red blood cell phenotypes such as hemoglobin (MCH)
Modern GWAS can identify 1000s of significant hits but it can be hard to turn this into biological insight. What key cellular functions link genetic variation to disease?
I'm very excited to present our new work combining associations and Perturb-seq to build interpretable causal graphs! A 🧵
I'm very excited to present our new work combining associations and Perturb-seq to build interpretable causal graphs! A 🧵
January 26, 2025 at 12:13 AM
Modern GWAS can identify 1000s of significant hits but it can be hard to turn this into biological insight. What key cellular functions link genetic variation to disease?
I'm very excited to present our new work combining associations and Perturb-seq to build interpretable causal graphs! A 🧵
I'm very excited to present our new work combining associations and Perturb-seq to build interpretable causal graphs! A 🧵