


Jesse Onland
@jdonland.bsky.social
dataviz and statistics | https://jdonland.github.io | views are my own
Embarrassing. Why not just train a slop generator on all the conference submissions and then skip actually running it?

July 17, 2025 at 5:29 PM
Embarrassing. Why not just train a slop generator on all the conference submissions and then skip actually running it?
Vertical axis trickery in Bigalke et al. (2021), via dynomight.net/blue-light/. 📊

July 4, 2025 at 12:51 PM
Vertical axis trickery in Bigalke et al. (2021), via dynomight.net/blue-light/. 📊


Andrew Gelman uses this example in a post about counteracting perceptual distortion in dataviz 📊. It compromises on ease of comparisons to maintain a visual metaphor.
I want to see how a 100% stacked bar graph would look, but sadly getting the chart data from the code isn't straightforward.
I want to see how a 100% stacked bar graph would look, but sadly getting the chart data from the code isn't straightforward.
May 31, 2025 at 12:09 AM
Andrew Gelman uses this example in a post about counteracting perceptual distortion in dataviz 📊. It compromises on ease of comparisons to maintain a visual metaphor.
I want to see how a 100% stacked bar graph would look, but sadly getting the chart data from the code isn't straightforward.
I want to see how a 100% stacked bar graph would look, but sadly getting the chart data from the code isn't straightforward.
"Stratification in Late Traditional Chinese Society" by G. William Skinner and Paul D. Barclay 📊

May 10, 2025 at 1:02 AM
"Stratification in Late Traditional Chinese Society" by G. William Skinner and Paul D. Barclay 📊
Better to use a different height-scaled geom for the total, like a dashed line.

May 9, 2025 at 7:28 PM
Better to use a different height-scaled geom for the total, like a dashed line.
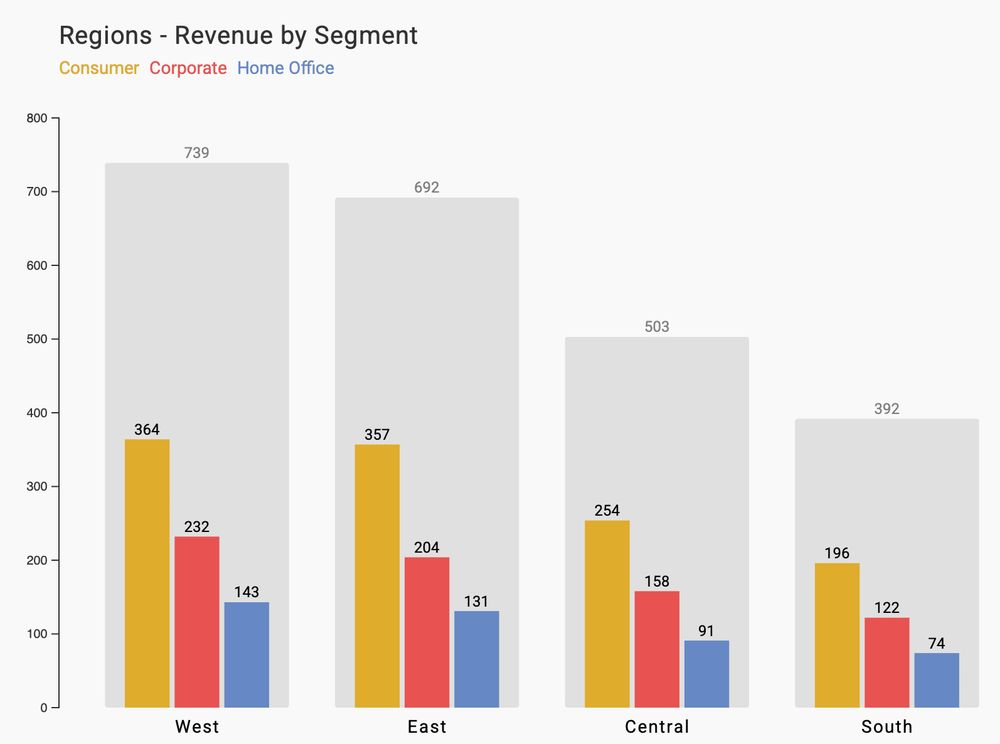
@brrosenau.bsky.social's alternative to the stacked bar chart (example courtesy of @yan-holtz.bsky.social) makes all bar heights easy to compare, but creates a much worse problem: the height and area scales are now out of sync, fundamentally violating the visual logic of a bar chart. 📊
May 9, 2025 at 7:25 PM
@brrosenau.bsky.social's alternative to the stacked bar chart (example courtesy of @yan-holtz.bsky.social) makes all bar heights easy to compare, but creates a much worse problem: the height and area scales are now out of sync, fundamentally violating the visual logic of a bar chart. 📊
Ternary bubble plot of urban transportation modal share in Europe vs North America. citiesmoving.com/visualizatio... 📊

April 27, 2025 at 1:33 AM
Ternary bubble plot of urban transportation modal share in Europe vs North America. citiesmoving.com/visualizatio... 📊

April 26, 2025 at 1:44 AM
If you want to dunk on Tufte, go after his quartile plot. May he never live it down.

April 23, 2025 at 11:51 PM
If you want to dunk on Tufte, go after his quartile plot. May he never live it down.

Is there a name for the data visualization error in which an "identity" scale, e.g. colour encoded with colour or angle with angle, uses a mapping other than identity? "Encoding clash", maybe? "Stroop encoding"? 📊

April 19, 2025 at 7:53 PM
Is there a name for the data visualization error in which an "identity" scale, e.g. colour encoded with colour or angle with angle, uses a mapping other than identity? "Encoding clash", maybe? "Stroop encoding"? 📊
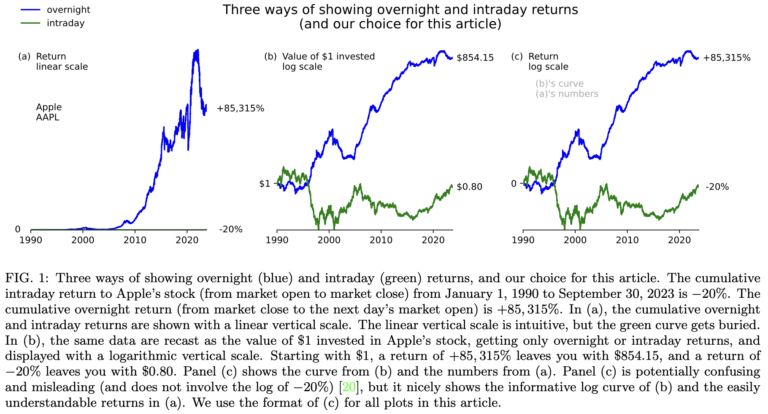
Discussion of how best to plot overnight vs intraday stock returns from "Nothing to See Here: How to Say It When You Need to" (Knuteson, 2023), via statmodeling.stat.columbia.edu/2025/04/19/f... 📊
April 19, 2025 at 6:33 PM
Discussion of how best to plot overnight vs intraday stock returns from "Nothing to See Here: How to Say It When You Need to" (Knuteson, 2023), via statmodeling.stat.columbia.edu/2025/04/19/f... 📊
A truly great 📊 figure caption, found in Lucas Kovar's "Electron Band Structure In Germanium, My Ass".

April 1, 2025 at 5:57 PM
A truly great 📊 figure caption, found in Lucas Kovar's "Electron Band Structure In Germanium, My Ass".
I cannot recommend Modern CSV enough. It's a fast, fully featured, easy to use, actively developed, buy-once CSV editor for Windows, MacOS, and Linux.
It's a big component of my workflow alongside Positron.
www.moderncsv.com
It's a big component of my workflow alongside Positron.
www.moderncsv.com

January 28, 2025 at 5:16 PM
I cannot recommend Modern CSV enough. It's a fast, fully featured, easy to use, actively developed, buy-once CSV editor for Windows, MacOS, and Linux.
It's a big component of my workflow alongside Positron.
www.moderncsv.com
It's a big component of my workflow alongside Positron.
www.moderncsv.com
timeanddate.com's approach to this type of graphic really highlights the effect of daylight savings time.

December 21, 2024 at 8:41 PM
timeanddate.com's approach to this type of graphic really highlights the effect of daylight savings time.
Who's going to decide how they'd personally weight the relative values of bronze, silver, and gold medal on double-log scale?
A clever #dataviz that presents information its audience doesn't care about in a way they can't understand is useless.
A clever #dataviz that presents information its audience doesn't care about in a way they can't understand is useless.
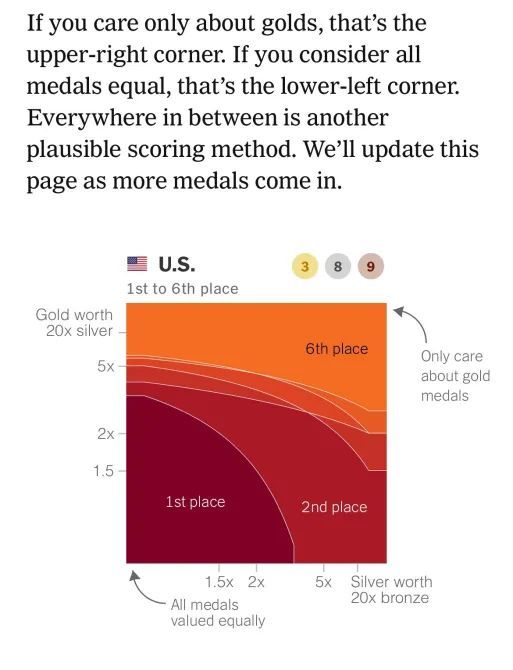
November 23, 2024 at 8:51 PM
Who's going to decide how they'd personally weight the relative values of bronze, silver, and gold medal on double-log scale?
A clever #dataviz that presents information its audience doesn't care about in a way they can't understand is useless.
A clever #dataviz that presents information its audience doesn't care about in a way they can't understand is useless.
Rates of growth expressed on different time scales are a nice use-case for secondary axes. (I can't compute twelfth roots in my head.) #econometrics #dataviz

November 23, 2024 at 8:43 PM
Rates of growth expressed on different time scales are a nice use-case for secondary axes. (I can't compute twelfth roots in my head.) #econometrics #dataviz

My attempt at this week's Du Bois Visualization Challenge.
I would have liked to recreate the hand-painted texture of fills and the ragged left edge, but I didn't see a way to do it in a purely programmatic way.
#datavisualization #duboischallenge #ggplot2
I would have liked to recreate the hand-painted texture of fills and the ragged left edge, but I didn't see a way to do it in a purely programmatic way.
#datavisualization #duboischallenge #ggplot2


February 19, 2024 at 6:18 PM
My attempt at this week's Du Bois Visualization Challenge.
I would have liked to recreate the hand-painted texture of fills and the ragged left edge, but I didn't see a way to do it in a purely programmatic way.
#datavisualization #duboischallenge #ggplot2
I would have liked to recreate the hand-painted texture of fills and the ragged left edge, but I didn't see a way to do it in a purely programmatic way.
#datavisualization #duboischallenge #ggplot2