


Jan Broder Engler
@jbengler.de
Scientist and software developer. Creator of tidyplots.org. Website jbengler.de.

November 27, 2025 at 5:27 PM

November 26, 2025 at 4:42 PM
Thank you for citing #tidyplots 🙏
Steven E. Pilley et al. A metabolic atlas of mouse aging. Cell Metabolism (2025).
doi.org/10.1016/j.cm...
#rstats #dataviz #phd
Steven E. Pilley et al. A metabolic atlas of mouse aging. Cell Metabolism (2025).
doi.org/10.1016/j.cm...
#rstats #dataviz #phd

November 26, 2025 at 1:42 PM
Thank you for citing #tidyplots 🙏
Steven E. Pilley et al. A metabolic atlas of mouse aging. Cell Metabolism (2025).
doi.org/10.1016/j.cm...
#rstats #dataviz #phd
Steven E. Pilley et al. A metabolic atlas of mouse aging. Cell Metabolism (2025).
doi.org/10.1016/j.cm...
#rstats #dataviz #phd
This is how you can visualize gene expression data in #tidyheatmaps 🤩
jbengler.github.io/tidyheatmaps/
#rstats #dataviz #phd
jbengler.github.io/tidyheatmaps/
#rstats #dataviz #phd

November 21, 2025 at 5:16 PM
This is how you can visualize gene expression data in #tidyheatmaps 🤩
jbengler.github.io/tidyheatmaps/
#rstats #dataviz #phd
jbengler.github.io/tidyheatmaps/
#rstats #dataviz #phd
November 20, 2025 at 5:25 PM

November 19, 2025 at 2:49 PM

November 18, 2025 at 7:45 PM

November 17, 2025 at 6:17 PM

November 14, 2025 at 5:11 PM

November 13, 2025 at 11:12 PM
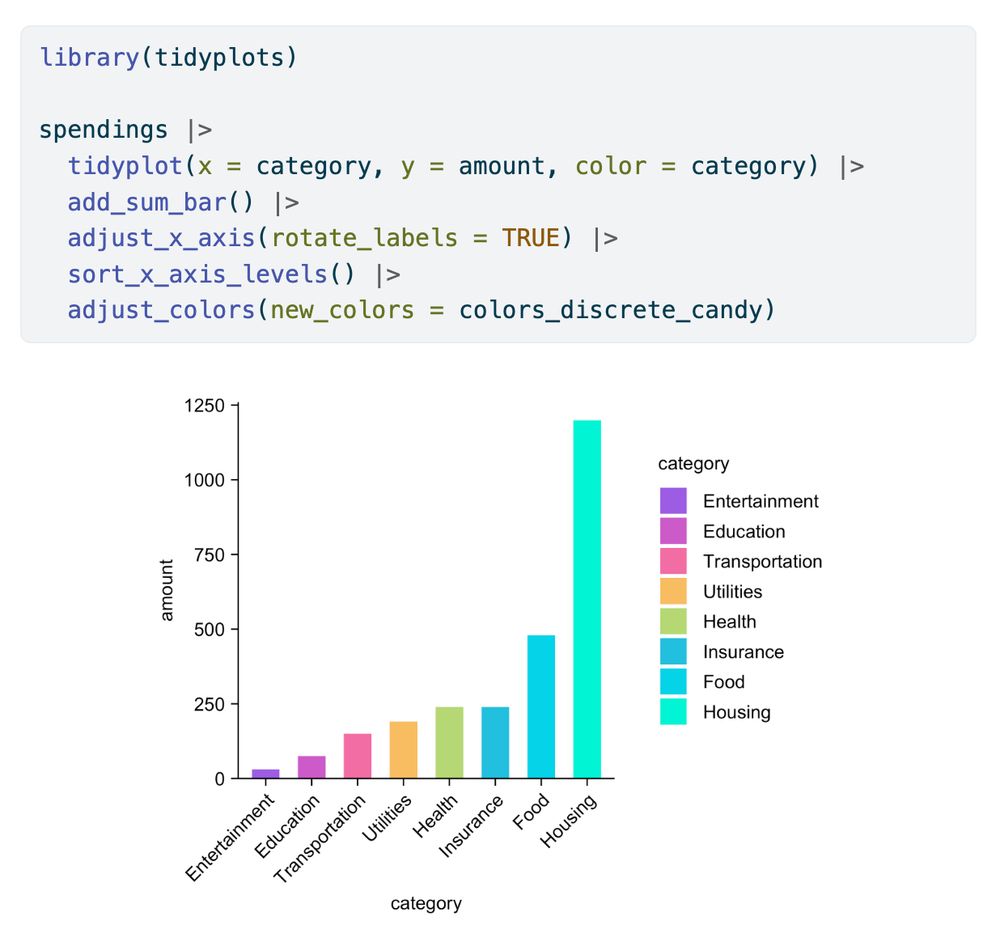
In its first year tidyplots.org has become the go-to data viz for many life science researchers, got 620+ stars on Github, ~30K CRAN downloads, and 11 citations. Thank you for using, sharing, citing, and feedback! There is more to come 🤩
#rstats #dataviz #phd
#rstats #dataviz #phd
November 8, 2025 at 9:24 AM
In its first year tidyplots.org has become the go-to data viz for many life science researchers, got 620+ stars on Github, ~30K CRAN downloads, and 11 citations. Thank you for using, sharing, citing, and feedback! There is more to come 🤩
#rstats #dataviz #phd
#rstats #dataviz #phd

October 21, 2025 at 4:11 PM

October 16, 2025 at 4:45 PM
October 14, 2025 at 3:58 PM

October 10, 2025 at 4:24 PM

October 10, 2025 at 4:21 PM
This is how you can set a default style in #tidyplots 🎨
jbengler.github.io/tidyplots/re...
#rstats #dataviz #phd
jbengler.github.io/tidyplots/re...
#rstats #dataviz #phd

October 9, 2025 at 3:48 PM
This is how you can set a default style in #tidyplots 🎨
jbengler.github.io/tidyplots/re...
#rstats #dataviz #phd
jbengler.github.io/tidyplots/re...
#rstats #dataviz #phd

October 7, 2025 at 2:37 PM
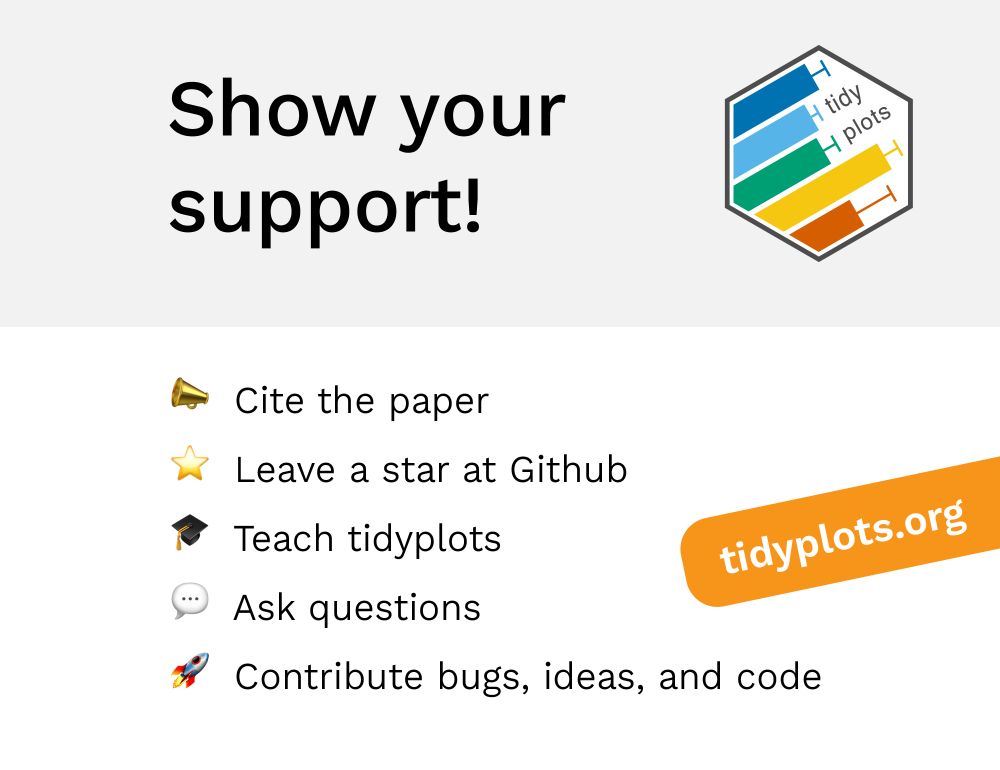
Being free and open-source, this is how you can support #tidyplots ❤️
tidyplots.org
github.com/jbengler/tid...
#rstats #dataviz #phd
tidyplots.org
github.com/jbengler/tid...
#rstats #dataviz #phd
October 7, 2025 at 2:34 PM
Being free and open-source, this is how you can support #tidyplots ❤️
tidyplots.org
github.com/jbengler/tid...
#rstats #dataviz #phd
tidyplots.org
github.com/jbengler/tid...
#rstats #dataviz #phd

October 6, 2025 at 6:12 PM

October 3, 2025 at 6:22 PM

October 2, 2025 at 6:54 PM
This is how you can adjust the plot size in #tidyplots 🔥
All measures are in mm.
#rstats #dataviz #phd
All measures are in mm.
#rstats #dataviz #phd

October 1, 2025 at 4:05 PM
This is how you can adjust the plot size in #tidyplots 🔥
All measures are in mm.
#rstats #dataviz #phd
All measures are in mm.
#rstats #dataviz #phd

September 30, 2025 at 3:49 PM

September 29, 2025 at 5:34 PM