


Manuel Hald
@hamanuha.dev
💼 Developing automotive parts at day
❤️🔥 Building apps at night
👨🍼 Proud dad
💰 https://fibunu.com - Stay on top of your finances
❤️🔥 Building apps at night
👨🍼 Proud dad
💰 https://fibunu.com - Stay on top of your finances
Working on two new pages for the Fibunu website 👀

February 18, 2025 at 7:41 PM
Working on two new pages for the Fibunu website 👀
Fixed a tricky bug for calculating the average daily cumulative expenses - took hours 😫
February 15, 2025 at 8:15 PM
Fixed a tricky bug for calculating the average daily cumulative expenses - took hours 😫
Trying to get the loading state right.
What's your preferred way?
1️⃣ Show one spinner/skeleton until whole page is loaded
2️⃣ Use a spinner/skeleton for each component and show data as soon as available
#buildinpublic
What's your preferred way?
1️⃣ Show one spinner/skeleton until whole page is loaded
2️⃣ Use a spinner/skeleton for each component and show data as soon as available
#buildinpublic
February 9, 2025 at 7:02 PM
Trying to get the loading state right.
What's your preferred way?
1️⃣ Show one spinner/skeleton until whole page is loaded
2️⃣ Use a spinner/skeleton for each component and show data as soon as available
#buildinpublic
What's your preferred way?
1️⃣ Show one spinner/skeleton until whole page is loaded
2️⃣ Use a spinner/skeleton for each component and show data as soon as available
#buildinpublic
Today I tried to restore the database from my backup. Just to make sure everything works.
Check your backup strategy and test the restore process as well.
Check your backup strategy and test the restore process as well.
February 8, 2025 at 5:25 PM
Today I tried to restore the database from my backup. Just to make sure everything works.
Check your backup strategy and test the restore process as well.
Check your backup strategy and test the restore process as well.
Plausible needs a feature to edit/delete single entries.
February 6, 2025 at 12:54 PM
Plausible needs a feature to edit/delete single entries.
Weekly Goal of last week:
Release the new analysis layout and add the extended balance chart. ✅
(Instead of the extended balance chart I added the profit/loss heatmap)
Weekly Goal #6
Add features overview to website.
Release the new analysis layout and add the extended balance chart. ✅
(Instead of the extended balance chart I added the profit/loss heatmap)
Weekly Goal #6
Add features overview to website.
February 3, 2025 at 4:39 PM
Weekly Goal of last week:
Release the new analysis layout and add the extended balance chart. ✅
(Instead of the extended balance chart I added the profit/loss heatmap)
Weekly Goal #6
Add features overview to website.
Release the new analysis layout and add the extended balance chart. ✅
(Instead of the extended balance chart I added the profit/loss heatmap)
Weekly Goal #6
Add features overview to website.
Yesterday, I broke my streak of working on my side hustle and sharing updates - something I’d been consistently doing since November.
The reason? A dumb accident that nearly cost me my left thumb. After a day in the ER and a small OP I have now a splint for the next 2-4 weeks.
The reason? A dumb accident that nearly cost me my left thumb. After a day in the ER and a small OP I have now a splint for the next 2-4 weeks.


February 2, 2025 at 11:24 AM
Yesterday, I broke my streak of working on my side hustle and sharing updates - something I’d been consistently doing since November.
The reason? A dumb accident that nearly cost me my left thumb. After a day in the ER and a small OP I have now a splint for the next 2-4 weeks.
The reason? A dumb accident that nearly cost me my left thumb. After a day in the ER and a small OP I have now a splint for the next 2-4 weeks.
Keep the blocks green!
Started with the heatmap of profit/loss chart 👀
Started with the heatmap of profit/loss chart 👀

January 31, 2025 at 7:15 PM
Keep the blocks green!
Started with the heatmap of profit/loss chart 👀
Started with the heatmap of profit/loss chart 👀
January 30, 2025 at 6:45 PM
The base for the new analysis page is done.
Which chart should I add next?
1️⃣ Balance chart (total, by accounts, filters)
2️⃣ Heatmap of monthly profit/loss
3️⃣ Category allocation over time
Which chart should I add next?
1️⃣ Balance chart (total, by accounts, filters)
2️⃣ Heatmap of monthly profit/loss
3️⃣ Category allocation over time
January 29, 2025 at 7:07 PM
The base for the new analysis page is done.
Which chart should I add next?
1️⃣ Balance chart (total, by accounts, filters)
2️⃣ Heatmap of monthly profit/loss
3️⃣ Category allocation over time
Which chart should I add next?
1️⃣ Balance chart (total, by accounts, filters)
2️⃣ Heatmap of monthly profit/loss
3️⃣ Category allocation over time

Weekly Goal of last week:
Save client settings like selected time period and selected chart options.❌
I want to finish the new analysis layout first.
Weekly Goal #5
Release the new analysis layout and add the extended balance chart.
Save client settings like selected time period and selected chart options.❌
I want to finish the new analysis layout first.
Weekly Goal #5
Release the new analysis layout and add the extended balance chart.
January 27, 2025 at 7:11 PM
Weekly Goal of last week:
Save client settings like selected time period and selected chart options.❌
I want to finish the new analysis layout first.
Weekly Goal #5
Release the new analysis layout and add the extended balance chart.
Save client settings like selected time period and selected chart options.❌
I want to finish the new analysis layout first.
Weekly Goal #5
Release the new analysis layout and add the extended balance chart.

January 26, 2025 at 7:23 PM
Keep going, especially when it’s hard!
January 25, 2025 at 6:45 PM
Keep going, especially when it’s hard!
Improved the already existing result history chart a little bit for the new analysis page.

January 24, 2025 at 4:35 PM
Improved the already existing result history chart a little bit for the new analysis page.
No updates from me today.
My little one is sick, the nights are bad and my wife‘s energy it empty.
My little one is sick, the nights are bad and my wife‘s energy it empty.
January 23, 2025 at 4:13 PM
No updates from me today.
My little one is sick, the nights are bad and my wife‘s energy it empty.
My little one is sick, the nights are bad and my wife‘s energy it empty.
Was würdet ihr unter diesen Unterpunkten auf der Analyse-Seite für Auswertungen/Diagramme erwarten?

January 22, 2025 at 7:12 PM
Was würdet ihr unter diesen Unterpunkten auf der Analyse-Seite für Auswertungen/Diagramme erwarten?
Every crypto wallet is a scam!?
At least according to the reviews. Really difficult to filter out which are really scams and where the user is responsible for the loss.
Any wallets (hot/cold) you can recommend?
At least according to the reviews. Really difficult to filter out which are really scams and where the user is responsible for the loss.
Any wallets (hot/cold) you can recommend?
January 21, 2025 at 6:08 PM
Every crypto wallet is a scam!?
At least according to the reviews. Really difficult to filter out which are really scams and where the user is responsible for the loss.
Any wallets (hot/cold) you can recommend?
At least according to the reviews. Really difficult to filter out which are really scams and where the user is responsible for the loss.
Any wallets (hot/cold) you can recommend?
Weekly Goal of last week:
Release the revamped dashboard ✅
Weekly Goal #4
Save client settings like selected time period and selected chart options.
Release the revamped dashboard ✅
Weekly Goal #4
Save client settings like selected time period and selected chart options.
January 20, 2025 at 7:15 PM
Weekly Goal of last week:
Release the revamped dashboard ✅
Weekly Goal #4
Save client settings like selected time period and selected chart options.
Release the revamped dashboard ✅
Weekly Goal #4
Save client settings like selected time period and selected chart options.
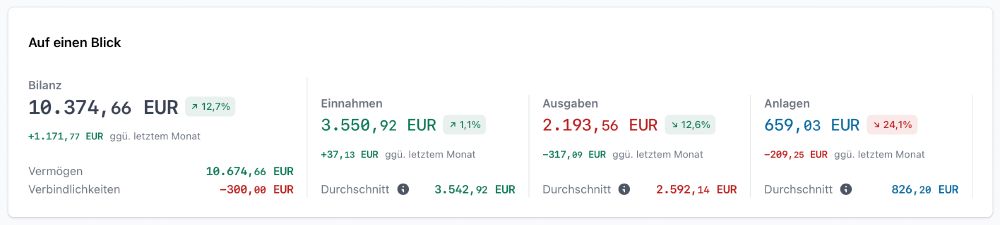
Added some more information to the workspace overview:
- Assets
- Liabilities
- Absolute change compared to previous month
- 12-months average for income, expenses and savings
It feels a little bit overwhelming with all these number and colors. Any idea how to solve that?
#buildinpublic
- Assets
- Liabilities
- Absolute change compared to previous month
- 12-months average for income, expenses and savings
It feels a little bit overwhelming with all these number and colors. Any idea how to solve that?
#buildinpublic
January 19, 2025 at 12:19 PM
Added some more information to the workspace overview:
- Assets
- Liabilities
- Absolute change compared to previous month
- 12-months average for income, expenses and savings
It feels a little bit overwhelming with all these number and colors. Any idea how to solve that?
#buildinpublic
- Assets
- Liabilities
- Absolute change compared to previous month
- 12-months average for income, expenses and savings
It feels a little bit overwhelming with all these number and colors. Any idea how to solve that?
#buildinpublic
Do you know that?
You have a long workday and you are looking forward to work on your side hustle in the evening. Then when the kids are asleep and you finally have your spare time your energy and motivation is gone. You sit in front of your Laptop and don’t know what to do.
You have a long workday and you are looking forward to work on your side hustle in the evening. Then when the kids are asleep and you finally have your spare time your energy and motivation is gone. You sit in front of your Laptop and don’t know what to do.
January 18, 2025 at 1:31 PM
Do you know that?
You have a long workday and you are looking forward to work on your side hustle in the evening. Then when the kids are asleep and you finally have your spare time your energy and motivation is gone. You sit in front of your Laptop and don’t know what to do.
You have a long workday and you are looking forward to work on your side hustle in the evening. Then when the kids are asleep and you finally have your spare time your energy and motivation is gone. You sit in front of your Laptop and don’t know what to do.
I've made several enhancements for this week's release:
The tooltip now always remains on top of the chart, eliminating the "jitter" caused by it sticking to the line.
On hover, a vertical line is shown and points are highlighted to better visualize the data currently hovered.
#buildinpublic
The tooltip now always remains on top of the chart, eliminating the "jitter" caused by it sticking to the line.
On hover, a vertical line is shown and points are highlighted to better visualize the data currently hovered.
#buildinpublic

January 17, 2025 at 4:01 PM
I've made several enhancements for this week's release:
The tooltip now always remains on top of the chart, eliminating the "jitter" caused by it sticking to the line.
On hover, a vertical line is shown and points are highlighted to better visualize the data currently hovered.
#buildinpublic
The tooltip now always remains on top of the chart, eliminating the "jitter" caused by it sticking to the line.
On hover, a vertical line is shown and points are highlighted to better visualize the data currently hovered.
#buildinpublic
I think this came out quite nicely 🤩

January 16, 2025 at 11:51 AM
I think this came out quite nicely 🤩
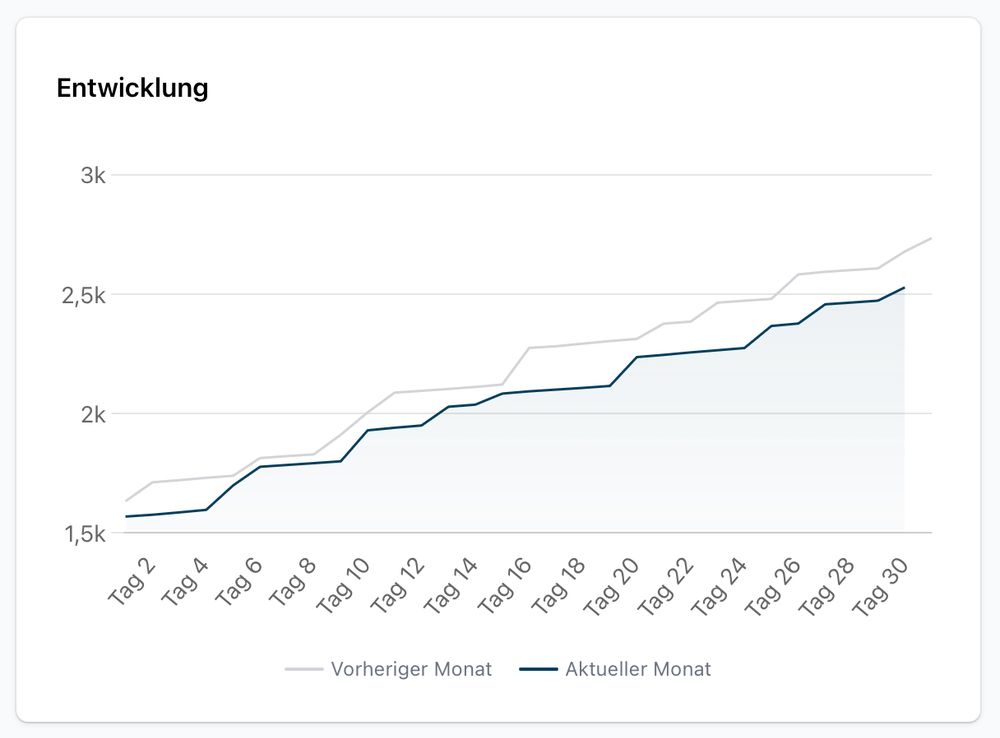
A or B?
Chart compares spending of current month to last month.
I have another chart aside to this chart (last image).
#buildinpublic
Chart compares spending of current month to last month.
I have another chart aside to this chart (last image).
#buildinpublic


January 15, 2025 at 7:27 PM
A or B?
Chart compares spending of current month to last month.
I have another chart aside to this chart (last image).
#buildinpublic
Chart compares spending of current month to last month.
I have another chart aside to this chart (last image).
#buildinpublic
A bit late, but I forgot to post this on Monday.
Weekly Goal of last week:
Finish and publish pseo article ✅
Weekly Goal #3
Release the revamped dashboard 📊
Weekly Goal of last week:
Finish and publish pseo article ✅
Weekly Goal #3
Release the revamped dashboard 📊
January 15, 2025 at 1:36 PM
A bit late, but I forgot to post this on Monday.
Weekly Goal of last week:
Finish and publish pseo article ✅
Weekly Goal #3
Release the revamped dashboard 📊
Weekly Goal of last week:
Finish and publish pseo article ✅
Weekly Goal #3
Release the revamped dashboard 📊