


Grafana
@grafana.bsky.social
🥉 Grafana Labs is a top 3 contributor to #OpenTelemetry, so of course we have a webinar to help your teams get started with OTel & #Grafana.
Join us on Nov 26 at 14:00 CET to learn:
🔸 Why it's important + the common adoption challenges
🔸 Basic OTel automatic & manual instrumentation + more
Join us on Nov 26 at 14:00 CET to learn:
🔸 Why it's important + the common adoption challenges
🔸 Basic OTel automatic & manual instrumentation + more

How to get started with OpenTelemetry and Grafana | Grafana Labs
This webinar covers the essentials of instrumentation and demonstrates how to visualize OpenTelemetry data seamlessly within Grafana and Grafana Cloud.
grafana.com
November 11, 2025 at 9:00 AM
🥉 Grafana Labs is a top 3 contributor to #OpenTelemetry, so of course we have a webinar to help your teams get started with OTel & #Grafana.
Join us on Nov 26 at 14:00 CET to learn:
🔸 Why it's important + the common adoption challenges
🔸 Basic OTel automatic & manual instrumentation + more
Join us on Nov 26 at 14:00 CET to learn:
🔸 Why it's important + the common adoption challenges
🔸 Basic OTel automatic & manual instrumentation + more
☁️ AWS here, Azure there, GCP somewhere else?
Get a unified view, without moving your data.
Join us for a webinar on Nov. 19 to learn how to simplify cloud monitoring with Grafana Cloud and OpenTelemetry.
Sign up: https://grafana.com/go/webinar/cloud-infrastructure-monitoring-with-grafana-cloud
Get a unified view, without moving your data.
Join us for a webinar on Nov. 19 to learn how to simplify cloud monitoring with Grafana Cloud and OpenTelemetry.
Sign up: https://grafana.com/go/webinar/cloud-infrastructure-monitoring-with-grafana-cloud

November 11, 2025 at 12:00 AM
☁️ AWS here, Azure there, GCP somewhere else?
Get a unified view, without moving your data.
Join us for a webinar on Nov. 19 to learn how to simplify cloud monitoring with Grafana Cloud and OpenTelemetry.
Sign up: https://grafana.com/go/webinar/cloud-infrastructure-monitoring-with-grafana-cloud
Get a unified view, without moving your data.
Join us for a webinar on Nov. 19 to learn how to simplify cloud monitoring with Grafana Cloud and OpenTelemetry.
Sign up: https://grafana.com/go/webinar/cloud-infrastructure-monitoring-with-grafana-cloud
"[With Grafana Cloud], we’re getting maximum value per dollar and we’re spending on a platform where the skills the team is developing are useful to engineers working in this space."
Check out AuditBoard's success story: https://grafana.com/success/auditboard
Check out AuditBoard's success story: https://grafana.com/success/auditboard

November 10, 2025 at 3:41 PM
"[With Grafana Cloud], we’re getting maximum value per dollar and we’re spending on a platform where the skills the team is developing are useful to engineers working in this space."
Check out AuditBoard's success story: https://grafana.com/success/auditboard
Check out AuditBoard's success story: https://grafana.com/success/auditboard
#OpenTelemetry can enhance #Java application reliability by uncovering hidden production issues through real-time observability and tracing.
Watch and learn practical techniques to diagnose problems and improve performance, especially in cloud-native and microservice environments.
Watch and learn practical techniques to diagnose problems and improve performance, especially in cloud-native and microservice environments.

How I Solved Production Issues with OpenTelemetry And How You Can Too by Cees Bos
YouTube video by Devoxx
www.youtube.com
November 9, 2025 at 11:53 AM
#OpenTelemetry can enhance #Java application reliability by uncovering hidden production issues through real-time observability and tracing.
Watch and learn practical techniques to diagnose problems and improve performance, especially in cloud-native and microservice environments.
Watch and learn practical techniques to diagnose problems and improve performance, especially in cloud-native and microservice environments.
🤖 New to #MCP? It's an open source standard for connecting #AI applications to external systems.
In this video, Grafana Champion shows how to set up a #Grafana MCP server using VS Code. Check out his tutorial.
In this video, Grafana Champion shows how to set up a #Grafana MCP server using VS Code. Check out his tutorial.

Setup of Grafana MCP Server with VS Code and GitHub Co Pilot Agent
YouTube video by Bhoopesh Sharma
www.youtube.com
November 8, 2025 at 4:12 PM
Too many alerts, not enough insight?
Join our Nov. 13 webinar to see how Grafana IRM & SLOs in Grafana Cloud cut through the noise with AI-powered RCA & automated incident response.
🔗 https://grafana.com/go/webinar/getting-started-with-grafana-incident-response-and-management-irm-and-slo-apac
Join our Nov. 13 webinar to see how Grafana IRM & SLOs in Grafana Cloud cut through the noise with AI-powered RCA & automated incident response.
🔗 https://grafana.com/go/webinar/getting-started-with-grafana-incident-response-and-management-irm-and-slo-apac

November 8, 2025 at 1:00 AM
Too many alerts, not enough insight?
Join our Nov. 13 webinar to see how Grafana IRM & SLOs in Grafana Cloud cut through the noise with AI-powered RCA & automated incident response.
🔗 https://grafana.com/go/webinar/getting-started-with-grafana-incident-response-and-management-irm-and-slo-apac
Join our Nov. 13 webinar to see how Grafana IRM & SLOs in Grafana Cloud cut through the noise with AI-powered RCA & automated incident response.
🔗 https://grafana.com/go/webinar/getting-started-with-grafana-incident-response-and-management-irm-and-slo-apac
As a top 3 contributing company to #OpenTelemetry, we’re excited to be at #KubeCon next week at booth #444.
Don’t miss talks from our Grafanistas with topics ranging from OTel and Prometheus to debugging. See them all 👇
Don’t miss talks from our Grafanistas with topics ranging from OTel and Prometheus to debugging. See them all 👇

KubeCon North America 2025 | Grafana Labs | Grafana Labs
Grafana is a proud silver sponsor of this year’s KubeCon North America event, including Observability Day 2025.
grafana.com
November 7, 2025 at 4:17 PM
As a top 3 contributing company to #OpenTelemetry, we’re excited to be at #KubeCon next week at booth #444.
Don’t miss talks from our Grafanistas with topics ranging from OTel and Prometheus to debugging. See them all 👇
Don’t miss talks from our Grafanistas with topics ranging from OTel and Prometheus to debugging. See them all 👇
The 1st alpha of @opentelemetry.io eBPF instrumentation (OBI) is live 🎉
Originally Grafana Beyla, OBI brings zero-code, zero-downtime telemetry to any app.
Read the blog post: https://opentelemetry.io/blog/2025/obi-announcing-first-release/
Originally Grafana Beyla, OBI brings zero-code, zero-downtime telemetry to any app.
Read the blog post: https://opentelemetry.io/blog/2025/obi-announcing-first-release/

OpenTelemetry eBPF Instrumentation Marks the First Release
Following a significant collaboration between Grafana Labs, Splunk, Coralogix, Odigos and many other community members, we are thrilled to announce the first alpha release of OpenTelemetry eBPF Instru...
opentelemetry.io
November 7, 2025 at 12:00 AM
The 1st alpha of @opentelemetry.io eBPF instrumentation (OBI) is live 🎉
Originally Grafana Beyla, OBI brings zero-code, zero-downtime telemetry to any app.
Read the blog post: https://opentelemetry.io/blog/2025/obi-announcing-first-release/
Originally Grafana Beyla, OBI brings zero-code, zero-downtime telemetry to any app.
Read the blog post: https://opentelemetry.io/blog/2025/obi-announcing-first-release/
🚨 Looking for best practices on alerting in Grafana?
Join us Nov 13 for Intro to Alerting with Grafana, a live webinar covering how to cut alerting toil, use adaptive alerts, & focus on what matters most.
🔗 Register: https://grafana.com/go/webinar/intro-to-alerting-with-grafana
Join us Nov 13 for Intro to Alerting with Grafana, a live webinar covering how to cut alerting toil, use adaptive alerts, & focus on what matters most.
🔗 Register: https://grafana.com/go/webinar/intro-to-alerting-with-grafana

November 6, 2025 at 9:00 PM
🚨 Looking for best practices on alerting in Grafana?
Join us Nov 13 for Intro to Alerting with Grafana, a live webinar covering how to cut alerting toil, use adaptive alerts, & focus on what matters most.
🔗 Register: https://grafana.com/go/webinar/intro-to-alerting-with-grafana
Join us Nov 13 for Intro to Alerting with Grafana, a live webinar covering how to cut alerting toil, use adaptive alerts, & focus on what matters most.
🔗 Register: https://grafana.com/go/webinar/intro-to-alerting-with-grafana
🎉 You can now save and reuse queries in #Grafana Cloud!
Save time, help new team members get up to speed faster, and ensure your entire organization benefits from consistent, well-crafted queries.
Save time, help new team members get up to speed faster, and ensure your entire organization benefits from consistent, well-crafted queries.

Faster, more collaborative data exploration: Introducing saved queries in Grafana Cloud | Grafana Labs
By saving and reusing queries in Grafana Cloud, you help new team members get up to speed faster and ensure your entire organization benefits from consistent, well-crafted queries.
grafana.com
November 6, 2025 at 3:55 PM
🎉 You can now save and reuse queries in #Grafana Cloud!
Save time, help new team members get up to speed faster, and ensure your entire organization benefits from consistent, well-crafted queries.
Save time, help new team members get up to speed faster, and ensure your entire organization benefits from consistent, well-crafted queries.
“We're not [load] testing to celebrate every green light.. we load test to uncover failures.”
Senior SRE Christopher Orchard shared how Just Eat Takeaway.com built a blameless culture around reliability & why Grafana Cloud k6 is central to it.
https://youtu.be/qG5tCR4OS9g?si=UuEKfvUbeOWlB2RV
Senior SRE Christopher Orchard shared how Just Eat Takeaway.com built a blameless culture around reliability & why Grafana Cloud k6 is central to it.
https://youtu.be/qG5tCR4OS9g?si=UuEKfvUbeOWlB2RV
November 6, 2025 at 8:00 AM
“We're not [load] testing to celebrate every green light.. we load test to uncover failures.”
Senior SRE Christopher Orchard shared how Just Eat Takeaway.com built a blameless culture around reliability & why Grafana Cloud k6 is central to it.
https://youtu.be/qG5tCR4OS9g?si=UuEKfvUbeOWlB2RV
Senior SRE Christopher Orchard shared how Just Eat Takeaway.com built a blameless culture around reliability & why Grafana Cloud k6 is central to it.
https://youtu.be/qG5tCR4OS9g?si=UuEKfvUbeOWlB2RV
Reposted by Grafana

This is exciting; the team behind the @grafana.bsky.social Cloud portal landed a feature I originally built as my first hackathon project, an instance picker!
Go to grafana.com/launch/explore, pick a Grafana Cloud instance, and you'll land on the explore page. Any route after /launch works.
Go to grafana.com/launch/explore, pick a Grafana Cloud instance, and you'll land on the explore page. Any route after /launch works.
Grafana Cloud
Welcome to Grafana Cloud
grafana.com
November 6, 2025 at 3:44 AM
This is exciting; the team behind the @grafana.bsky.social Cloud portal landed a feature I originally built as my first hackathon project, an instance picker!
Go to grafana.com/launch/explore, pick a Grafana Cloud instance, and you'll land on the explore page. Any route after /launch works.
Go to grafana.com/launch/explore, pick a Grafana Cloud instance, and you'll land on the explore page. Any route after /launch works.
Before you can build Alloy pipelines, you need your playground!
In Ep. 4 of Grafana Alloy for Beginners, Lisa Jung shows how to set up a learning environment that generates metrics, logs, traces & profiles, plus Grafana’s LGTMP stack to observe your environment!
🎥 https://youtu.be/fZRwVwCvLAg
In Ep. 4 of Grafana Alloy for Beginners, Lisa Jung shows how to set up a learning environment that generates metrics, logs, traces & profiles, plus Grafana’s LGTMP stack to observe your environment!
🎥 https://youtu.be/fZRwVwCvLAg

November 5, 2025 at 10:00 PM
Before you can build Alloy pipelines, you need your playground!
In Ep. 4 of Grafana Alloy for Beginners, Lisa Jung shows how to set up a learning environment that generates metrics, logs, traces & profiles, plus Grafana’s LGTMP stack to observe your environment!
🎥 https://youtu.be/fZRwVwCvLAg
In Ep. 4 of Grafana Alloy for Beginners, Lisa Jung shows how to set up a learning environment that generates metrics, logs, traces & profiles, plus Grafana’s LGTMP stack to observe your environment!
🎥 https://youtu.be/fZRwVwCvLAg
Grafana Mimir 3.0 is here! 🎉
The release marks a new era for the open source, horizontally scalable, multi-tenant time series database (TSDB), delivering dramatic improvements in both reliability and performance.
The release marks a new era for the open source, horizontally scalable, multi-tenant time series database (TSDB), delivering dramatic improvements in both reliability and performance.

Grafana Mimir 3.0 release: performance improvements, a new query engine, and more | Grafana Labs
Grafana Mimir 3.0 marks a new era for the open source time series database, delivering dramatic improvements in both reliability and performance.
grafana.com
November 5, 2025 at 11:00 AM
Grafana Mimir 3.0 is here! 🎉
The release marks a new era for the open source, horizontally scalable, multi-tenant time series database (TSDB), delivering dramatic improvements in both reliability and performance.
The release marks a new era for the open source, horizontally scalable, multi-tenant time series database (TSDB), delivering dramatic improvements in both reliability and performance.
From 🍕 apps to production: Grafana k6 Studio records real interactions & turns them into automated performance tests.
Great blog from a Grafana Champion: https://medium.com/@monish.correia/from-recording-to-reality-how-k6-studio-transforms-manual-testing-into-automated-performance-4891b1069e61
Great blog from a Grafana Champion: https://medium.com/@monish.correia/from-recording-to-reality-how-k6-studio-transforms-manual-testing-into-automated-performance-4891b1069e61

November 5, 2025 at 1:00 AM
From 🍕 apps to production: Grafana k6 Studio records real interactions & turns them into automated performance tests.
Great blog from a Grafana Champion: https://medium.com/@monish.correia/from-recording-to-reality-how-k6-studio-transforms-manual-testing-into-automated-performance-4891b1069e61
Great blog from a Grafana Champion: https://medium.com/@monish.correia/from-recording-to-reality-how-k6-studio-transforms-manual-testing-into-automated-performance-4891b1069e61
You've got a handle on logs and metrics... but what about traces?
If you're new to Grafana Tempo, join the webinar on Nov 7.
We'll demo how to use logs and #Prometheus exemplars to find traces effectively in Tempo.
If you're new to Grafana Tempo, join the webinar on Nov 7.
We'll demo how to use logs and #Prometheus exemplars to find traces effectively in Tempo.

How to get started with tracing and Grafana Tempo
In this webinar, we'll show you how to get started setting up Grafana Tempo, our open source, easy-to-use and high-volume distributed tracing backend.
grafana.com
November 5, 2025 at 12:00 AM
You've got a handle on logs and metrics... but what about traces?
If you're new to Grafana Tempo, join the webinar on Nov 7.
We'll demo how to use logs and #Prometheus exemplars to find traces effectively in Tempo.
If you're new to Grafana Tempo, join the webinar on Nov 7.
We'll demo how to use logs and #Prometheus exemplars to find traces effectively in Tempo.
This month's Pyroscope Community Call is happening on Nov 6 at 5 pm CET/8 am PT!
Join the call as the team discusses diff view + metrics from profiles.
www.youtube.com/watch?v=ozf2...
Join the call as the team discusses diff view + metrics from profiles.
www.youtube.com/watch?v=ozf2...

Grafana Pyroscope: Diff view & Metrics from Profiles (November 2025 Community Call)
YouTube video by Grafana
www.youtube.com
November 4, 2025 at 11:44 PM
This month's Pyroscope Community Call is happening on Nov 6 at 5 pm CET/8 am PT!
Join the call as the team discusses diff view + metrics from profiles.
www.youtube.com/watch?v=ozf2...
Join the call as the team discusses diff view + metrics from profiles.
www.youtube.com/watch?v=ozf2...
As part of the 4th Annual Observability Survey, we’re introducing a series where we pair your responses to one of the things we all love to observe — landmarks & world wonders.
🌏 Which world wonder best reflects your response? See the thread to find out.
🌏 Which world wonder best reflects your response? See the thread to find out.

November 4, 2025 at 7:44 PM
As part of the 4th Annual Observability Survey, we’re introducing a series where we pair your responses to one of the things we all love to observe — landmarks & world wonders.
🌏 Which world wonder best reflects your response? See the thread to find out.
🌏 Which world wonder best reflects your response? See the thread to find out.
☁️ Headed to #KubeCon North America?
Book a meeting with the Grafana Labs team to talk observability, Kubernetes, and what’s new in Grafana Cloud.
➡️ https://events.grafana.com/2025-11-kubeconnorthamerica-meetingrequest
Can’t make it? Learn more: https://grafana.com/solutions/kubernetes
Book a meeting with the Grafana Labs team to talk observability, Kubernetes, and what’s new in Grafana Cloud.
➡️ https://events.grafana.com/2025-11-kubeconnorthamerica-meetingrequest
Can’t make it? Learn more: https://grafana.com/solutions/kubernetes

November 3, 2025 at 10:32 PM
☁️ Headed to #KubeCon North America?
Book a meeting with the Grafana Labs team to talk observability, Kubernetes, and what’s new in Grafana Cloud.
➡️ https://events.grafana.com/2025-11-kubeconnorthamerica-meetingrequest
Can’t make it? Learn more: https://grafana.com/solutions/kubernetes
Book a meeting with the Grafana Labs team to talk observability, Kubernetes, and what’s new in Grafana Cloud.
➡️ https://events.grafana.com/2025-11-kubeconnorthamerica-meetingrequest
Can’t make it? Learn more: https://grafana.com/solutions/kubernetes
📣 #Prometheus native histograms are now GA in Grafana Cloud, giving you greater precision, ease of use, and compatibility for analyzing your metrics.
Discover how they improve on the classic Prometheus histograms.
Discover how they improve on the classic Prometheus histograms.

Prometheus native histograms in Grafana Cloud: Get more precision from your Grafana visualizations | Grafana Labs
Prometheus native histograms are now generally available, giving you greater precision, ease of use, and compatibility for analyzing latency, duration, and other distributions.
grafana.com
November 3, 2025 at 9:00 PM
📣 #Prometheus native histograms are now GA in Grafana Cloud, giving you greater precision, ease of use, and compatibility for analyzing your metrics.
Discover how they improve on the classic Prometheus histograms.
Discover how they improve on the classic Prometheus histograms.
💰 The Adaptive Telemetry suite in Grafana Cloud enables organizations to capture and surface the data that delivers business value.
This helps eliminate noise, reduce operational complexity, and cut down observability costs — by 30-50% on average.
This helps eliminate noise, reduce operational complexity, and cut down observability costs — by 30-50% on average.
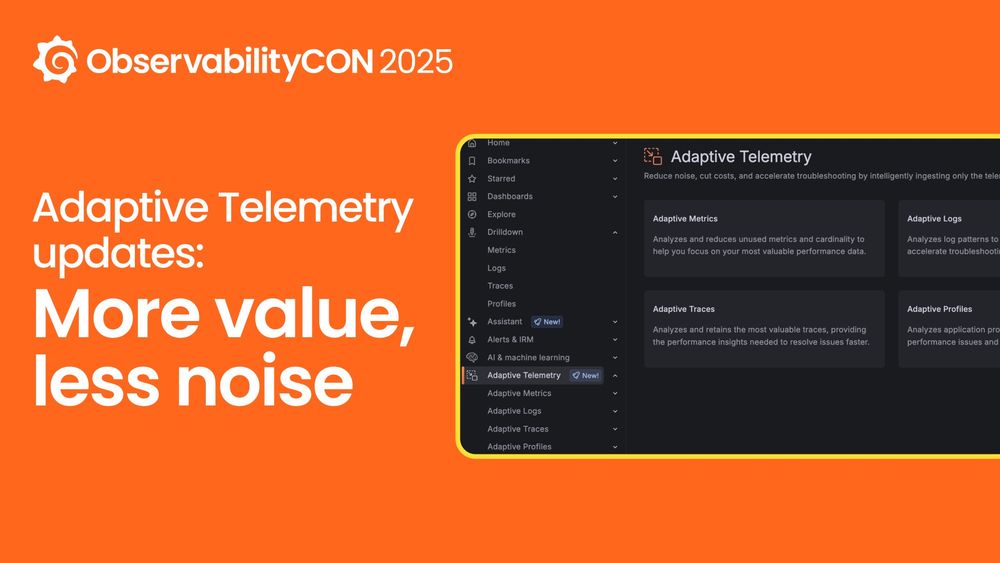
Maximize data value and cut costs: Adaptive Telemetry for metrics, logs, traces, and profiles in Grafana Cloud | Grafana Labs
With Adaptive Traces now generally available and Adaptive Profiles in private preview, the Adaptive Telemetry suite in Grafana Cloud extends across your end-to-end observability stack, reducing both n...
grafana.com
November 3, 2025 at 5:00 PM
💰 The Adaptive Telemetry suite in Grafana Cloud enables organizations to capture and surface the data that delivers business value.
This helps eliminate noise, reduce operational complexity, and cut down observability costs — by 30-50% on average.
This helps eliminate noise, reduce operational complexity, and cut down observability costs — by 30-50% on average.
🚀 SQL expressions are now available in public preview in #Grafana OSS & Grafana Cloud!
This is a powerful feature that opens up all sorts of creative possibilities by manipulating & combining data from different data sources.
This is a powerful feature that opens up all sorts of creative possibilities by manipulating & combining data from different data sources.

SQL expressions in Grafana: Combine and manipulate data from multiple sources | Grafana Labs
SQL expressions are a versatile and powerful feature that opens up all sorts of creative possibilities by manipulating and combining data from different data sources.
grafana.com
November 3, 2025 at 1:00 PM
🚀 SQL expressions are now available in public preview in #Grafana OSS & Grafana Cloud!
This is a powerful feature that opens up all sorts of creative possibilities by manipulating & combining data from different data sources.
This is a powerful feature that opens up all sorts of creative possibilities by manipulating & combining data from different data sources.
We’re proud to team up with Coding Black Females on a hands-on workshop in London on Nov. 13.
Learn how to turn API data into interactive dashboards — no backend needed!
www.eventbrite.co.uk/e/apis-to-om...
Learn how to turn API data into interactive dashboards — no backend needed!
www.eventbrite.co.uk/e/apis-to-om...

November 3, 2025 at 9:30 AM
We’re proud to team up with Coding Black Females on a hands-on workshop in London on Nov. 13.
Learn how to turn API data into interactive dashboards — no backend needed!
www.eventbrite.co.uk/e/apis-to-om...
Learn how to turn API data into interactive dashboards — no backend needed!
www.eventbrite.co.uk/e/apis-to-om...
We’re proud to team up with Coding Black Females on a hands-on workshop in London on Nov. 13.
Learn how to turn API data into interactive dashboards — no backend needed!
Learn how to turn API data into interactive dashboards — no backend needed!

APIs to OMG: Transform your API data to fun Grafana dashboards
Learn to connect Grafana to APIs, create beautiful dashboards, and turn raw data into interactive graphs. Bring your laptop!
www.eventbrite.co.uk
November 3, 2025 at 9:00 AM
We’re proud to team up with Coding Black Females on a hands-on workshop in London on Nov. 13.
Learn how to turn API data into interactive dashboards — no backend needed!
Learn how to turn API data into interactive dashboards — no backend needed!
👋 We can’t wait to see you at #KubeCon + CloudNativeCon North America 2025!
See our around #Prometheus, #OpenTelemetry, and more, and swing by booth #444 in the sponsor solutions showcase to meet the team and score some swag!
See our around #Prometheus, #OpenTelemetry, and more, and swing by booth #444 in the sponsor solutions showcase to meet the team and score some swag!

Grafana Labs at KubeCon: OpenTelemetry eBPF Instrumentation, Prometheus deep dives, and more | Grafana Labs
Meet us at KubeCon North America 2025! Our observability experts are participating in multiple sessions throughout the week, and you can find us at booth #444 in the sponsor solutions showcase.
grafana.com
October 31, 2025 at 6:48 PM
👋 We can’t wait to see you at #KubeCon + CloudNativeCon North America 2025!
See our around #Prometheus, #OpenTelemetry, and more, and swing by booth #444 in the sponsor solutions showcase to meet the team and score some swag!
See our around #Prometheus, #OpenTelemetry, and more, and swing by booth #444 in the sponsor solutions showcase to meet the team and score some swag!