


GoatShipMate
@goatshipmate.bsky.social
Data Analyst mainly posting work-arounds for #PowerBI #PowerQuery #Excel etc, but also posting about #DataVisualisation in general.
#ThirdSector #Charity #DataViz.
I'm an #ActualPerson – my pseudonym is due to my job's social media policy
#ThirdSector #Charity #DataViz.
I'm an #ActualPerson – my pseudonym is due to my job's social media policy
Looks like it doesn't like the date in this format:
2025-10-31T08:25:23.
Can't remember why I used this format now. I have a feeling it's because another part of the MS universe went wrong if I did it in another format.
2025-10-31T08:25:23.
Can't remember why I used this format now. I have a feeling it's because another part of the MS universe went wrong if I did it in another format.

November 12, 2025 at 9:57 AM
Looks like it doesn't like the date in this format:
2025-10-31T08:25:23.
Can't remember why I used this format now. I have a feeling it's because another part of the MS universe went wrong if I did it in another format.
2025-10-31T08:25:23.
Can't remember why I used this format now. I have a feeling it's because another part of the MS universe went wrong if I did it in another format.
Has anyone come across/solved this issue?
I'm trying to paste a table copied from Power BI Table View (aka Data View) into Excel. It has worked many times a day for months and months, but suddenly I'm getting this error.
"This file cannot be opened because of errors. Errors are listed in: ...log."
I'm trying to paste a table copied from Power BI Table View (aka Data View) into Excel. It has worked many times a day for months and months, but suddenly I'm getting this error.
"This file cannot be opened because of errors. Errors are listed in: ...log."

November 12, 2025 at 9:41 AM
Has anyone come across/solved this issue?
I'm trying to paste a table copied from Power BI Table View (aka Data View) into Excel. It has worked many times a day for months and months, but suddenly I'm getting this error.
"This file cannot be opened because of errors. Errors are listed in: ...log."
I'm trying to paste a table copied from Power BI Table View (aka Data View) into Excel. It has worked many times a day for months and months, but suddenly I'm getting this error.
"This file cannot be opened because of errors. Errors are listed in: ...log."
Is there a more annoying #Excel error message than this one?
"Yes I'm writing a 4-term LET() formula, I know what the equals sign at the start means"
"Yes I'm writing a 4-term LET() formula, I know what the equals sign at the start means"

November 5, 2025 at 2:18 PM
Is there a more annoying #Excel error message than this one?
"Yes I'm writing a 4-term LET() formula, I know what the equals sign at the start means"
"Yes I'm writing a 4-term LET() formula, I know what the equals sign at the start means"
Under "Style" there are options for 'Data value', 'Name' or 'Both', so if you change the name of the line to "Median" (or whatever) and choose both, I think that should give you something closer to what you want. (Or have I misunderstood?).
Just don't go wanting to vary the font size...
Just don't go wanting to vary the font size...

October 24, 2025 at 8:46 AM
Under "Style" there are options for 'Data value', 'Name' or 'Both', so if you change the name of the line to "Median" (or whatever) and choose both, I think that should give you something closer to what you want. (Or have I misunderstood?).
Just don't go wanting to vary the font size...
Just don't go wanting to vary the font size...

It would be great to be able to change the width of columns in Table View/Data View in #PowerBI by right clicking & inputting a value (like you can in Excel). I have one that always auto-sets & its over a screen wide. Takes several drags to get it to a useable size. Any hope @itsnotaboutthecell.com

September 8, 2025 at 3:35 PM
It would be great to be able to change the width of columns in Table View/Data View in #PowerBI by right clicking & inputting a value (like you can in Excel). I have one that always auto-sets & its over a screen wide. Takes several drags to get it to a useable size. Any hope @itsnotaboutthecell.com
If in #PowerBI you can't get the intersection to match the total row colour try this measure in 'Cell Elements':
IntersectionColour =
IF(
NOT ISINSCOPE('Table'[RowField]) && NOT ISINSCOPE('Table'[ColumnField]),
"#FFD700", //(rgb color)
BLANK()
)
[Remember to choose 'Totals only']
IntersectionColour =
IF(
NOT ISINSCOPE('Table'[RowField]) && NOT ISINSCOPE('Table'[ColumnField]),
"#FFD700", //(rgb color)
BLANK()
)
[Remember to choose 'Totals only']

August 15, 2025 at 5:22 PM
If in #PowerBI you can't get the intersection to match the total row colour try this measure in 'Cell Elements':
IntersectionColour =
IF(
NOT ISINSCOPE('Table'[RowField]) && NOT ISINSCOPE('Table'[ColumnField]),
"#FFD700", //(rgb color)
BLANK()
)
[Remember to choose 'Totals only']
IntersectionColour =
IF(
NOT ISINSCOPE('Table'[RowField]) && NOT ISINSCOPE('Table'[ColumnField]),
"#FFD700", //(rgb color)
BLANK()
)
[Remember to choose 'Totals only']

New blog post. How to solve it in #Excel when those pesky yellow triangles pop up telling you your imports matches no exports
#PowerQuery
charitydatageek.blogspot.com/2025/07/exce...
#PowerQuery
charitydatageek.blogspot.com/2025/07/exce...

July 24, 2025 at 3:46 PM
New blog post. How to solve it in #Excel when those pesky yellow triangles pop up telling you your imports matches no exports
#PowerQuery
charitydatageek.blogspot.com/2025/07/exce...
#PowerQuery
charitydatageek.blogspot.com/2025/07/exce...
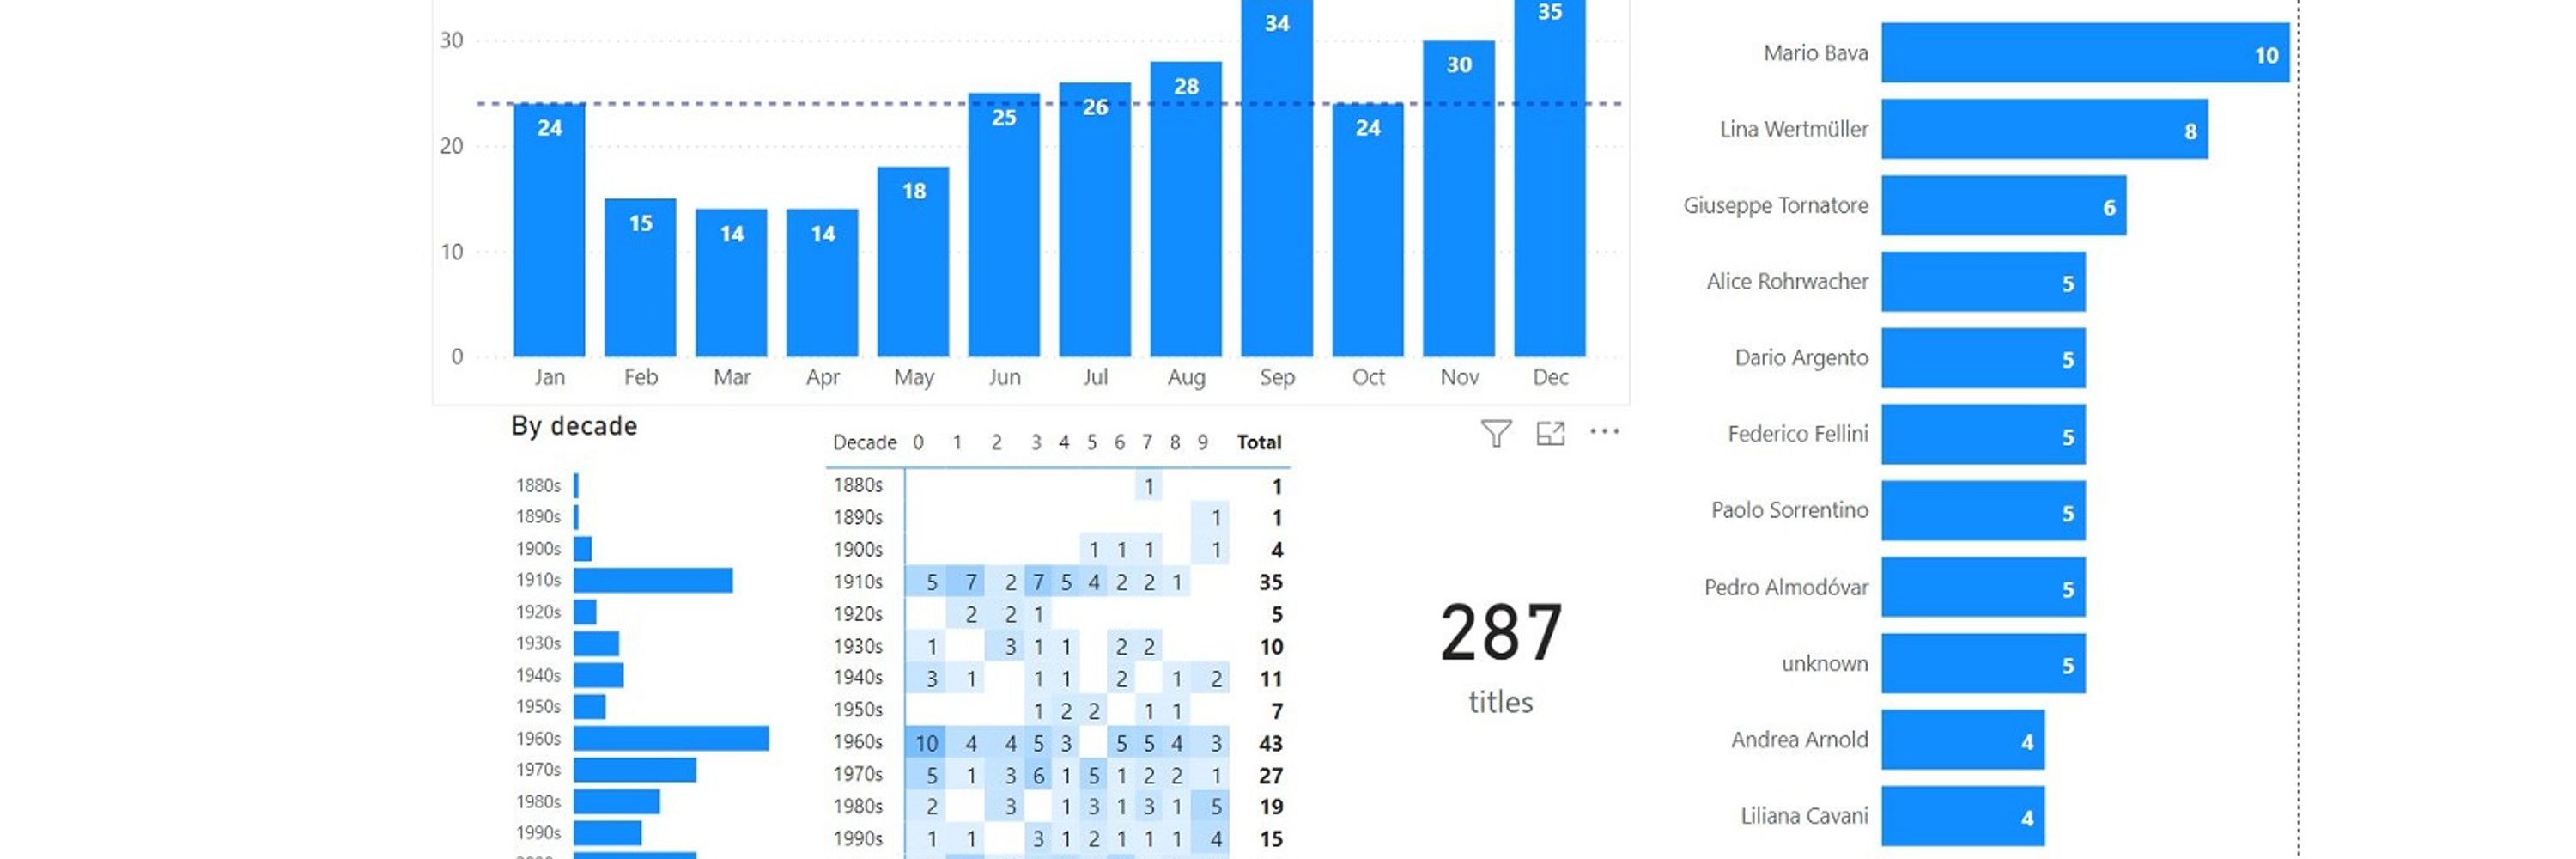
Can you add a non-constant average line to a line chart in PowerBI?
Everyone said no (at least not without superimposing), but eventually I figured out a work-around.
Everyone said no (at least not without superimposing), but eventually I figured out a work-around.

July 17, 2025 at 3:17 PM
Can you add a non-constant average line to a line chart in PowerBI?
Everyone said no (at least not without superimposing), but eventually I figured out a work-around.
Everyone said no (at least not without superimposing), but eventually I figured out a work-around.
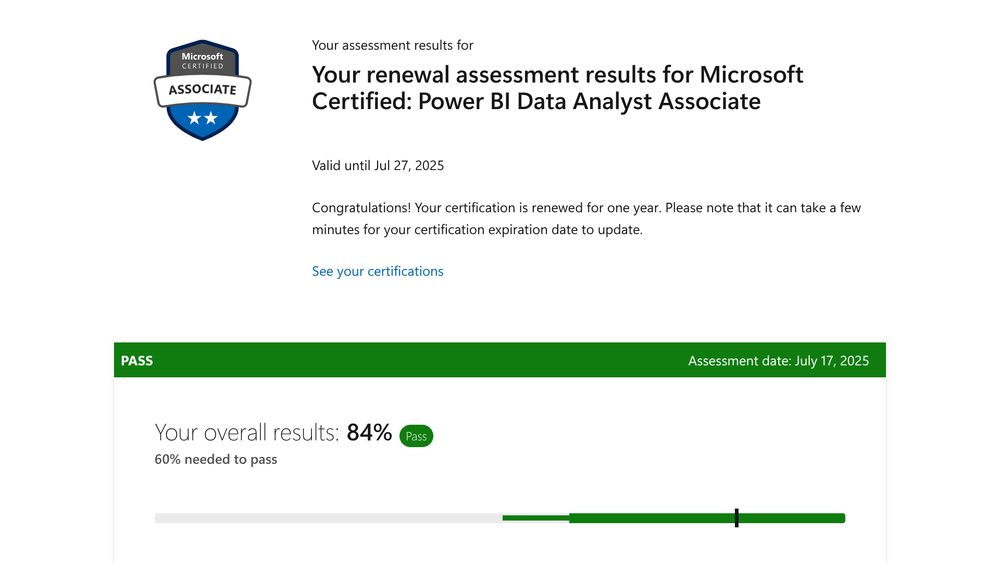
Nice to pass my #PowerBl Data Analyst Associate reassessment again.
Of the 4 I got wrong a couple contained terms I don't recall hearing even with going through all the MS Learn material (which I think is the point in some areas – I also got DAX questions right that aren't in the materials)
Of the 4 I got wrong a couple contained terms I don't recall hearing even with going through all the MS Learn material (which I think is the point in some areas – I also got DAX questions right that aren't in the materials)
July 17, 2025 at 8:43 AM
Nice to pass my #PowerBl Data Analyst Associate reassessment again.
Of the 4 I got wrong a couple contained terms I don't recall hearing even with going through all the MS Learn material (which I think is the point in some areas – I also got DAX questions right that aren't in the materials)
Of the 4 I got wrong a couple contained terms I don't recall hearing even with going through all the MS Learn material (which I think is the point in some areas – I also got DAX questions right that aren't in the materials)
I asked Co-pilot to rephrase MS Learn's bit on using parameters in visual calculations in a way that was suitable for someone with ADHD and this is how it started out
July 13, 2025 at 10:47 AM
I asked Co-pilot to rephrase MS Learn's bit on using parameters in visual calculations in a way that was suitable for someone with ADHD and this is how it started out
Sorry the image was meant to be tighter.

July 13, 2025 at 10:05 AM
Sorry the image was meant to be tighter.
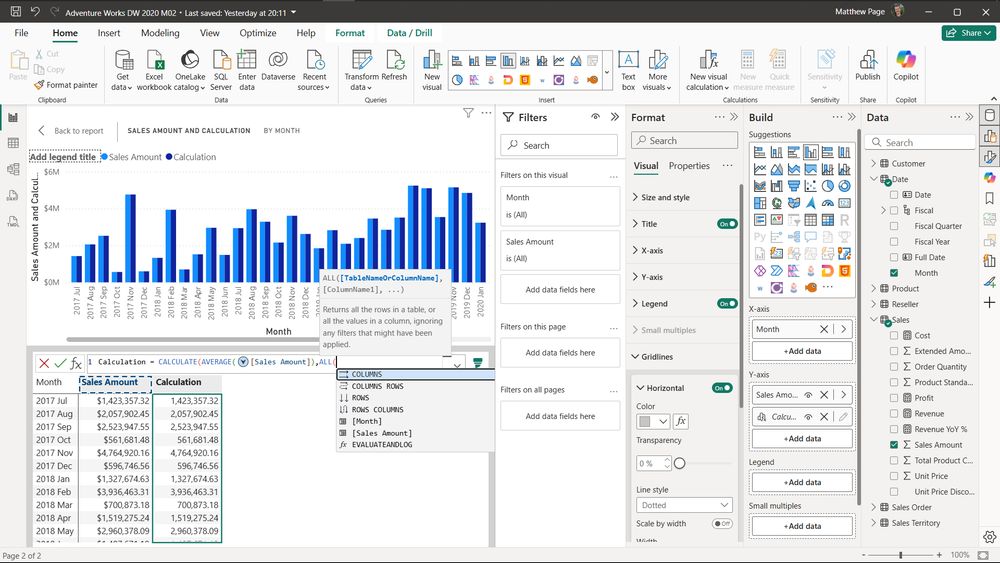
#7. Now I'm back in and think I can make this work. I know enough DAX to know it should be [Month], but before I can type this I'm given a bewildering array of options. Note the tip here actually confuses me rather than clears things up.
July 13, 2025 at 9:37 AM
#7. Now I'm back in and think I can make this work. I know enough DAX to know it should be [Month], but before I can type this I'm given a bewildering array of options. Note the tip here actually confuses me rather than clears things up.
#6 (cont) Several times when I've done this loop I've gone round this a few times & ended up just deleting the whole visual and starting again. ("I must have done something wrong"). All I've done is make my loop bigger.
Eventually I spy the logos
Eventually I spy the logos

July 13, 2025 at 9:31 AM
#6 (cont) Several times when I've done this loop I've gone round this a few times & ended up just deleting the whole visual and starting again. ("I must have done something wrong"). All I've done is make my loop bigger.
Eventually I spy the logos
Eventually I spy the logos
#3. So I go custom & breathe a sigh of relief. It looks easy enough. I type average & get 2 tips which suggest I put in the column name. Obvious, right?
Wrong!
I mean obviously it's wrong now I see it, it's averaging on a row basis. But now I have two problems:
Wrong!
I mean obviously it's wrong now I see it, it's averaging on a row basis. But now I have two problems:


July 13, 2025 at 9:09 AM
#3. So I go custom & breathe a sigh of relief. It looks easy enough. I type average & get 2 tips which suggest I put in the column name. Obvious, right?
Wrong!
I mean obviously it's wrong now I see it, it's averaging on a row basis. But now I have two problems:
Wrong!
I mean obviously it's wrong now I see it, it's averaging on a row basis. But now I have two problems:
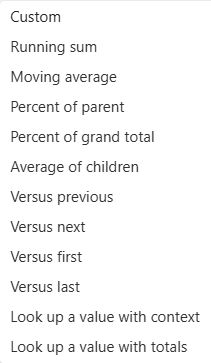
#2. I have a sales vs month column chart.I want to add an average line. I right click & get these options.These all sound more advanced than what I want & many I can't actually do. So I'm straight into trying to figure out custom. Versus looks useful,but I'd suggest the options here need researching
July 13, 2025 at 8:58 AM
#2. I have a sales vs month column chart.I want to add an average line. I right click & get these options.These all sound more advanced than what I want & many I can't actually do. So I'm straight into trying to figure out custom. Versus looks useful,but I'd suggest the options here need researching
Using #SVGs to give a hand shaded/sketched feel to bar charts in PowerPoint by generating flexible fill code in #Excel using #DynamicArrays and RANDBETWEEN(). Pretty pleased with this. Learnt a lot getting to this point.

July 10, 2025 at 5:13 PM
Using #SVGs to give a hand shaded/sketched feel to bar charts in PowerPoint by generating flexible fill code in #Excel using #DynamicArrays and RANDBETWEEN(). Pretty pleased with this. Learnt a lot getting to this point.
I have a similar (if less technical) list myself, but this one is a regular one. In cards, please just let me be able to put my category label to the left (or right) of my callout value. There are imperfect / complicated work arounds, but this feels like it should be an easy one.

June 19, 2025 at 7:17 AM
I have a similar (if less technical) list myself, but this one is a regular one. In cards, please just let me be able to put my category label to the left (or right) of my callout value. There are imperfect / complicated work arounds, but this feels like it should be an easy one.
I love this from Aurélien Vautier at datavizclarity.com about how data teams need to focus on the end product as well as all the tech bits and info systems they work with

June 3, 2025 at 9:58 AM
I love this from Aurélien Vautier at datavizclarity.com about how data teams need to focus on the end product as well as all the tech bits and info systems they work with
Someone has just unleashed this in a meeting I'm in so obviously I'm really happy about it

May 21, 2025 at 9:51 AM
Someone has just unleashed this in a meeting I'm in so obviously I'm really happy about it
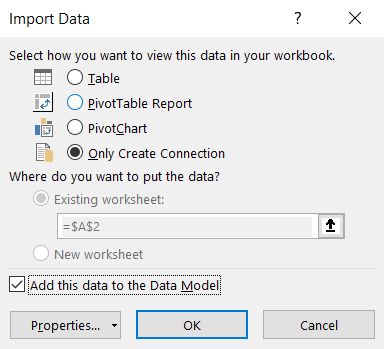
My content's been a bit -ve recently, so here's a useful thing.
In #PowerQuery u can keep tabs on the no. of records by
#"Counted Rows" = Table.RowCount(#"PreviousRow"),
Total = List.Sum(#"Filtered Rows1"[Users])
#"Text Total" = "Total= "&Text.From(Total)&" from "&Text.From(#"Counted Rows")&" rows"
In #PowerQuery u can keep tabs on the no. of records by
#"Counted Rows" = Table.RowCount(#"PreviousRow"),
Total = List.Sum(#"Filtered Rows1"[Users])
#"Text Total" = "Total= "&Text.From(Total)&" from "&Text.From(#"Counted Rows")&" rows"

April 30, 2025 at 9:13 AM
My content's been a bit -ve recently, so here's a useful thing.
In #PowerQuery u can keep tabs on the no. of records by
#"Counted Rows" = Table.RowCount(#"PreviousRow"),
Total = List.Sum(#"Filtered Rows1"[Users])
#"Text Total" = "Total= "&Text.From(Total)&" from "&Text.From(#"Counted Rows")&" rows"
In #PowerQuery u can keep tabs on the no. of records by
#"Counted Rows" = Table.RowCount(#"PreviousRow"),
Total = List.Sum(#"Filtered Rows1"[Users])
#"Text Total" = "Total= "&Text.From(Total)&" from "&Text.From(#"Counted Rows")&" rows"

This is not how that was supposed to look on reopening

March 27, 2025 at 2:24 PM
This is not how that was supposed to look on reopening