


Gina C. Pieters, PhD
@ginapieters.bsky.social
I was an academic economist for over 10 yrs (UMinn, TrinityU, UChicago) now I work as a researcher specializing in macro-system impacts of digital assets, money, & payments (crypto/stablecoins/CBDCs). #EconSky #Chicago
www.digitaleconomyconsulting.com
www.digitaleconomyconsulting.com
The unforgettable adventures of two siblings spending their summer in the Japanese countryside.

June 12, 2025 at 12:55 AM
The unforgettable adventures of two siblings spending their summer in the Japanese countryside.
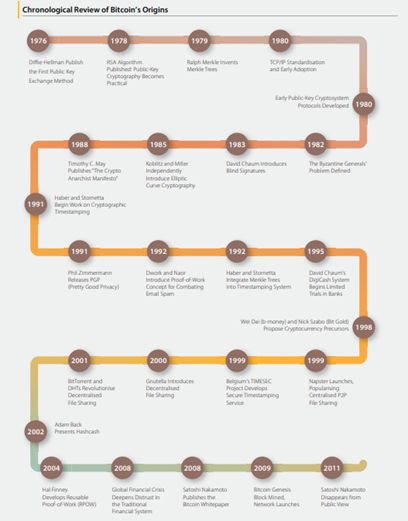
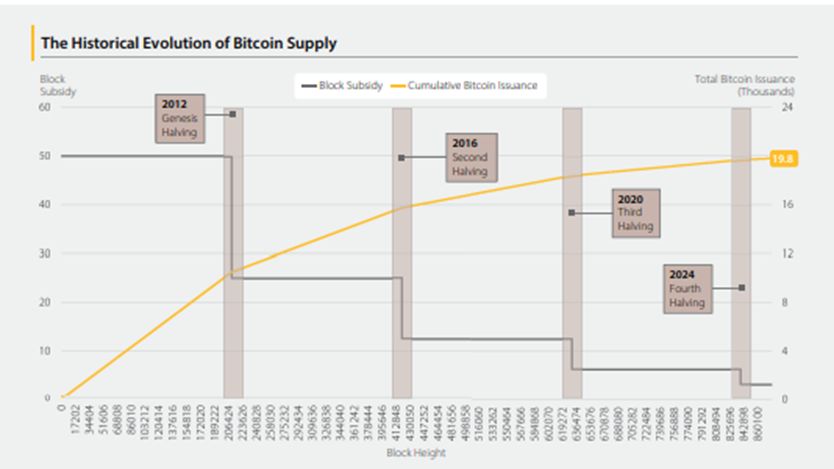
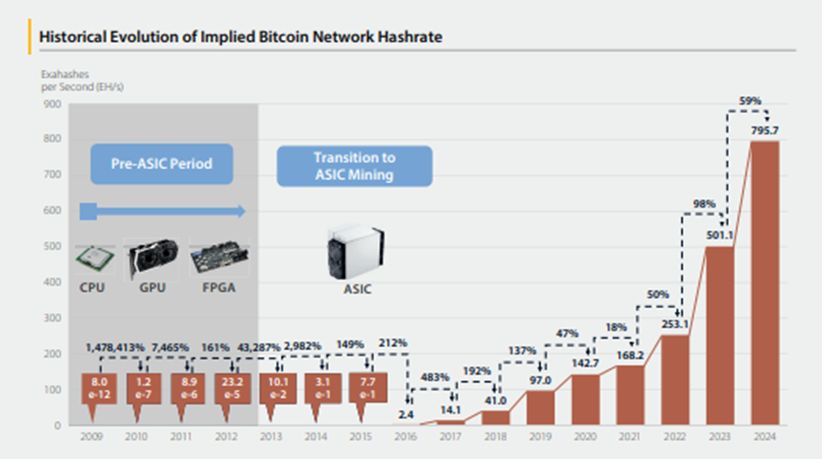
22/23// One other thing I’d like to highlight: The second chapter has some great “history of” and data visualizations of changes in this space.
May 6, 2025 at 3:57 PM
22/23// One other thing I’d like to highlight: The second chapter has some great “history of” and data visualizations of changes in this space.
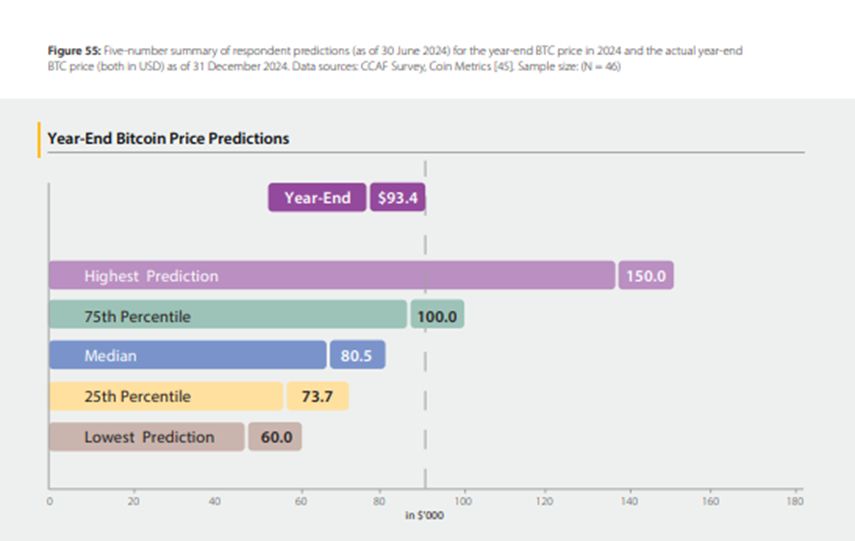
21/23// We also survey miner’s on their sentiments. One of my favorite questions asked their expectation of bitcoin price at the end of 2024. Turns out, the miners (who have survived several crypto-cycles at this point) were slightly too pessimistic.
May 6, 2025 at 3:57 PM
21/23// We also survey miner’s on their sentiments. One of my favorite questions asked their expectation of bitcoin price at the end of 2024. Turns out, the miners (who have survived several crypto-cycles at this point) were slightly too pessimistic.
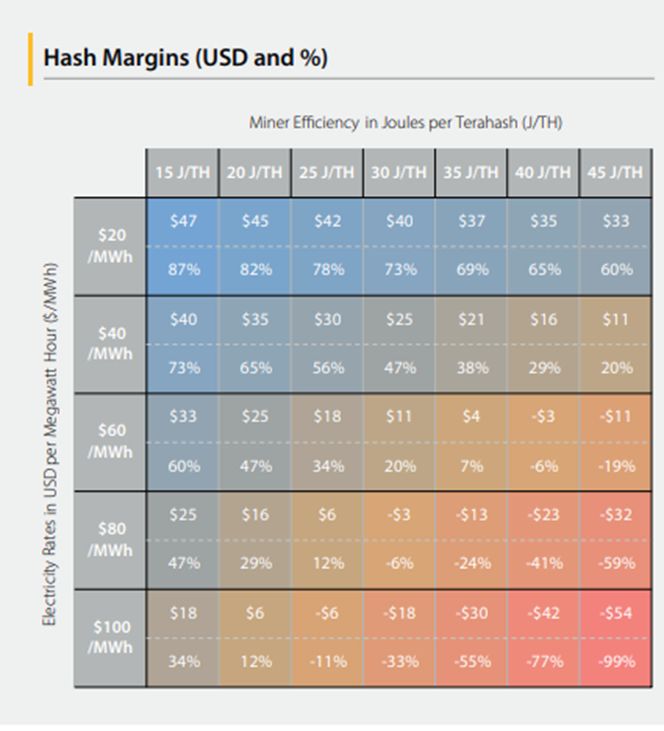
20/23// However, that profit margin is highly dependent on the intersection of energy costs and efficiency. Blue combinations in the chart below are profitable, red ones are not (recall that our current efficiency estimate is about 25 J/TH).
May 6, 2025 at 3:57 PM
20/23// However, that profit margin is highly dependent on the intersection of energy costs and efficiency. Blue combinations in the chart below are profitable, red ones are not (recall that our current efficiency estimate is about 25 J/TH).
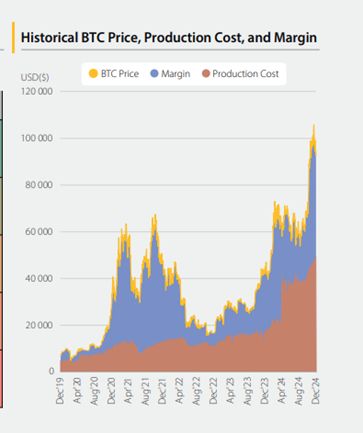
19/23// Finally, one of my favorite parts – revenue and costs. I’m going to gloss over a bunch of stuff (halvenings, competition, etc) to show just this graph. The cost (per bitcoin) has increased. The rise in the price of Bitcoin means that there is still a healthy profit margin though.
May 6, 2025 at 3:57 PM
19/23// Finally, one of my favorite parts – revenue and costs. I’m going to gloss over a bunch of stuff (halvenings, competition, etc) to show just this graph. The cost (per bitcoin) has increased. The rise in the price of Bitcoin means that there is still a healthy profit margin though.
18/23// Swiveling a bit: given the need AI has for datacenters, what role has miners engaged with there? It turns out, it’s a bit trickier than one may think – we have a section on this. Essentially, higher upfront costs, but also a higher profit margin. This is still in the “wait-and-see” space.

May 6, 2025 at 3:57 PM
18/23// Swiveling a bit: given the need AI has for datacenters, what role has miners engaged with there? It turns out, it’s a bit trickier than one may think – we have a section on this. Essentially, higher upfront costs, but also a higher profit margin. This is still in the “wait-and-see” space.
17/23// On a different topic: Miners can serve as large-flexible load customers, reducing their electricity use on-demand as needed, and soaking up excess during low-load times (increasing profits of energy providers when they “overbuild”). Do they? Yes! In our survey over half do.

May 6, 2025 at 3:57 PM
17/23// On a different topic: Miners can serve as large-flexible load customers, reducing their electricity use on-demand as needed, and soaking up excess during low-load times (increasing profits of energy providers when they “overbuild”). Do they? Yes! In our survey over half do.
15/23// Region Shift: Asia-Pacific used less renewable energy (26% vs. 63%) than US miners.
Scale Shift: As mining grew in the US it used less renewable grids (63% to 50%).
The “region shift” gain outweighs the “scale shift” loss in renewables (roughly, 20% at 26% vs. 30% at 50%).
Scale Shift: As mining grew in the US it used less renewable grids (63% to 50%).
The “region shift” gain outweighs the “scale shift” loss in renewables (roughly, 20% at 26% vs. 30% at 50%).

May 6, 2025 at 3:57 PM
15/23// Region Shift: Asia-Pacific used less renewable energy (26% vs. 63%) than US miners.
Scale Shift: As mining grew in the US it used less renewable grids (63% to 50%).
The “region shift” gain outweighs the “scale shift” loss in renewables (roughly, 20% at 26% vs. 30% at 50%).
Scale Shift: As mining grew in the US it used less renewable grids (63% to 50%).
The “region shift” gain outweighs the “scale shift” loss in renewables (roughly, 20% at 26% vs. 30% at 50%).
14/23// The good news is that the 2020 survey was broken down by region as well. For North-American firms 5 years ago, renewables were 63% of energy use. So, has there actually been a *decline* in renewable energy use? No.
May 6, 2025 at 3:57 PM
14/23// The good news is that the 2020 survey was broken down by region as well. For North-American firms 5 years ago, renewables were 63% of energy use. So, has there actually been a *decline* in renewable energy use? No.
13/23// How about the energy-source composition of their on-grid energy? The surveyed energy mix is now primarily sustainable (47.6% fossil fuels, 9.8% nuclear, 42.6% is renewable). However, is this a result of a shift in the survey participants? Recall our USA sample bias.

May 6, 2025 at 3:57 PM
13/23// How about the energy-source composition of their on-grid energy? The surveyed energy mix is now primarily sustainable (47.6% fossil fuels, 9.8% nuclear, 42.6% is renewable). However, is this a result of a shift in the survey participants? Recall our USA sample bias.
13/23// While about ¼ of miners use off-grid power, it only provides about 8% of their total power use. Better than 0%, but not a lot. We didn't really ask about this in 2020, so it'll be interesting to see how this evolves (if the survey is run again).

May 6, 2025 at 3:57 PM
13/23// While about ¼ of miners use off-grid power, it only provides about 8% of their total power use. Better than 0%, but not a lot. We didn't really ask about this in 2020, so it'll be interesting to see how this evolves (if the survey is run again).
10/23// This brings up one less discussed aspect of mining: E-Waste. As the machines age-out, what do miners do with them? Miners have multiple strategies: re-use (75.9%) and re-cycle programs (24.2%) are notable. In aggregate, only 13.1% of machines contribute to E-waste.


May 6, 2025 at 3:57 PM
10/23// This brings up one less discussed aspect of mining: E-Waste. As the machines age-out, what do miners do with them? Miners have multiple strategies: re-use (75.9%) and re-cycle programs (24.2%) are notable. In aggregate, only 13.1% of machines contribute to E-waste.
9// That’s why we get findings like this: the computational demand has increased by 455% since 2021, but electricity use has increased by only 111%. Not a small amount, but it is a stark reminder that you cannot compute from the “output” (hashrates) alone – you need information about the equipment.

May 6, 2025 at 3:57 PM
9// That’s why we get findings like this: the computational demand has increased by 455% since 2021, but electricity use has increased by only 111%. Not a small amount, but it is a stark reminder that you cannot compute from the “output” (hashrates) alone – you need information about the equipment.
8/23// Another visualization is this one: it looks at just the efficiency (energy per hash) – a decrease means improved efficiency – less energy required per hash. There has been a substantial improvement in just two years, from 41.8 to 25.3 joules per terahash.

May 6, 2025 at 3:57 PM
8/23// Another visualization is this one: it looks at just the efficiency (energy per hash) – a decrease means improved efficiency – less energy required per hash. There has been a substantial improvement in just two years, from 41.8 to 25.3 joules per terahash.
7/23// The amount of electricity that mining needs can be roughly thought of as the computational power needed (hash rate) x (energy needed per hash) = energy needed. Even as the hash rate demand has increased (the yellow bars), the energy needed per hash has declined (the blue line)

May 6, 2025 at 3:57 PM
7/23// The amount of electricity that mining needs can be roughly thought of as the computational power needed (hash rate) x (energy needed per hash) = energy needed. Even as the hash rate demand has increased (the yellow bars), the energy needed per hash has declined (the blue line)
6/23// Electricity use is always a big question for Bitcoin. Because we are surveying miners, we have really unique ability to get a glimpse of this – and compare it to circulating estimates. Our survey results are not that different in the aggregate to others -- a good sign.

May 6, 2025 at 3:57 PM
6/23// Electricity use is always a big question for Bitcoin. Because we are surveying miners, we have really unique ability to get a glimpse of this – and compare it to circulating estimates. Our survey results are not that different in the aggregate to others -- a good sign.
5/23// In 2020, Bitcoin was the dominant coin, but there was a broad representation of other coins. In 2025, 98.5% of mining was Bitcoin. This reflects Ethereum’s transition to PoS, but also shows how few PoW chains are of notable size.


May 6, 2025 at 3:57 PM
5/23// In 2020, Bitcoin was the dominant coin, but there was a broad representation of other coins. In 2025, 98.5% of mining was Bitcoin. This reflects Ethereum’s transition to PoS, but also shows how few PoW chains are of notable size.
4/23// This does indicate that at least 31.5% of the mining industry is in the US now. This is a significant shift from 2020 when it was only about 3.5%. Another notable change in just five years about half of all the surveyed miners were publicly listed!

May 6, 2025 at 3:57 PM
4/23// This does indicate that at least 31.5% of the mining industry is in the US now. This is a significant shift from 2020 when it was only about 3.5%. Another notable change in just five years about half of all the surveyed miners were publicly listed!
1//This thread is going to cover some findings from the first dedicated CCAF mining survey, which I co-authored with Alex Neumueller, @kmohaddes.bsky.social, Valentin Rosseau, and Bryan Zhang. I’m going to try and make it accessible to people who may only have a vague sense of what crypto-mining is.

May 6, 2025 at 3:57 PM
1//This thread is going to cover some findings from the first dedicated CCAF mining survey, which I co-authored with Alex Neumueller, @kmohaddes.bsky.social, Valentin Rosseau, and Bryan Zhang. I’m going to try and make it accessible to people who may only have a vague sense of what crypto-mining is.

26// In 1962, 11% of primary goods (ex: ores) were traded on an intra-industry basis. By 2006 it’s about 23%. Final goods (ex: cars) had intra-industry trade of 23%, and are now about 45%. Intra-industry trade in intermediates rose from about 26% to 55%.
Intra-industry trade has more doubled!
Intra-industry trade has more doubled!

April 13, 2025 at 4:53 PM
26// In 1962, 11% of primary goods (ex: ores) were traded on an intra-industry basis. By 2006 it’s about 23%. Final goods (ex: cars) had intra-industry trade of 23%, and are now about 45%. Intra-industry trade in intermediates rose from about 26% to 55%.
Intra-industry trade has more doubled!
Intra-industry trade has more doubled!
24// These days, some of the trade originates in the different car brands targeting consumer tastes (Mercedes vs. Ford), and others are due to trade in intermediate goods and processes (parts, paint, etc.).

April 13, 2025 at 4:53 PM
24// These days, some of the trade originates in the different car brands targeting consumer tastes (Mercedes vs. Ford), and others are due to trade in intermediate goods and processes (parts, paint, etc.).
22// In these classic models, trade is interindustry – countries export and import different goods. But what if countries import and export the same good - like Germany and USA with cars? A classic century-old trade model can capture int*er*-industry trade, but not int*ra*-industry trade.

April 13, 2025 at 4:53 PM
22// In these classic models, trade is interindustry – countries export and import different goods. But what if countries import and export the same good - like Germany and USA with cars? A classic century-old trade model can capture int*er*-industry trade, but not int*ra*-industry trade.
8// In 2010 the iPhone 3G only got 3.6% of its $178.96 manufacturing value from China! The US contributed 6%, & Japan 34%.
Instead of the “headline” $1.9 billion export value of iPhone's from China, if you adjust for value-added China actually *imported* $48 mil of iPhones. The other direction!
Instead of the “headline” $1.9 billion export value of iPhone's from China, if you adjust for value-added China actually *imported* $48 mil of iPhones. The other direction!

April 13, 2025 at 4:53 PM
8// In 2010 the iPhone 3G only got 3.6% of its $178.96 manufacturing value from China! The US contributed 6%, & Japan 34%.
Instead of the “headline” $1.9 billion export value of iPhone's from China, if you adjust for value-added China actually *imported* $48 mil of iPhones. The other direction!
Instead of the “headline” $1.9 billion export value of iPhone's from China, if you adjust for value-added China actually *imported* $48 mil of iPhones. The other direction!
7// A great example of this can be seen in the iPhone. A lot of the value of the iPhone comes from design and software, and advertising - and that is not made in China!
Here’s an old (2010) image from the Atlantic that shows the breakdown: www.theatlantic.com/business/arc...
Here’s an old (2010) image from the Atlantic that shows the breakdown: www.theatlantic.com/business/arc...

April 13, 2025 at 4:53 PM
7// A great example of this can be seen in the iPhone. A lot of the value of the iPhone comes from design and software, and advertising - and that is not made in China!
Here’s an old (2010) image from the Atlantic that shows the breakdown: www.theatlantic.com/business/arc...
Here’s an old (2010) image from the Atlantic that shows the breakdown: www.theatlantic.com/business/arc...