


František Bartoš
@fbartos.bsky.social
PhD Candidate | Psychological Methods | UvA Amsterdam | interested in statistics, meta-analysis, and publication bias | once flipped a coin too many times
We developed PublicationBiasBenchmark R package (github.com/FBartos/Publ...) that can be easily extended with new methods and measures. It also automatically generates a webpage with summary reports (fbartos.github.io/PublicationB...). All the raw data, results, and measures are available on OSF.

October 23, 2025 at 4:02 PM
We developed PublicationBiasBenchmark R package (github.com/FBartos/Publ...) that can be easily extended with new methods and measures. It also automatically generates a webpage with summary reports (fbartos.github.io/PublicationB...). All the raw data, results, and measures are available on OSF.
Our proposal addresses other issues of current simulation studies (incomparability, irreproducibility...).
We demonstrate the living synthetic benchmark methodology on the publication bias adjustment literature. See how previous simulations use different methods and measures.
We demonstrate the living synthetic benchmark methodology on the publication bias adjustment literature. See how previous simulations use different methods and measures.

October 23, 2025 at 4:02 PM
Our proposal addresses other issues of current simulation studies (incomparability, irreproducibility...).
We demonstrate the living synthetic benchmark methodology on the publication bias adjustment literature. See how previous simulations use different methods and measures.
We demonstrate the living synthetic benchmark methodology on the publication bias adjustment literature. See how previous simulations use different methods and measures.
We want to separate those two steps.
New simulations should be published without new methods. Instead, they should evaluate all existing methods.
New methods should be published without new simulations. Instead, they should be assessed on all existing simulations.
New simulations should be published without new methods. Instead, they should evaluate all existing methods.
New methods should be published without new simulations. Instead, they should be assessed on all existing simulations.

October 23, 2025 at 4:02 PM
We want to separate those two steps.
New simulations should be published without new methods. Instead, they should evaluate all existing methods.
New methods should be published without new simulations. Instead, they should be assessed on all existing simulations.
New simulations should be published without new methods. Instead, they should evaluate all existing methods.
New methods should be published without new simulations. Instead, they should be assessed on all existing simulations.
Simulation studies have a conflict of interest problem. The same team:
- develops a new method
- designs a simulation study to evaluate it
However, the new method has to show good performance to get published.
We propose living synthetic benchmarks to address the issue (doi.org/10.48550/arX...).
- develops a new method
- designs a simulation study to evaluate it
However, the new method has to show good performance to get published.
We propose living synthetic benchmarks to address the issue (doi.org/10.48550/arX...).

October 23, 2025 at 4:02 PM
Simulation studies have a conflict of interest problem. The same team:
- develops a new method
- designs a simulation study to evaluate it
However, the new method has to show good performance to get published.
We propose living synthetic benchmarks to address the issue (doi.org/10.48550/arX...).
- develops a new method
- designs a simulation study to evaluate it
However, the new method has to show good performance to get published.
We propose living synthetic benchmarks to address the issue (doi.org/10.48550/arX...).
Can anyone point me to the simulation studies showing that p-curve performs well under realistic conditions? And any done by someone else than pcurve authors? As far as I know, p-curve fails horrendously as long as any heterogeneity is involved...
doi.org/10.1177/1745...
doi.org/10.1002/jrsm...
doi.org/10.1177/1745...
doi.org/10.1002/jrsm...


September 24, 2025 at 6:51 AM
Can anyone point me to the simulation studies showing that p-curve performs well under realistic conditions? And any done by someone else than pcurve authors? As far as I know, p-curve fails horrendously as long as any heterogeneity is involved...
doi.org/10.1177/1745...
doi.org/10.1002/jrsm...
doi.org/10.1177/1745...
doi.org/10.1002/jrsm...
We derive posterior predictive distributions for many meta-analytic models. Importantly, meta-analytic models that ignore these discontinuities misfit the data and should not be used for inference; models that respect them provide a better basis for inference.
(see a couple of examples attached)
(see a couple of examples attached)


September 10, 2025 at 9:42 AM
We derive posterior predictive distributions for many meta-analytic models. Importantly, meta-analytic models that ignore these discontinuities misfit the data and should not be used for inference; models that respect them provide a better basis for inference.
(see a couple of examples attached)
(see a couple of examples attached)
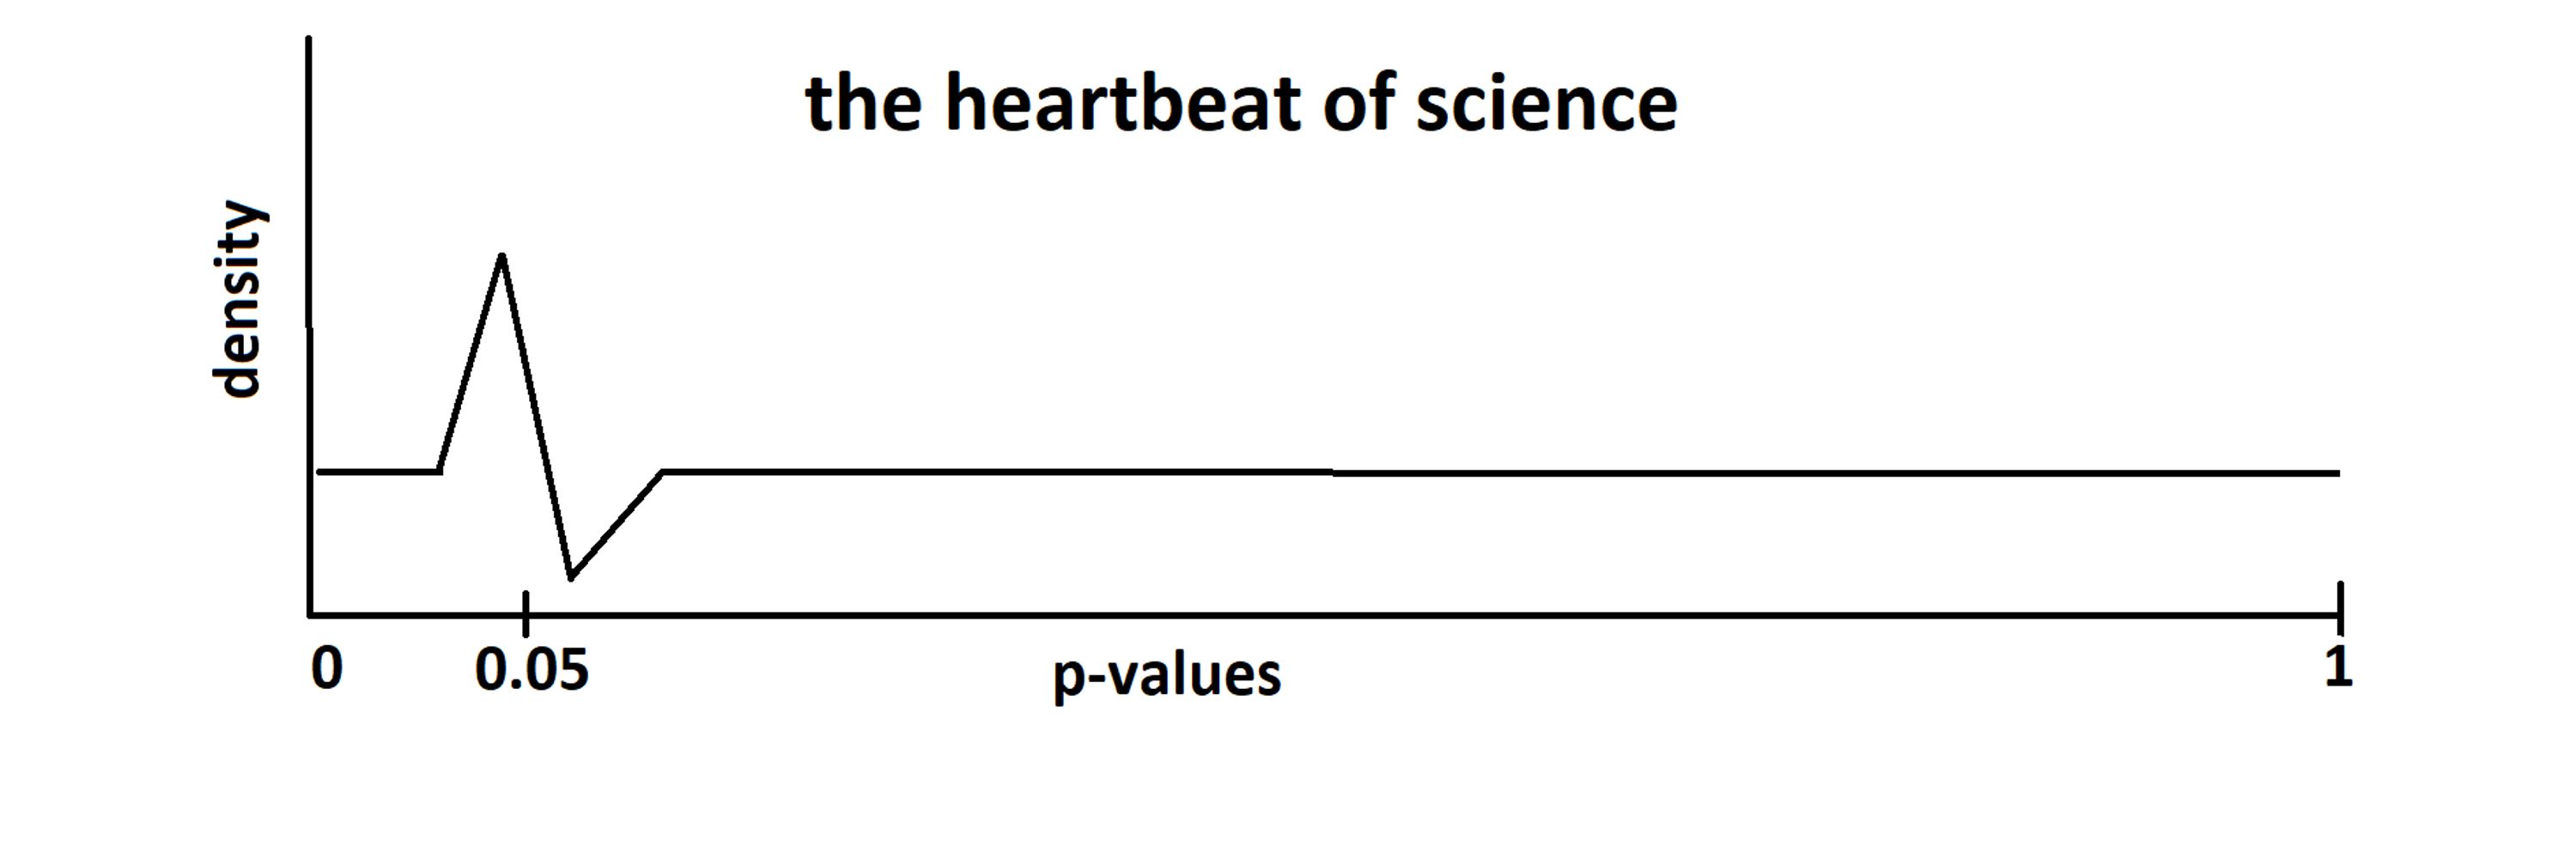
Publication bias is usually indicated by sharp discontinuities—typically at the significance threshold (selection for significance) or at zero (selection for positive results).
Similar plots are often used in metaresearch, we bring them to meta-analysis!
Similar plots are often used in metaresearch, we bring them to meta-analysis!

September 10, 2025 at 9:42 AM
Publication bias is usually indicated by sharp discontinuities—typically at the significance threshold (selection for significance) or at zero (selection for positive results).
Similar plots are often used in metaresearch, we bring them to meta-analysis!
Similar plots are often used in metaresearch, we bring them to meta-analysis!
Z-curve plot is a new visual model fit diagnostic for #metaanalysis with an emphasis on #publicationbias. In contrast to funnel plots, z-curve plots
- visualize the distribution of z-statistics (where bias usually occurs)
- compare the fit of multiple models simultaneously
- visualize the distribution of z-statistics (where bias usually occurs)
- compare the fit of multiple models simultaneously

September 10, 2025 at 9:42 AM
Z-curve plot is a new visual model fit diagnostic for #metaanalysis with an emphasis on #publicationbias. In contrast to funnel plots, z-curve plots
- visualize the distribution of z-statistics (where bias usually occurs)
- compare the fit of multiple models simultaneously
- visualize the distribution of z-statistics (where bias usually occurs)
- compare the fit of multiple models simultaneously
Publication bias is usually indicated by sharp discontinuities—typically at the significance threshold (selection for significance) or at zero (selection for positive results).
Similar plots are often used in metaresearch, we bring them to meta-analysis!
Similar plots are often used in metaresearch, we bring them to meta-analysis!
September 10, 2025 at 9:39 AM
Publication bias is usually indicated by sharp discontinuities—typically at the significance threshold (selection for significance) or at zero (selection for positive results).
Similar plots are often used in metaresearch, we bring them to meta-analysis!
Similar plots are often used in metaresearch, we bring them to meta-analysis!
Importantly, there are considerable differences in the degree of the same-side bias between our coauthor-participants. As the previous figure suggests, people can differ by 1-2%.
Further analyses showed that the bias seems to decrease over time, possibly due to practice effects.
Further analyses showed that the bias seems to decrease over time, possibly due to practice effects.

August 11, 2025 at 2:20 PM
Importantly, there are considerable differences in the degree of the same-side bias between our coauthor-participants. As the previous figure suggests, people can differ by 1-2%.
Further analyses showed that the bias seems to decrease over time, possibly due to practice effects.
Further analyses showed that the bias seems to decrease over time, possibly due to practice effects.
We found that (as the title suggests) coins flipped by humans tend to land on the same side they started. The probability of the same side (50.8%) almost exactly matches the theoretical prediction of Diaconis, Holmes, and Montgomery from 2007.

August 11, 2025 at 2:20 PM
We found that (as the title suggests) coins flipped by humans tend to land on the same side they started. The probability of the same side (50.8%) almost exactly matches the theoretical prediction of Diaconis, Holmes, and Montgomery from 2007.
Fair coins tend to land on the same side they started: evidence from 350,757 flips.
That's the title of our paper summarizing ~650 hours of coin-tossing experimentation just published in the Journal of the American Statistical Association.
doi.org/10.1080/0162...
That's the title of our paper summarizing ~650 hours of coin-tossing experimentation just published in the Journal of the American Statistical Association.
doi.org/10.1080/0162...

August 11, 2025 at 2:20 PM
Fair coins tend to land on the same side they started: evidence from 350,757 flips.
That's the title of our paper summarizing ~650 hours of coin-tossing experimentation just published in the Journal of the American Statistical Association.
doi.org/10.1080/0162...
That's the title of our paper summarizing ~650 hours of coin-tossing experimentation just published in the Journal of the American Statistical Association.
doi.org/10.1080/0162...
Tbh, third party simulations were showing issues with p-curve for quite some time-this shouldn't have come as a surprise
doi.org/10.1002/jrsm...
doi.org/10.1002/jrsm...

August 9, 2025 at 12:36 PM
Tbh, third party simulations were showing issues with p-curve for quite some time-this shouldn't have come as a surprise
doi.org/10.1002/jrsm...
doi.org/10.1002/jrsm...
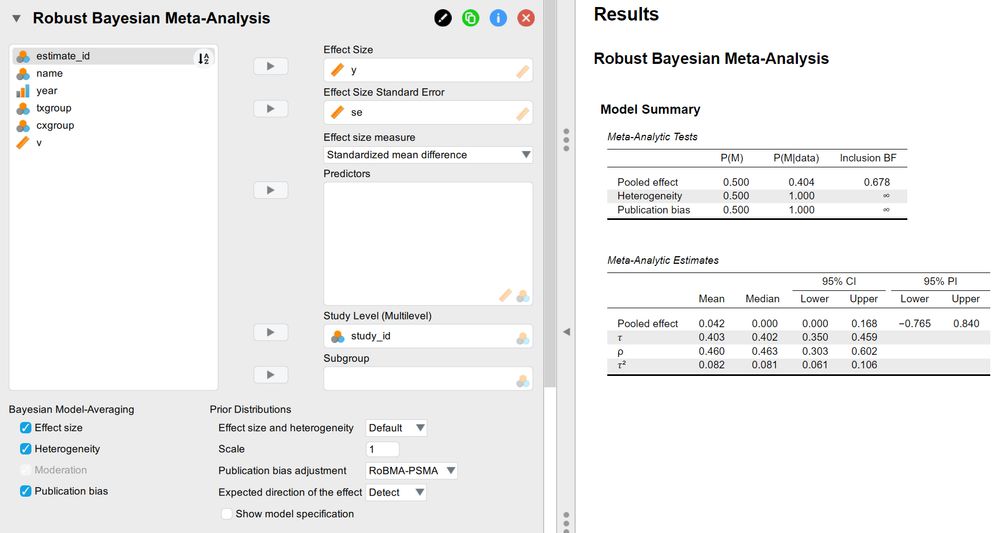
The new version of JASP (0.95) containing another significant update to the Meta-Analysis module is out.
You can perform state-of-the-art Bayesian publication bias-adjusted meta-regression in only a few clicks. A couple of additional clicks get you publication-ready figures!
You can perform state-of-the-art Bayesian publication bias-adjusted meta-regression in only a few clicks. A couple of additional clicks get you publication-ready figures!
July 28, 2025 at 1:45 PM
The new version of JASP (0.95) containing another significant update to the Meta-Analysis module is out.
You can perform state-of-the-art Bayesian publication bias-adjusted meta-regression in only a few clicks. A couple of additional clicks get you publication-ready figures!
You can perform state-of-the-art Bayesian publication bias-adjusted meta-regression in only a few clicks. A couple of additional clicks get you publication-ready figures!
It performs well in a wide range of simulation conditions and protects against reaching over-confident conclusions in the presence of model uncertainty and nested effect sizes (i.e., estimates within studies).


July 8, 2025 at 9:27 AM
It performs well in a wide range of simulation conditions and protects against reaching over-confident conclusions in the presence of model uncertainty and nested effect sizes (i.e., estimates within studies).
We finally extended robust Bayesian meta-analysis to multilevel settings. Now, you can fit 3-level publication bias-adjusted model-averaged meta-regression models in R (and in about a week in @jaspstats.bsky.social too!)
July 8, 2025 at 9:27 AM
We finally extended robust Bayesian meta-analysis to multilevel settings. Now, you can fit 3-level publication bias-adjusted model-averaged meta-regression models in R (and in about a week in @jaspstats.bsky.social too!)
In summary, we found that publication bias exaggerated the evidence in favor of SC-BCT to such a degree that once this bias is properly adjusted for, the effect disappears entirely. In fact, the data show moderate evidence against the presence of an effect.

May 21, 2025 at 8:05 PM
In summary, we found that publication bias exaggerated the evidence in favor of SC-BCT to such a degree that once this bias is properly adjusted for, the effect disappears entirely. In fact, the data show moderate evidence against the presence of an effect.
A recently published meta-analysis in Nature Human Behaviour "found evidence supporting the efficacy of social comparison as a behaviour change technique in shaping behaviour in the desired direction".
I was curious, so I re-analyzed the manuscript, but the funnel plots below say it all.
I was curious, so I re-analyzed the manuscript, but the funnel plots below say it all.


May 21, 2025 at 8:05 PM
A recently published meta-analysis in Nature Human Behaviour "found evidence supporting the efficacy of social comparison as a behaviour change technique in shaping behaviour in the desired direction".
I was curious, so I re-analyzed the manuscript, but the funnel plots below say it all.
I was curious, so I re-analyzed the manuscript, but the funnel plots below say it all.
We are running the summer JASP workshops again this year. We offer both on-site/online participation, see more details at: jasp-stats.org/workshops/

May 14, 2025 at 3:37 PM
We are running the summer JASP workshops again this year. We offer both on-site/online participation, see more details at: jasp-stats.org/workshops/
Does ChatGPT help with students' learning performance, learning perception, and higher-order thinking? We re-analyzed a recently published meta-analysis and found that the original conclusion is almost entirely driven by publication bias.

May 12, 2025 at 1:55 PM
Does ChatGPT help with students' learning performance, learning perception, and higher-order thinking? We re-analyzed a recently published meta-analysis and found that the original conclusion is almost entirely driven by publication bias.
Looking for recommendations to finish my #statistics #mugs collection!

May 1, 2025 at 10:46 AM
Looking for recommendations to finish my #statistics #mugs collection!
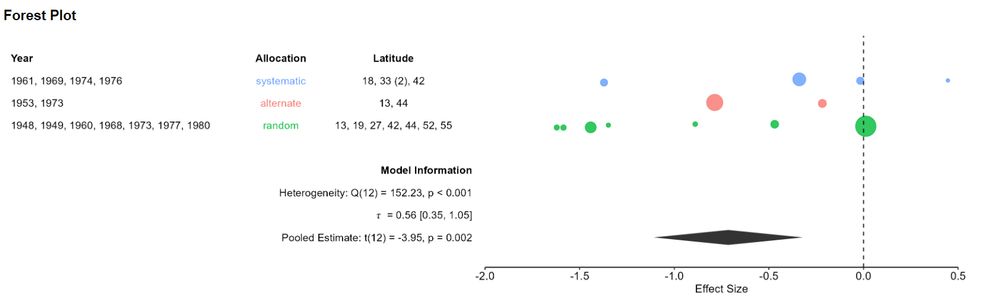
The upcoming version of @jaspstats.bsky.social is gonna feature an even better version of the meta-analysis module.
For example, the forest plot will allow aggregating effect size estimate information with just a couple click!
For example, the forest plot will allow aggregating effect size estimate information with just a couple click!


April 17, 2025 at 9:01 AM
The upcoming version of @jaspstats.bsky.social is gonna feature an even better version of the meta-analysis module.
For example, the forest plot will allow aggregating effect size estimate information with just a couple click!
For example, the forest plot will allow aggregating effect size estimate information with just a couple click!
Pretty cool! Already got a feature request to add this in JASP :)
In the meantime, you can also use Bubble Plots with categorical variables
In the meantime, you can also use Bubble Plots with categorical variables

April 8, 2025 at 1:04 PM
Pretty cool! Already got a feature request to add this in JASP :)
In the meantime, you can also use Bubble Plots with categorical variables
In the meantime, you can also use Bubble Plots with categorical variables
We are in the final phases of preparing a new update of JASP (@jaspstats.bsky.social). I'm creating examples for the completely revamped Meta-Analysis module - check out how stunning forest and funnel plots can be created with only a couple of mouse clicks!
#meta-analysis
#meta-analysis


November 16, 2024 at 5:55 PM
We are in the final phases of preparing a new update of JASP (@jaspstats.bsky.social). I'm creating examples for the completely revamped Meta-Analysis module - check out how stunning forest and funnel plots can be created with only a couple of mouse clicks!
#meta-analysis
#meta-analysis