


Erik van Nimwegen
@erikvannimwegen.bsky.social
Gene regulatory networks and genome evolution. How do single cells make up their minds?
@[email protected]
@NimwegenLab on twitter. Sorry X.
@[email protected]
@NimwegenLab on twitter. Sorry X.
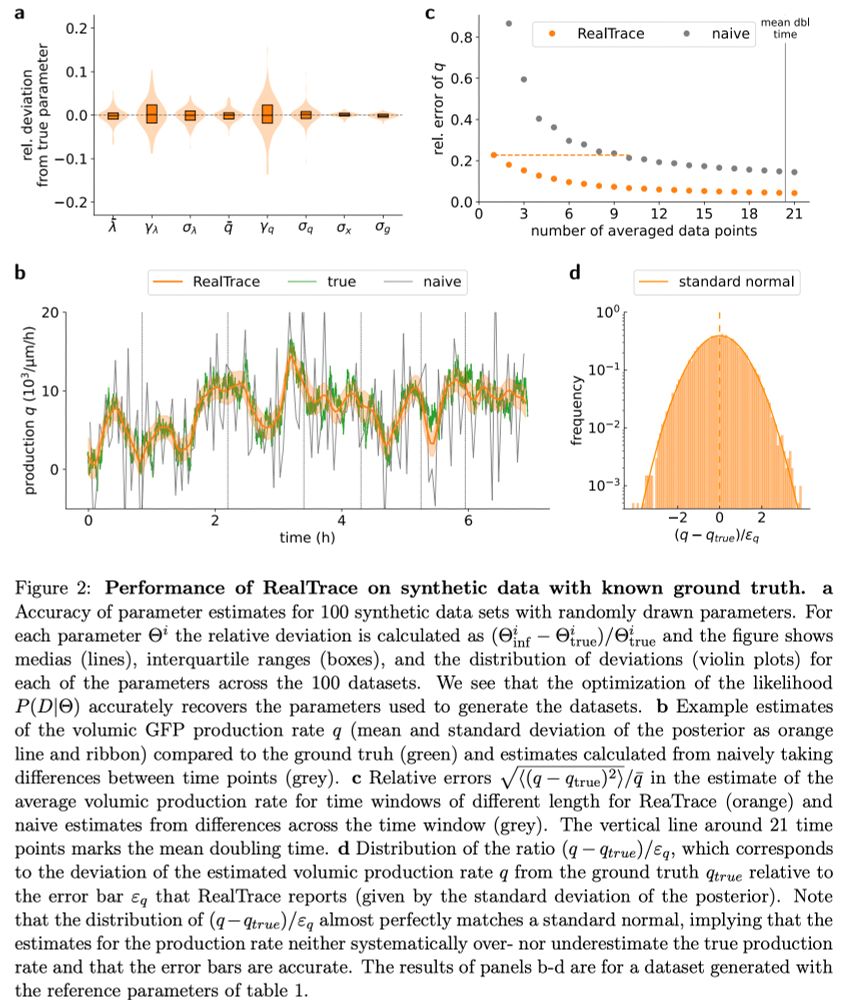
and includes accurate error-bars on all estimates.
We believe RealTrace can dramatically enhance the power of time-lapse microscopy data by allowing identification and quantification of far more subtle features in the dynamics than is possible with simple data smoothing approaches. n/n
We believe RealTrace can dramatically enhance the power of time-lapse microscopy data by allowing identification and quantification of far more subtle features in the dynamics than is possible with simple data smoothing approaches. n/n
September 17, 2025 at 2:19 PM
and includes accurate error-bars on all estimates.
We believe RealTrace can dramatically enhance the power of time-lapse microscopy data by allowing identification and quantification of far more subtle features in the dynamics than is possible with simple data smoothing approaches. n/n
We believe RealTrace can dramatically enhance the power of time-lapse microscopy data by allowing identification and quantification of far more subtle features in the dynamics than is possible with simple data smoothing approaches. n/n
Finally, upon a sudden `downshift' in nutrients, we see very reproducible time-dependent responses across single cells. All cells go almost into growth arrest, then overshoot in growth rate, only to relax to a final growth rate over a time scale of 3 cell cycles. 9/n

September 17, 2025 at 2:19 PM
Finally, upon a sudden `downshift' in nutrients, we see very reproducible time-dependent responses across single cells. All cells go almost into growth arrest, then overshoot in growth rate, only to relax to a final growth rate over a time scale of 3 cell cycles. 9/n
minimum early in the cell cycle and a maximum late in the cell cycle. In contrast, protein production rates show more complex patterns that vary across conditions and across promoters, even across constitutive promoters!
As far as we are aware, no current models can explain these patterns. 8/n
As far as we are aware, no current models can explain these patterns. 8/n

September 17, 2025 at 2:19 PM
minimum early in the cell cycle and a maximum late in the cell cycle. In contrast, protein production rates show more complex patterns that vary across conditions and across promoters, even across constitutive promoters!
As far as we are aware, no current models can explain these patterns. 8/n
As far as we are aware, no current models can explain these patterns. 8/n
We use data from E. coli cells carrying fluorescent reporters of constitutive and ribosomal genes, growing in a microfluidic device in different conditions, to highlight the kind of subtle patterns RealTrace can uncover.
First, instantaneous growth rates vary substantially across cells and 6/n
First, instantaneous growth rates vary substantially across cells and 6/n

September 17, 2025 at 2:19 PM
We use data from E. coli cells carrying fluorescent reporters of constitutive and ribosomal genes, growing in a microfluidic device in different conditions, to highlight the kind of subtle patterns RealTrace can uncover.
First, instantaneous growth rates vary substantially across cells and 6/n
First, instantaneous growth rates vary substantially across cells and 6/n
RealTrace is very generally applicable, which we demonstrate by applications to data from E. coli cells, mouse embryonic stem cell nuclei (data from the lab of @davidsuter.bsky.social), and entire C. elegans larvae (data from the lab of @betowbin.bsky.social). 5/n

September 17, 2025 at 2:19 PM
RealTrace is very generally applicable, which we demonstrate by applications to data from E. coli cells, mouse embryonic stem cell nuclei (data from the lab of @davidsuter.bsky.social), and entire C. elegans larvae (data from the lab of @betowbin.bsky.social). 5/n
are correlated on short time scales, all measurement errors are independent. We implemented this idea into a rigorous Bayesian procedure that uses maximum entropy process priors and recursively approximates the non-linear dynamics over short time intervals. 4/n

September 17, 2025 at 2:19 PM
are correlated on short time scales, all measurement errors are independent. We implemented this idea into a rigorous Bayesian procedure that uses maximum entropy process priors and recursively approximates the non-linear dynamics over short time intervals. 4/n
Paper link and graphical abstract:
journals.aps.org/prxlife/abst...
journals.aps.org/prxlife/abst...
July 18, 2025 at 9:33 PM
Paper link and graphical abstract:
journals.aps.org/prxlife/abst...
journals.aps.org/prxlife/abst...
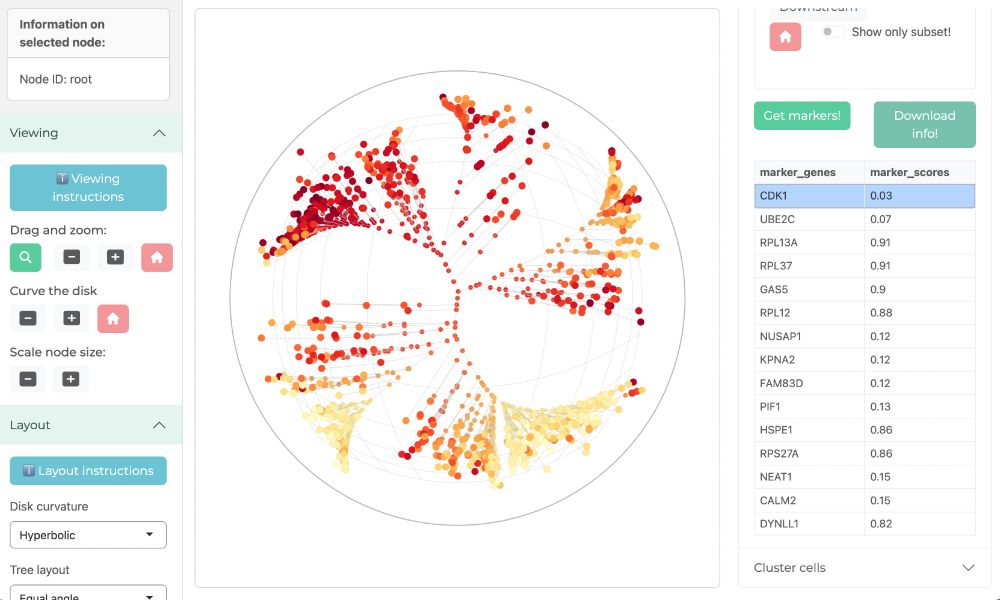
Great. I think you might find it fun to check what genes are markers of different clades. For example, I checked which genes distinguish the two clades of cells that are annotated as G2M at the top left and bottom left. Below you can see the expression of the top marker (CDK1) on the tree.
May 14, 2025 at 1:44 AM
Great. I think you might find it fun to check what genes are markers of different clades. For example, I checked which genes distinguish the two clades of cells that are annotated as G2M at the top left and bottom left. Below you can see the expression of the top marker (CDK1) on the tree.
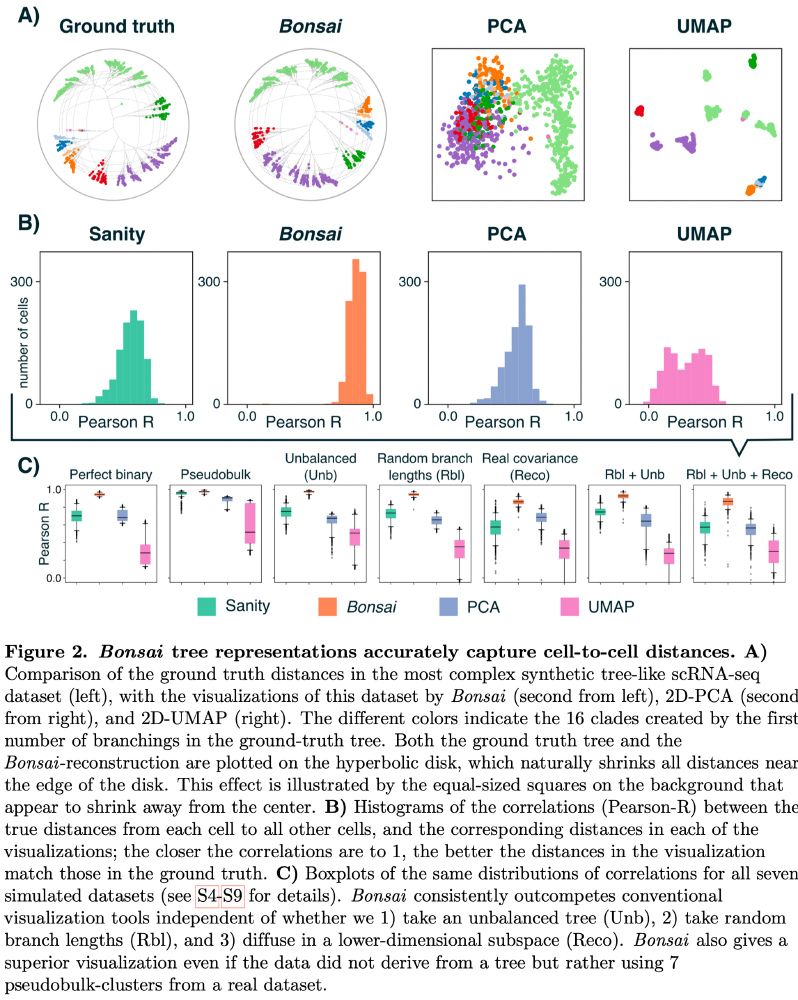
better and better at approximating the true distances. This is true for random datasets but, crucially, also for real scRNA-seq data, as we show in Fig S3.
Regarding your example, note that we do not know whether, as cells go around the cell cycle, their gene expression patterns really go around a
Regarding your example, note that we do not know whether, as cells go around the cell cycle, their gene expression patterns really go around a

May 10, 2025 at 9:05 PM
better and better at approximating the true distances. This is true for random datasets but, crucially, also for real scRNA-seq data, as we show in Fig S3.
Regarding your example, note that we do not know whether, as cells go around the cell cycle, their gene expression patterns really go around a
Regarding your example, note that we do not know whether, as cells go around the cell cycle, their gene expression patterns really go around a
Bonsai should be applicable to any high-dimensional data with continuous features. To show this, we for fun applied it to statistics of professional football players. Bonsai finds clusters of players that indeed reflect groups of players
with different roles and it is fun to see what marker features
with different roles and it is fun to see what marker features

May 9, 2025 at 10:49 AM
Bonsai should be applicable to any high-dimensional data with continuous features. To show this, we for fun applied it to statistics of professional football players. Bonsai finds clusters of players that indeed reflect groups of players
with different roles and it is fun to see what marker features
with different roles and it is fun to see what marker features
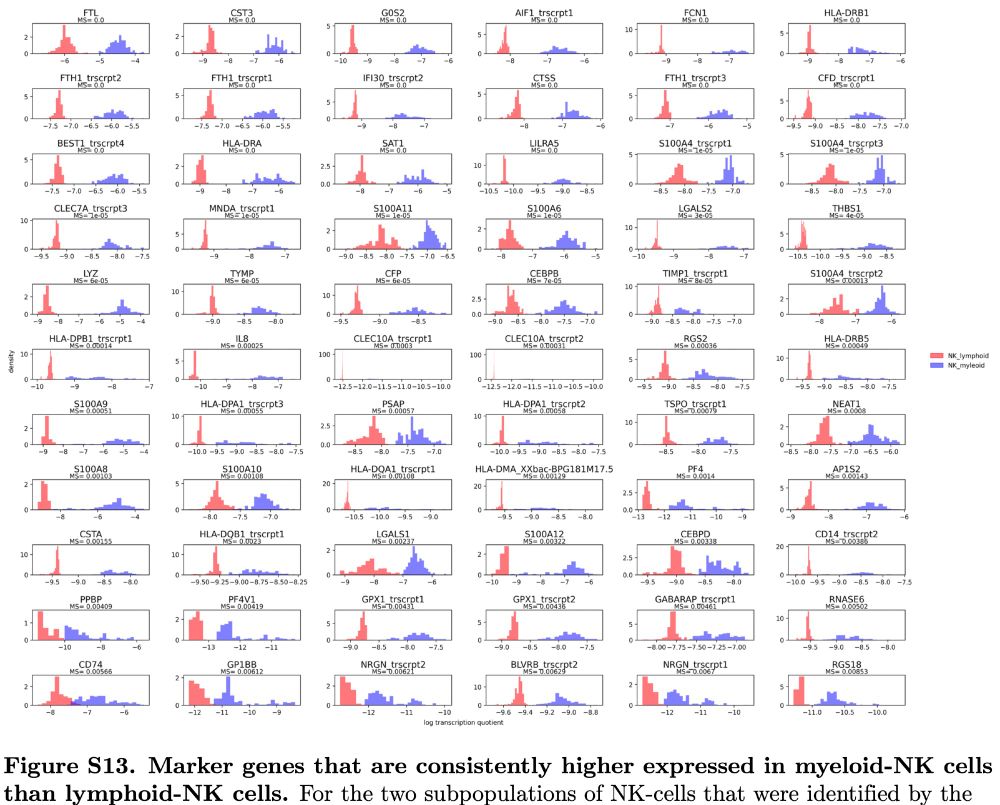
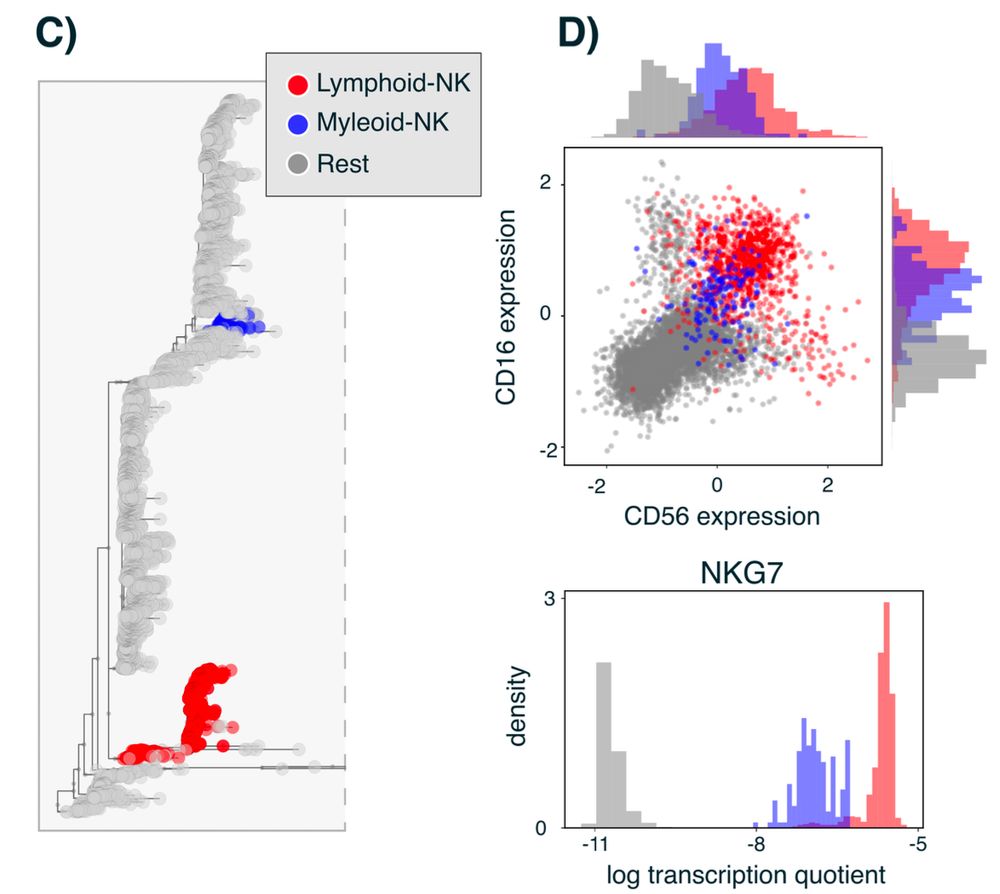
It was known that NK cells can be derived in vitro from myeloid precursors, but now Bonsai discovers that in vivo there are indeed both lymphoid and myeloid derived NK cells. Bonsai also pinpoints the marker genes that distinguish myeloid-NK from lymphoid-NK cells.

May 9, 2025 at 10:49 AM
It was known that NK cells can be derived in vitro from myeloid precursors, but now Bonsai discovers that in vivo there are indeed both lymphoid and myeloid derived NK cells. Bonsai also pinpoints the marker genes that distinguish myeloid-NK from lymphoid-NK cells.
But just inspecting the tree we immediately find novel predictions as well. For example, Bonsai finds NK cells divide into two groups: one deriving from the lymphoid lineage and one from the myeloid lineage. Indeed both groups express known NK-cell markers.
May 9, 2025 at 10:49 AM
But just inspecting the tree we immediately find novel predictions as well. For example, Bonsai finds NK cells divide into two groups: one deriving from the lymphoid lineage and one from the myeloid lineage. Indeed both groups express known NK-cell markers.
So what do we see on real data? To test Bonsai we applied it to a dataset of blood cells for which quite some lineage relationships are known. We find that the Bonsai tree automatically recovers not only the known cell types, but also the known lineage relationships between them.

May 9, 2025 at 10:49 AM
So what do we see on real data? To test Bonsai we applied it to a dataset of blood cells for which quite some lineage relationships are known. We find that the Bonsai tree automatically recovers not only the known cell types, but also the known lineage relationships between them.
@dhdegroot.bsky.social made significant efforts to make the inference computationally efficient so that we can analyze datasets with >100'000 cells. Moreover, we developed an app, Bonsai-scout, that not only visualizes the trees but also allows interactive exploratory analysis of Bonsai's results.

May 9, 2025 at 10:49 AM
@dhdegroot.bsky.social made significant efforts to make the inference computationally efficient so that we can analyze datasets with >100'000 cells. Moreover, we developed an app, Bonsai-scout, that not only visualizes the trees but also allows interactive exploratory analysis of Bonsai's results.
Now we find that Bonsai's tree representations vastly outperform even Sanity on kNN identification. Forcing the cells into a tree structure automatically regularizes the inference of gene expression states better than methods specifically designed for that task!

May 9, 2025 at 10:49 AM
Now we find that Bonsai's tree representations vastly outperform even Sanity on kNN identification. Forcing the cells into a tree structure automatically regularizes the inference of gene expression states better than methods specifically designed for that task!
Remarkably, we also find that Bonsai automatically regularizes the measurement noise in scRNA-seq data. In our previous Sanity paper (doi.org/10.1038/s41587-021-00875-x) we showed that finding true nearest-neighbor cells is actually very hard, and developed a method that outperforms other methods.

May 9, 2025 at 10:49 AM
Remarkably, we also find that Bonsai automatically regularizes the measurement noise in scRNA-seq data. In our previous Sanity paper (doi.org/10.1038/s41587-021-00875-x) we showed that finding true nearest-neighbor cells is actually very hard, and developed a method that outperforms other methods.
Here is the Bonsai visualization of a realistic dataset. In contrast to UMAP or PCA, the Bonsai tree accurately reflects the structure in the data. Not only visually, but the
correlations between the true distances and distances in the Bonsai representation are close to 1 for almost all cells.
correlations between the true distances and distances in the Bonsai representation are close to 1 for almost all cells.
May 9, 2025 at 10:49 AM
Here is the Bonsai visualization of a realistic dataset. In contrast to UMAP or PCA, the Bonsai tree accurately reflects the structure in the data. Not only visually, but the
correlations between the true distances and distances in the Bonsai representation are close to 1 for almost all cells.
correlations between the true distances and distances in the Bonsai representation are close to 1 for almost all cells.
This not only holds for random data, but for scRNA-seq data as well.
Moreover, for cells from a single organism, we KNOW that their gene expression states have actually diverged along the branches of a tree. Thus, tree representations are the most natural way of representing lineage relationships.
Moreover, for cells from a single organism, we KNOW that their gene expression states have actually diverged along the branches of a tree. Thus, tree representations are the most natural way of representing lineage relationships.

May 9, 2025 at 10:49 AM
This not only holds for random data, but for scRNA-seq data as well.
Moreover, for cells from a single organism, we KNOW that their gene expression states have actually diverged along the branches of a tree. Thus, tree representations are the most natural way of representing lineage relationships.
Moreover, for cells from a single organism, we KNOW that their gene expression states have actually diverged along the branches of a tree. Thus, tree representations are the most natural way of representing lineage relationships.
Why does this work? First, you may have heard of the curse of dimensionality, but we discovered that there is also a blessing of dimensionality: As the dimensionality of the space increases, distances between sets of points GENERICALLY get better approximated by a tree structure!

May 9, 2025 at 10:49 AM
Why does this work? First, you may have heard of the curse of dimensionality, but we discovered that there is also a blessing of dimensionality: As the dimensionality of the space increases, distances between sets of points GENERICALLY get better approximated by a tree structure!
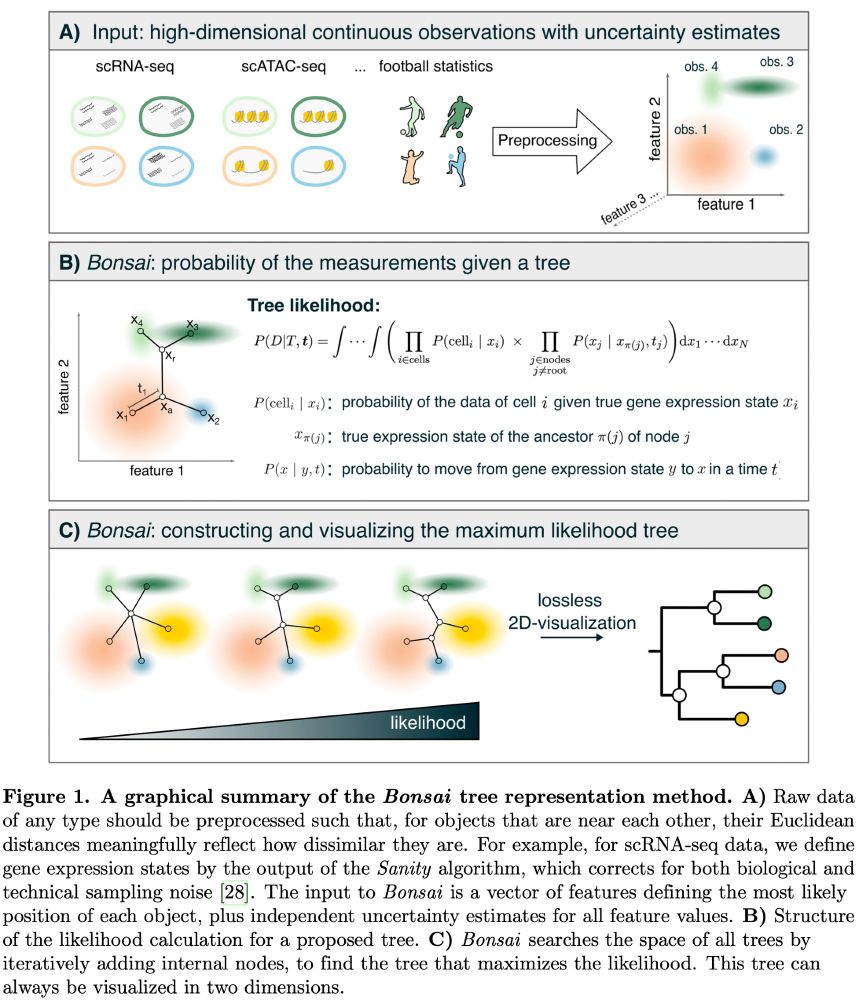
Given a dataset of estimated positions of objects in a high-dimensional space, with separate error-bars for each feature of each object, Bonsai reconstructs the most likely tree representation of the data so that the distances along the branches reflect the true distances between the objects.
May 9, 2025 at 10:49 AM
Given a dataset of estimated positions of objects in a high-dimensional space, with separate error-bars for each feature of each object, Bonsai reconstructs the most likely tree representation of the data so that the distances along the branches reflect the true distances between the objects.
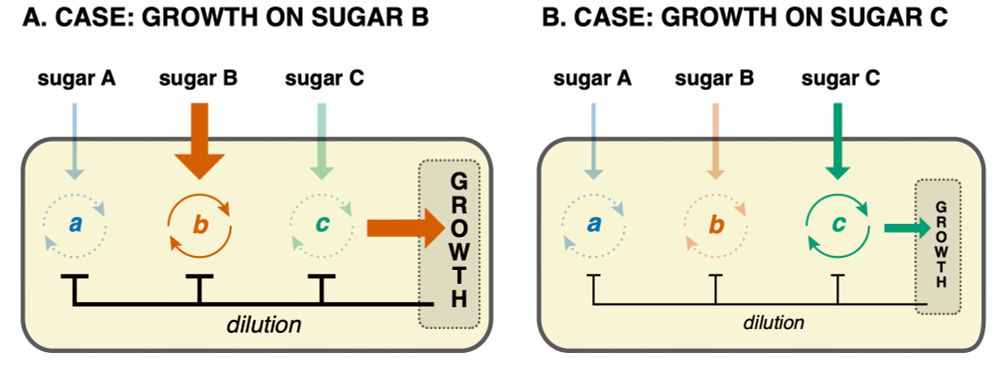
is so high that it would improve on the current growth-rate. This automatically selects out the sugar that gives highest growth-rate, because only its feedback loop is super-critical.
I think all this just scratches the surface of how growth-rate, through setting dilution rate,
I think all this just scratches the surface of how growth-rate, through setting dilution rate,
April 29, 2025 at 1:28 PM
is so high that it would improve on the current growth-rate. This automatically selects out the sugar that gives highest growth-rate, because only its feedback loop is super-critical.
I think all this just scratches the surface of how growth-rate, through setting dilution rate,
I think all this just scratches the surface of how growth-rate, through setting dilution rate,
grows faster.
And that's exactly what we see!
What I find so elegant about this picture of sugar preference regulation is that it requires no cross-regulation between different circuits. Each circuit has its own positive feedback loop that only goes critical if the corresponding sugar concentration
And that's exactly what we see!
What I find so elegant about this picture of sugar preference regulation is that it requires no cross-regulation between different circuits. Each circuit has its own positive feedback loop that only goes critical if the corresponding sugar concentration

April 29, 2025 at 1:28 PM
grows faster.
And that's exactly what we see!
What I find so elegant about this picture of sugar preference regulation is that it requires no cross-regulation between different circuits. Each circuit has its own positive feedback loop that only goes critical if the corresponding sugar concentration
And that's exactly what we see!
What I find so elegant about this picture of sugar preference regulation is that it requires no cross-regulation between different circuits. Each circuit has its own positive feedback loop that only goes critical if the corresponding sugar concentration
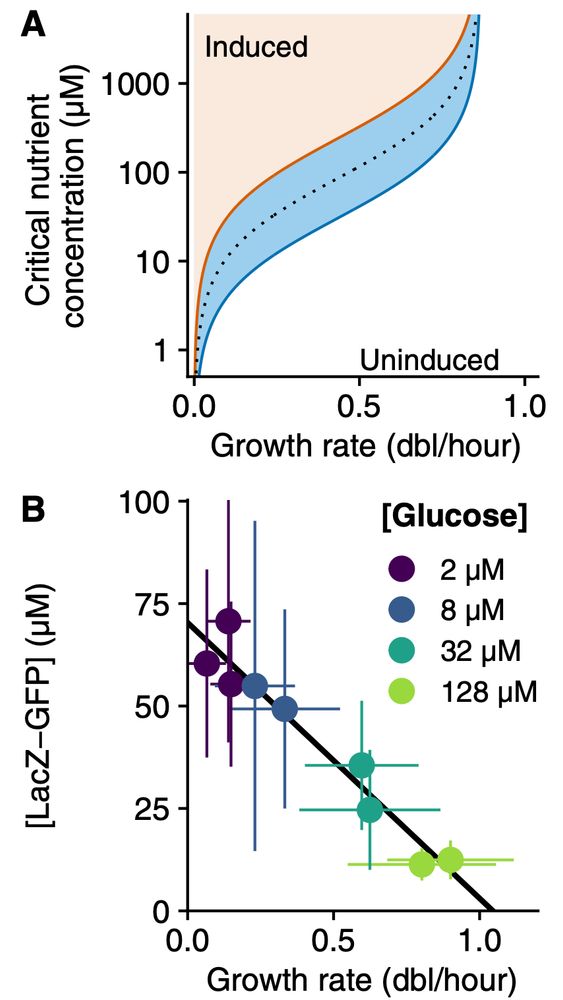
nutrient concentrations, and then grew cells in mixtures of
saturating lactose and glucose at various concentrations, down to only 2 micromolar of glucose.
These experiments confirm that cells induce their lac operon exactly when the single-cell growth rates on glucose and lactose match.
saturating lactose and glucose at various concentrations, down to only 2 micromolar of glucose.
These experiments confirm that cells induce their lac operon exactly when the single-cell growth rates on glucose and lactose match.

April 29, 2025 at 1:28 PM
nutrient concentrations, and then grew cells in mixtures of
saturating lactose and glucose at various concentrations, down to only 2 micromolar of glucose.
These experiments confirm that cells induce their lac operon exactly when the single-cell growth rates on glucose and lactose match.
saturating lactose and glucose at various concentrations, down to only 2 micromolar of glucose.
These experiments confirm that cells induce their lac operon exactly when the single-cell growth rates on glucose and lactose match.
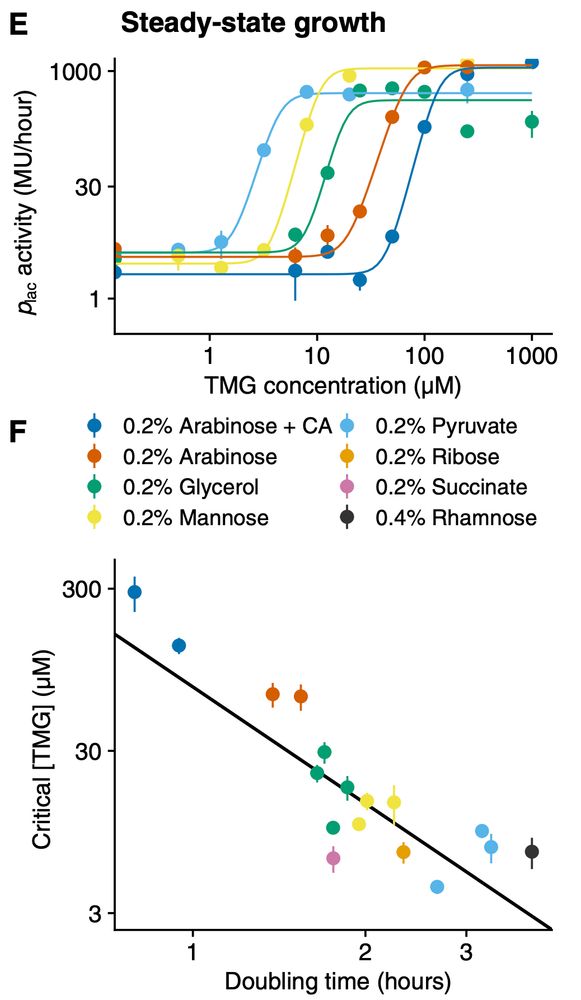
growth-rate (panel A). Remarkably, it is known that at least for the lac operon, expression at full induction indeed decreases linearly with growth rate (panel B).
To test this prediction, we adapted our microfluidic design to allow for accurate quantification of single-cell growth rates at very low
To test this prediction, we adapted our microfluidic design to allow for accurate quantification of single-cell growth rates at very low
April 29, 2025 at 1:28 PM
growth-rate (panel A). Remarkably, it is known that at least for the lac operon, expression at full induction indeed decreases linearly with growth rate (panel B).
To test this prediction, we adapted our microfluidic design to allow for accurate quantification of single-cell growth rates at very low
To test this prediction, we adapted our microfluidic design to allow for accurate quantification of single-cell growth rates at very low
experiments growing E. coli in different nutrients and inducing the lac operon with TMG show a roughly quadratic dependence on growth rate, i.e. an almost 100-fold increase in concentration between slow growth on pyruvate and fast growth on arabinose + casamino acids.
I find it almost astonishing
I find it almost astonishing
April 29, 2025 at 1:28 PM
experiments growing E. coli in different nutrients and inducing the lac operon with TMG show a roughly quadratic dependence on growth rate, i.e. an almost 100-fold increase in concentration between slow growth on pyruvate and fast growth on arabinose + casamino acids.
I find it almost astonishing
I find it almost astonishing