


EnergyDashboard
@energydashboard.bsky.social
"Built for insight. Driven by integrity."
We provide live and historical electricity data for Great Britain—covering generation, demand, carbon intensity, and generation site mapping.
We provide live and historical electricity data for Great Britain—covering generation, demand, carbon intensity, and generation site mapping.
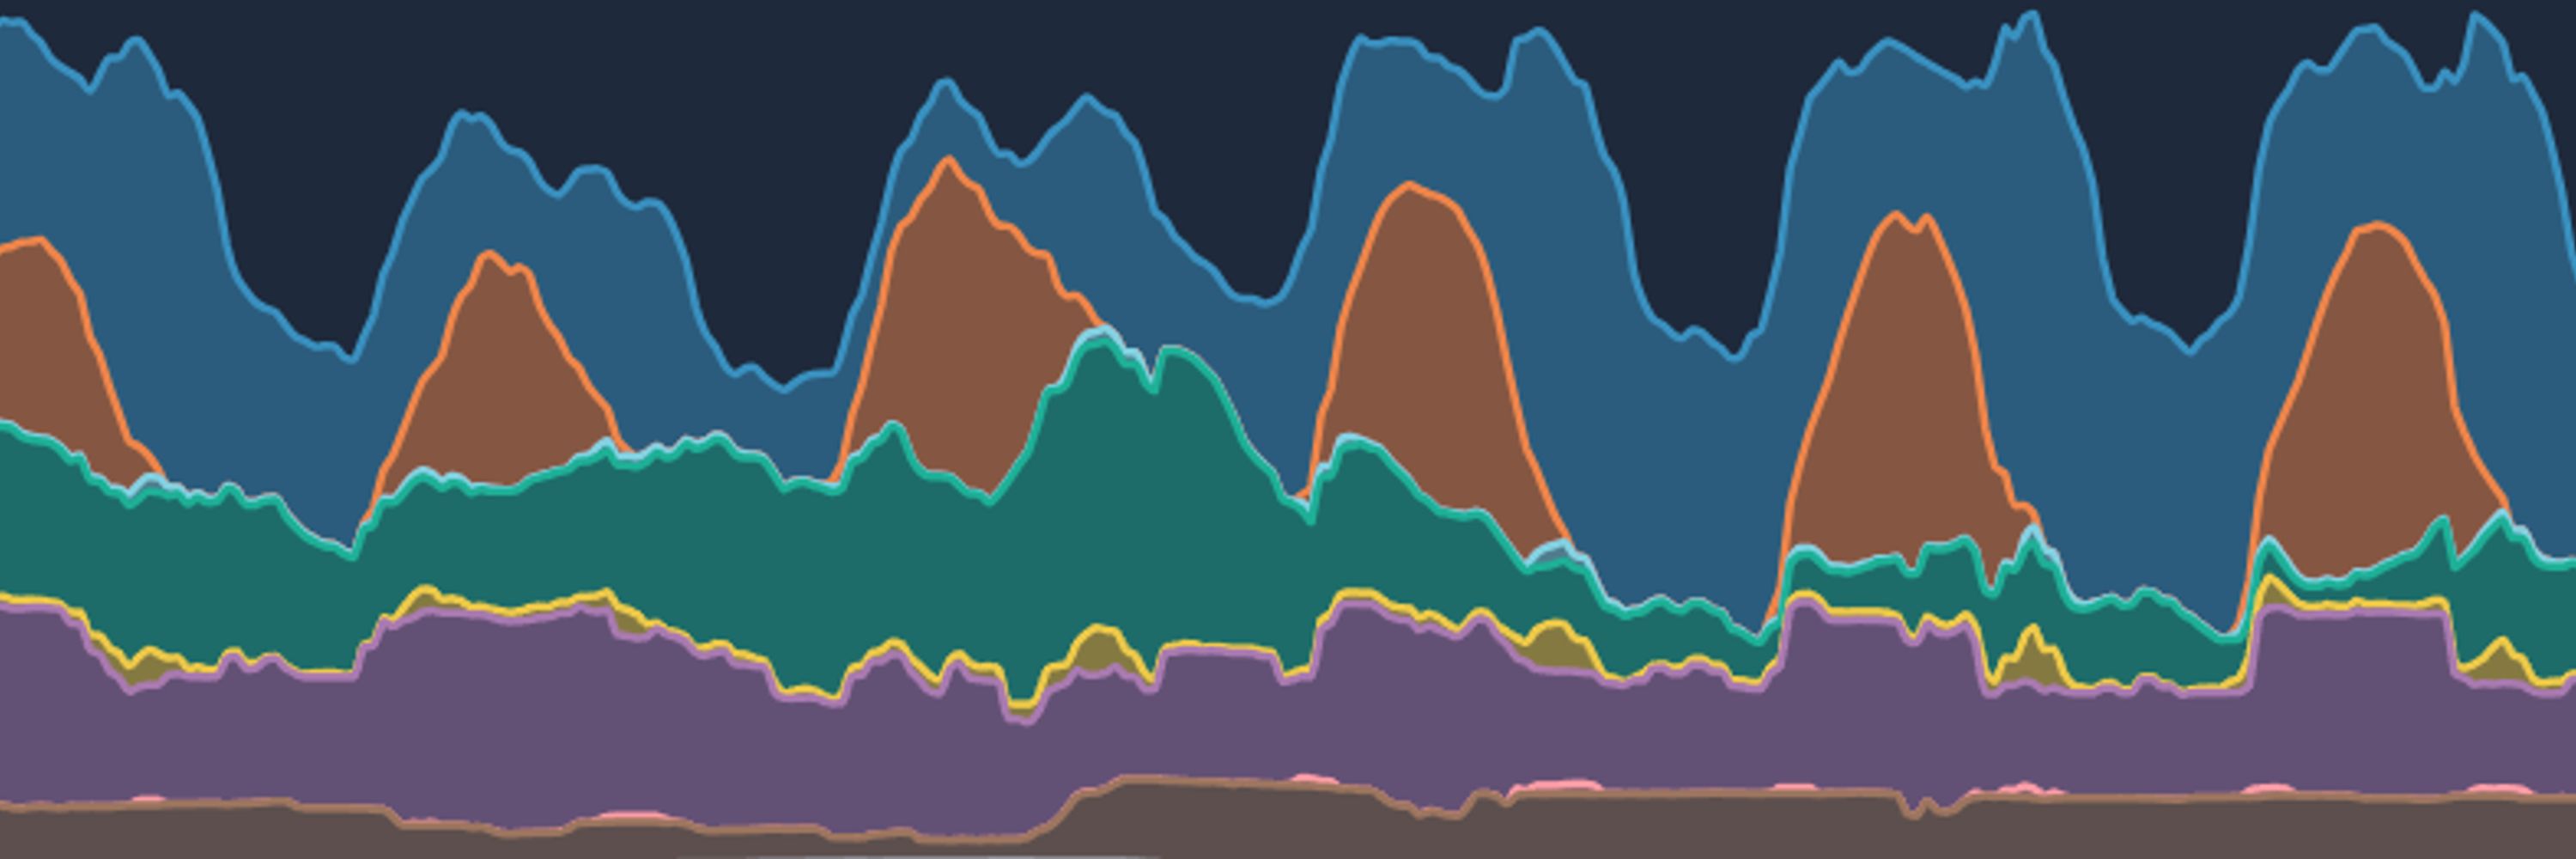
🔹 Sites spotlight: Pumped Storage Hydroelectricity🔹
Week 4 of our Sites series focuses on Pumped Storage Hydro.
You can now explore live generation charts for all operational UK sites.
energydashboard.co.uk/sites
#UKEnergy #EnergyData #PowerGeneration
Week 4 of our Sites series focuses on Pumped Storage Hydro.
You can now explore live generation charts for all operational UK sites.
energydashboard.co.uk/sites
#UKEnergy #EnergyData #PowerGeneration


January 29, 2026 at 11:24 AM
🔹 Sites spotlight: Pumped Storage Hydroelectricity🔹
Week 4 of our Sites series focuses on Pumped Storage Hydro.
You can now explore live generation charts for all operational UK sites.
energydashboard.co.uk/sites
#UKEnergy #EnergyData #PowerGeneration
Week 4 of our Sites series focuses on Pumped Storage Hydro.
You can now explore live generation charts for all operational UK sites.
energydashboard.co.uk/sites
#UKEnergy #EnergyData #PowerGeneration
🔹 Sites spotlight: Gas 🔹
Week 3 of our Sites series focuses on gas generation.
You can now explore live generation charts for individual UK gas power stations, using site-level data rather than national totals.
www.energydashboard.co.uk/sites
#UKEnergy #EnergyData #RWE
Week 3 of our Sites series focuses on gas generation.
You can now explore live generation charts for individual UK gas power stations, using site-level data rather than national totals.
www.energydashboard.co.uk/sites
#UKEnergy #EnergyData #RWE


January 22, 2026 at 12:57 PM
🔹 Sites spotlight: Gas 🔹
Week 3 of our Sites series focuses on gas generation.
You can now explore live generation charts for individual UK gas power stations, using site-level data rather than national totals.
www.energydashboard.co.uk/sites
#UKEnergy #EnergyData #RWE
Week 3 of our Sites series focuses on gas generation.
You can now explore live generation charts for individual UK gas power stations, using site-level data rather than national totals.
www.energydashboard.co.uk/sites
#UKEnergy #EnergyData #RWE
We are proud to partner with the Future of Utilities: Energy Transition Summit, Amsterdam 18–19 March 2026
Bringing together 1,600+ attendees from across Europe's energy ecosystem. Join Europe's DSO leaders shaping smart grids for the future
👉 Register here:
futureofutilities.com/events/energ...
Bringing together 1,600+ attendees from across Europe's energy ecosystem. Join Europe's DSO leaders shaping smart grids for the future
👉 Register here:
futureofutilities.com/events/energ...

January 16, 2026 at 10:57 AM
We are proud to partner with the Future of Utilities: Energy Transition Summit, Amsterdam 18–19 March 2026
Bringing together 1,600+ attendees from across Europe's energy ecosystem. Join Europe's DSO leaders shaping smart grids for the future
👉 Register here:
futureofutilities.com/events/energ...
Bringing together 1,600+ attendees from across Europe's energy ecosystem. Join Europe's DSO leaders shaping smart grids for the future
👉 Register here:
futureofutilities.com/events/energ...
Offshore wind — site-level, live data
We’ve added live output and curtailment charts for individual offshore wind farms on Energy Dashboard, including Hornsea 2, Seagreen, Dogger Bank and Gwynt y Môr.
👉 www.energydashboard.co.uk/sites
#OffshoreWind #UKEnergy #EnergyData
We’ve added live output and curtailment charts for individual offshore wind farms on Energy Dashboard, including Hornsea 2, Seagreen, Dogger Bank and Gwynt y Môr.
👉 www.energydashboard.co.uk/sites
#OffshoreWind #UKEnergy #EnergyData

January 15, 2026 at 12:17 PM
Offshore wind — site-level, live data
We’ve added live output and curtailment charts for individual offshore wind farms on Energy Dashboard, including Hornsea 2, Seagreen, Dogger Bank and Gwynt y Môr.
👉 www.energydashboard.co.uk/sites
#OffshoreWind #UKEnergy #EnergyData
We’ve added live output and curtailment charts for individual offshore wind farms on Energy Dashboard, including Hornsea 2, Seagreen, Dogger Bank and Gwynt y Môr.
👉 www.energydashboard.co.uk/sites
#OffshoreWind #UKEnergy #EnergyData
2025 looked like a record renewables year — but the system story was more complex.
Demand rose ~3%, renewables hit 37.3%, yet carbon intensity still edged up as gas remained central.
Full 2025 review 👇
www.energydashboard.co.uk/insights/202...
#UKEnergy #EnergyData
Demand rose ~3%, renewables hit 37.3%, yet carbon intensity still edged up as gas remained central.
Full 2025 review 👇
www.energydashboard.co.uk/insights/202...
#UKEnergy #EnergyData

January 12, 2026 at 2:46 PM
2025 looked like a record renewables year — but the system story was more complex.
Demand rose ~3%, renewables hit 37.3%, yet carbon intensity still edged up as gas remained central.
Full 2025 review 👇
www.energydashboard.co.uk/insights/202...
#UKEnergy #EnergyData
Demand rose ~3%, renewables hit 37.3%, yet carbon intensity still edged up as gas remained central.
Full 2025 review 👇
www.energydashboard.co.uk/insights/202...
#UKEnergy #EnergyData
We’ve added a new Sites section to Energy Dashboard.
You can now explore individual UK power stations, wind farms and solar parks, with live generation charts and location maps.
energydashboard.co.uk/sites
#UKEnergy #EnergyData
You can now explore individual UK power stations, wind farms and solar parks, with live generation charts and location maps.
energydashboard.co.uk/sites
#UKEnergy #EnergyData

January 8, 2026 at 3:05 PM
We’ve added a new Sites section to Energy Dashboard.
You can now explore individual UK power stations, wind farms and solar parks, with live generation charts and location maps.
energydashboard.co.uk/sites
#UKEnergy #EnergyData
You can now explore individual UK power stations, wind farms and solar parks, with live generation charts and location maps.
energydashboard.co.uk/sites
#UKEnergy #EnergyData
GB Wind Power Record
Between 5:30–6pm on 5 Dec 2025, wind output reached 23.8 GW, the highest half-hourly level to date — covering 47.4% of demand.
Wind’s record share remains 74.5% at 2am on 27 Oct 2025.
Live data: www.energydashboard.co.uk
#WindPower #UKEnergy #EnergyData #GBGrid #Renewables
Between 5:30–6pm on 5 Dec 2025, wind output reached 23.8 GW, the highest half-hourly level to date — covering 47.4% of demand.
Wind’s record share remains 74.5% at 2am on 27 Oct 2025.
Live data: www.energydashboard.co.uk
#WindPower #UKEnergy #EnergyData #GBGrid #Renewables
Live GB Electricity Generation, Carbon Intensity & Demand – Energy Dashboard
Real-time half-hourly data on UK electricity generation, renewable vs fossil fuel mix, power flow visualisation and carbon intensity from National Grid.
www.energydashboard.co.uk
December 8, 2025 at 10:46 AM
GB Wind Power Record
Between 5:30–6pm on 5 Dec 2025, wind output reached 23.8 GW, the highest half-hourly level to date — covering 47.4% of demand.
Wind’s record share remains 74.5% at 2am on 27 Oct 2025.
Live data: www.energydashboard.co.uk
#WindPower #UKEnergy #EnergyData #GBGrid #Renewables
Between 5:30–6pm on 5 Dec 2025, wind output reached 23.8 GW, the highest half-hourly level to date — covering 47.4% of demand.
Wind’s record share remains 74.5% at 2am on 27 Oct 2025.
Live data: www.energydashboard.co.uk
#WindPower #UKEnergy #EnergyData #GBGrid #Renewables
New GB Electricity Data Subscription now live!
Access:
🏭 Data from 300+ power plants (wind, BESS, more)
⚡ Electricity generation, demand & forecasts
🌍 Live, forecast & Historical
📆 Historical data back to 2009
🔗 www.energydashboard.co.uk/api-info/pri...
#EnergyData #Electricity #UKEnergy
Access:
🏭 Data from 300+ power plants (wind, BESS, more)
⚡ Electricity generation, demand & forecasts
🌍 Live, forecast & Historical
📆 Historical data back to 2009
🔗 www.energydashboard.co.uk/api-info/pri...
#EnergyData #Electricity #UKEnergy
June 17, 2025 at 1:47 PM
New GB Electricity Data Subscription now live!
Access:
🏭 Data from 300+ power plants (wind, BESS, more)
⚡ Electricity generation, demand & forecasts
🌍 Live, forecast & Historical
📆 Historical data back to 2009
🔗 www.energydashboard.co.uk/api-info/pri...
#EnergyData #Electricity #UKEnergy
Access:
🏭 Data from 300+ power plants (wind, BESS, more)
⚡ Electricity generation, demand & forecasts
🌍 Live, forecast & Historical
📆 Historical data back to 2009
🔗 www.energydashboard.co.uk/api-info/pri...
#EnergyData #Electricity #UKEnergy
View our live Power Flow visualisation from energydashboard.co.uk showing the electricity generation and demand across Great Britain.
🔗 Explore more data at energydashboard.co.uk/live
#EnergyDashboard #PowerFlow #GridLive #RenewableEnergy #CarbonIntensity #UKEnergy #Energy
🔗 Explore more data at energydashboard.co.uk/live
#EnergyDashboard #PowerFlow #GridLive #RenewableEnergy #CarbonIntensity #UKEnergy #Energy
May 8, 2025 at 12:36 PM
View our live Power Flow visualisation from energydashboard.co.uk showing the electricity generation and demand across Great Britain.
🔗 Explore more data at energydashboard.co.uk/live
#EnergyDashboard #PowerFlow #GridLive #RenewableEnergy #CarbonIntensity #UKEnergy #Energy
🔗 Explore more data at energydashboard.co.uk/live
#EnergyDashboard #PowerFlow #GridLive #RenewableEnergy #CarbonIntensity #UKEnergy #Energy
Big moment: @energydashboard.bsky.social is featured in the new @FT film “Are We on the Brink of a Nuclear Revival?”
Our GB electricity data helped power the story. Proud to support transparency + smarter energy decisions.
Watch: www.ft.com/video/0cc854...
🌐 Explore: www.energydashboard.co.uk/live
Our GB electricity data helped power the story. Proud to support transparency + smarter energy decisions.
Watch: www.ft.com/video/0cc854...
🌐 Explore: www.energydashboard.co.uk/live
May 8, 2025 at 12:35 PM
Big moment: @energydashboard.bsky.social is featured in the new @FT film “Are We on the Brink of a Nuclear Revival?”
Our GB electricity data helped power the story. Proud to support transparency + smarter energy decisions.
Watch: www.ft.com/video/0cc854...
🌐 Explore: www.energydashboard.co.uk/live
Our GB electricity data helped power the story. Proud to support transparency + smarter energy decisions.
Watch: www.ft.com/video/0cc854...
🌐 Explore: www.energydashboard.co.uk/live