


fixed enough generics bugs to write a generic userspace hashtable implementation in Clover :)

January 28, 2026 at 1:18 AM
fixed enough generics bugs to write a generic userspace hashtable implementation in Clover :)
ive been really relishing writing aggressively generic code lately and seeing it work first try*
*accidentally pass the test despite doing at least one illegal downcast from i64 to i32
*accidentally pass the test despite doing at least one illegal downcast from i64 to i32

January 24, 2026 at 10:52 PM
ive been really relishing writing aggressively generic code lately and seeing it work first try*
*accidentally pass the test despite doing at least one illegal downcast from i64 to i32
*accidentally pass the test despite doing at least one illegal downcast from i64 to i32
a nice consequence of UFCS is that since methods don't belong to types, the traits required by methods aren't tacitly required to instantiate the type. like how Foo here lacks a write() implementation, but we can still define both a Vec of Foo, and implement write() for other Vecs

January 22, 2026 at 7:16 PM
a nice consequence of UFCS is that since methods don't belong to types, the traits required by methods aren't tacitly required to instantiate the type. like how Foo here lacks a write() implementation, but we can still define both a Vec of Foo, and implement write() for other Vecs
okay sweet now ADL is working!!!
one of the goals of clover is that generics should really act like compile-time multimethods, so method lookup is even more permissive than C++, to the extent that multiple instantiations can be required if a function is used in multiple compile-time contexts
one of the goals of clover is that generics should really act like compile-time multimethods, so method lookup is even more permissive than C++, to the extent that multiple instantiations can be required if a function is used in multiple compile-time contexts

January 22, 2026 at 2:24 AM
okay sweet now ADL is working!!!
one of the goals of clover is that generics should really act like compile-time multimethods, so method lookup is even more permissive than C++, to the extent that multiple instantiations can be required if a function is used in multiple compile-time contexts
one of the goals of clover is that generics should really act like compile-time multimethods, so method lookup is even more permissive than C++, to the extent that multiple instantiations can be required if a function is used in multiple compile-time contexts
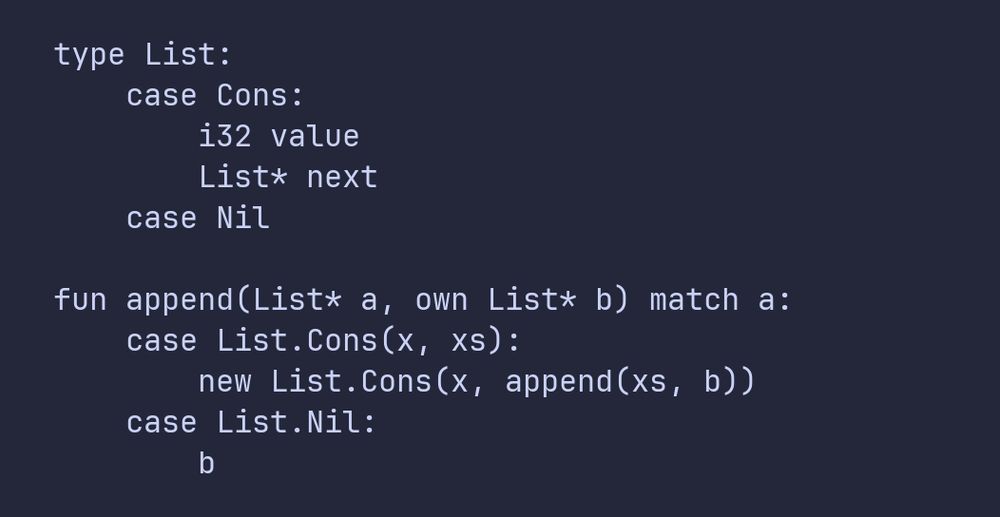
here's some more examples. i feel like being able to just write "var first, second" to define a pair is very slick, but not that useful. being able to just define a List or Vec field and implicitly make the parent type generic, however, i think feels very natural and i can see it coming up a lot

January 18, 2026 at 6:47 PM
here's some more examples. i feel like being able to just write "var first, second" to define a pair is very slick, but not that useful. being able to just define a List or Vec field and implicitly make the parent type generic, however, i think feels very natural and i can see it coming up a lot
despite my ADL-related woes i am reasonably proud of this new language feature in Clover: maximalist type inference for templates. you can freely omit type parameters in type annotations, constructors, and even the type definition itself!

January 18, 2026 at 6:33 PM
despite my ADL-related woes i am reasonably proud of this new language feature in Clover: maximalist type inference for templates. you can freely omit type parameters in type annotations, constructors, and even the type definition itself!
mischievous finding from a conversation in plcord today: zig's fancy new compiler backend - the entire point of which is to compile faster than the existing LLVM one - takes more than *twice as long* as clang -O0 in total user time 🙃
benchmark is 10k quicksort functions
clover ofc trashes both 😎
benchmark is 10k quicksort functions
clover ofc trashes both 😎

October 5, 2025 at 2:40 AM
mischievous finding from a conversation in plcord today: zig's fancy new compiler backend - the entire point of which is to compile faster than the existing LLVM one - takes more than *twice as long* as clang -O0 in total user time 🙃
benchmark is 10k quicksort functions
clover ofc trashes both 😎
benchmark is 10k quicksort functions
clover ofc trashes both 😎
an underground explorer and her vehicle come face to face with a ne'er do well

July 29, 2025 at 6:14 AM
an underground explorer and her vehicle come face to face with a ne'er do well
was compelled to draw tenna

July 15, 2025 at 5:11 AM
was compelled to draw tenna
it's so funny to me how intense the scala community is. imagine making a reality show about clang libstdc++ maintainers and buying twitter ads for it, and that the reason you would do this is to fight your personal culture war against the gcc libstdc++ maintainers. that's how scala is in real life

June 30, 2025 at 3:32 AM
it's so funny to me how intense the scala community is. imagine making a reality show about clang libstdc++ maintainers and buying twitter ads for it, and that the reason you would do this is to fight your personal culture war against the gcc libstdc++ maintainers. that's how scala is in real life
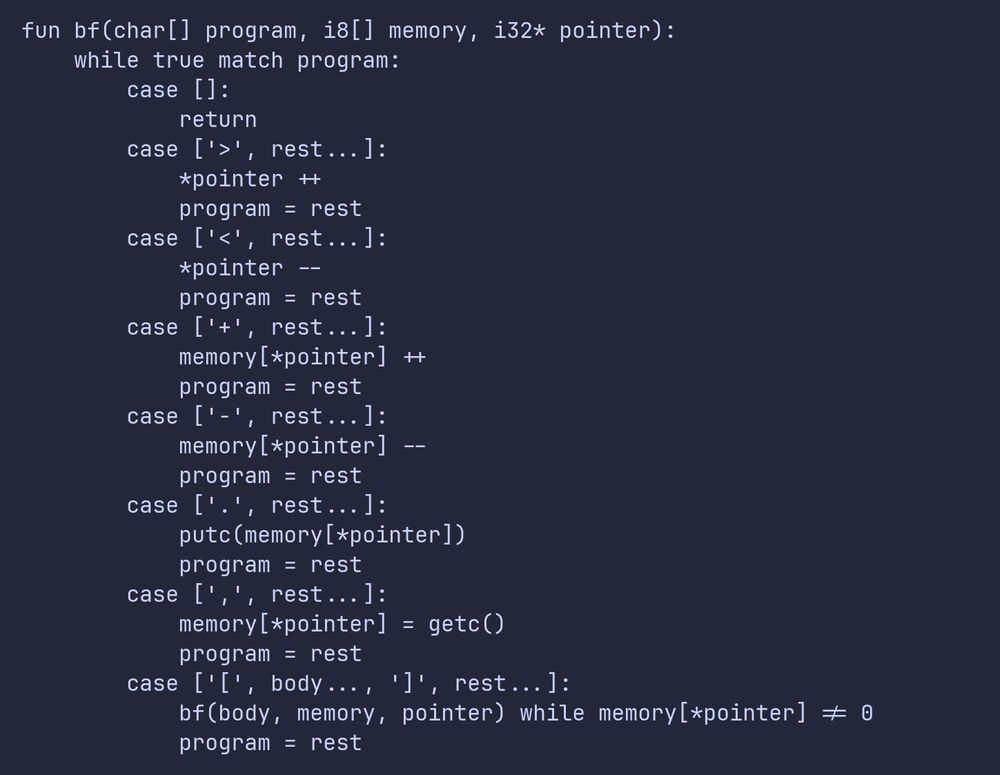
and now clover has full support for array/slice patterns too! these even support multiple splat parameters (i.e. rest..., body...) per pattern, which i used to implement this cute BF interpreter :)
June 15, 2025 at 8:55 AM
and now clover has full support for array/slice patterns too! these even support multiple splat parameters (i.e. rest..., body...) per pattern, which i used to implement this cute BF interpreter :)
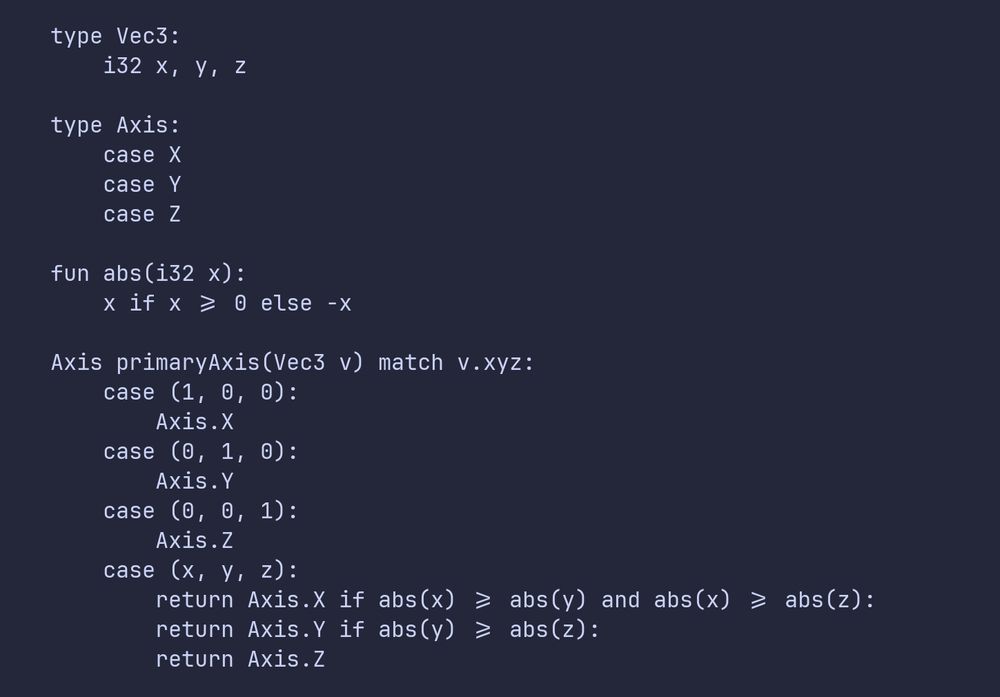
added codegen support for swizzling and tuple patterns
June 15, 2025 at 6:55 AM
added codegen support for swizzling and tuple patterns
whew. had to make a surprising number of backend changes for this, but Clover has sum types and pattern matching now :)
June 7, 2025 at 11:52 PM
whew. had to make a surprising number of backend changes for this, but Clover has sum types and pattern matching now :)

wait a fucking minute V DCE's every function even if they're public lmao??? i have to compile a shared library to get them to stick in which case it takes about 50% longer. the TinyCC component would still beat everything else but not by as huge of margins, it's about the same as codegen in clover

May 31, 2025 at 6:55 AM
wait a fucking minute V DCE's every function even if they're public lmao??? i have to compile a shared library to get them to stick in which case it takes about 50% longer. the TinyCC component would still beat everything else but not by as huge of margins, it's about the same as codegen in clover
V doing as badly as it did was also pretty surprising since my understanding is TinyCC is actually very well optimized. a quick look at its flamegraph though shows almost all the time is in the V compiler itself, in parsing of all things lol. if i tested TinyCC on its own it would beat clover by 10x

May 31, 2025 at 6:44 AM
V doing as badly as it did was also pretty surprising since my understanding is TinyCC is actually very well optimized. a quick look at its flamegraph though shows almost all the time is in the V compiler itself, in parsing of all things lol. if i tested TinyCC on its own it would beat clover by 10x
here's the memory usage over time of each process too. clang apparently also has the lowest overall memory usage?? clover is pretty close, V is off by a factor of 2, hare is in the stratosphere (this is probably why it takes so much system time)


May 31, 2025 at 6:44 AM
here's the memory usage over time of each process too. clang apparently also has the lowest overall memory usage?? clover is pretty close, V is off by a factor of 2, hare is in the stratosphere (this is probably why it takes so much system time)
one last indulgent perf comparison for today: tried this same benchmark (10k quicksort functions) in a couple other systems languages. clover wins by a lot, but honestly clang did a lot better than i thought it would

May 31, 2025 at 6:44 AM
one last indulgent perf comparison for today: tried this same benchmark (10k quicksort functions) in a couple other systems languages. clover wins by a lot, but honestly clang did a lot better than i thought it would
aaaaaand this was in fact pretty easy to optimize, it's now about 5x faster >:)

May 31, 2025 at 4:09 AM
aaaaaand this was in fact pretty easy to optimize, it's now about 5x faster >:)
did a pretty simple change and nuked the entire SCC resolution part of this lol. the compiler is now 30% more faster

May 31, 2025 at 3:50 AM
did a pretty simple change and nuked the entire SCC resolution part of this lol. the compiler is now 30% more faster
finally, the biggest shock: 24.25% of the compile time is just formatting the ELF object! and of that, 16.93% is just putting symbol definitions into a hash table! i haven't tried to optimize this at all so it's not surprising, probably a lot can be done to improve here
[10/12]
[10/12]

May 31, 2025 at 3:18 AM
finally, the biggest shock: 24.25% of the compile time is just formatting the ELF object! and of that, 16.93% is just putting symbol definitions into a hash table! i haven't tried to optimize this at all so it's not surprising, probably a lot can be done to improve here
[10/12]
[10/12]
next up is IR lowering. i collected these numbers without opts, so the bulk of the time is spent simply lowering IR instructions (8.09%) and generating assembly (6.10%). i suspect doing basic register allocation would actually improve this by reducing the instruction count
[9/12]
[9/12]

May 31, 2025 at 3:18 AM
next up is IR lowering. i collected these numbers without opts, so the bulk of the time is spent simply lowering IR instructions (8.09%) and generating assembly (6.10%). i suspect doing basic register allocation would actually improve this by reducing the instruction count
[9/12]
[9/12]
next step after typechecking (for now) is IR generation, which takes up 7.88% of total runtime. about 0.72% comes from the initial allocation of each IR function, with defining IR variables and generating conditional branches seemingly taking up a fair amount of time throughout the tree
[8/12]
[8/12]

May 31, 2025 at 3:18 AM
next step after typechecking (for now) is IR generation, which takes up 7.88% of total runtime. about 0.72% comes from the initial allocation of each IR function, with defining IR variables and generating conditional branches seemingly taking up a fair amount of time throughout the tree
[8/12]
[8/12]
now for the big stuff: 33.29% of runtime in type inference. 10.83% of this is in the initial discovery pass, 3.64% in the later refinement pass, and a shocking 14.78% just to resolve SCCs in the constraint graph! i bet this can be optimized, my data structures aren't tailored for large input
[6/12]
[6/12]

May 31, 2025 at 3:18 AM
now for the big stuff: 33.29% of runtime in type inference. 10.83% of this is in the initial discovery pass, 3.64% in the later refinement pass, and a shocking 14.78% just to resolve SCCs in the constraint graph! i bet this can be optimized, my data structures aren't tailored for large input
[6/12]
[6/12]
next we have scope resolution, which takes up 3.02% of total runtime. i'm a little surprised we spend about 1.82% of this just traversing the tree! we do another tree traversal to late-resolve access chains which accounts for another 0.44%, and i left validation on which is another 0.55%
[5/12]
[5/12]

May 31, 2025 at 3:18 AM
next we have scope resolution, which takes up 3.02% of total runtime. i'm a little surprised we spend about 1.82% of this just traversing the tree! we do another tree traversal to late-resolve access chains which accounts for another 0.44%, and i left validation on which is another 0.55%
[5/12]
[5/12]