


Dan Schroeder
@dvschroeder.bsky.social
Physicist, educator, number-cruncher. Cartoon by the great Cal Grondahl. physics.weber.edu/schroeder
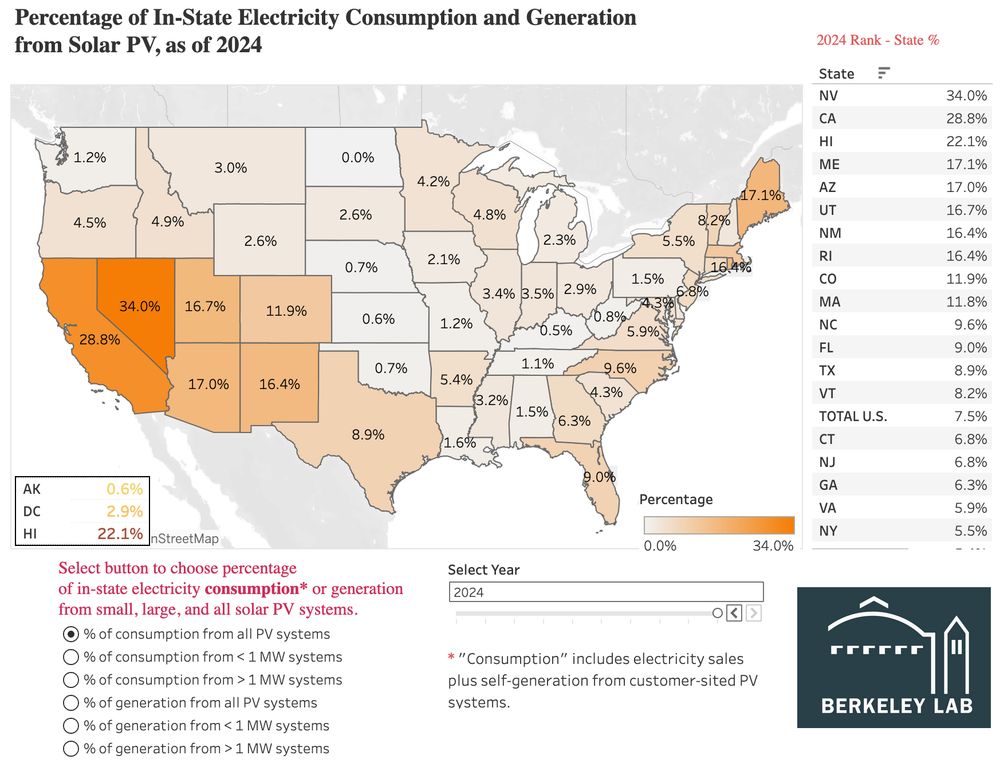
There are a whole lotta states that have disappointingly low solar adoption. I think AZ and NM are coming along, though. They're well ahead of TX, percentage-wise.
emp.lbl.gov/capacity-and...
emp.lbl.gov/capacity-and...
November 26, 2025 at 12:14 AM
There are a whole lotta states that have disappointingly low solar adoption. I think AZ and NM are coming along, though. They're well ahead of TX, percentage-wise.
emp.lbl.gov/capacity-and...
emp.lbl.gov/capacity-and...
And here's a version in which I've also changed the treatment of "unspecified imports", assuming they're entirely from fossil fuel instead of just leaving them out of the calculations. This steepens the curve because the amount that's unspecified has decreased a lot in recent years.

November 23, 2025 at 3:49 PM
And here's a version in which I've also changed the treatment of "unspecified imports", assuming they're entirely from fossil fuel instead of just leaving them out of the calculations. This steepens the curve because the amount that's unspecified has decreased a lot in recent years.
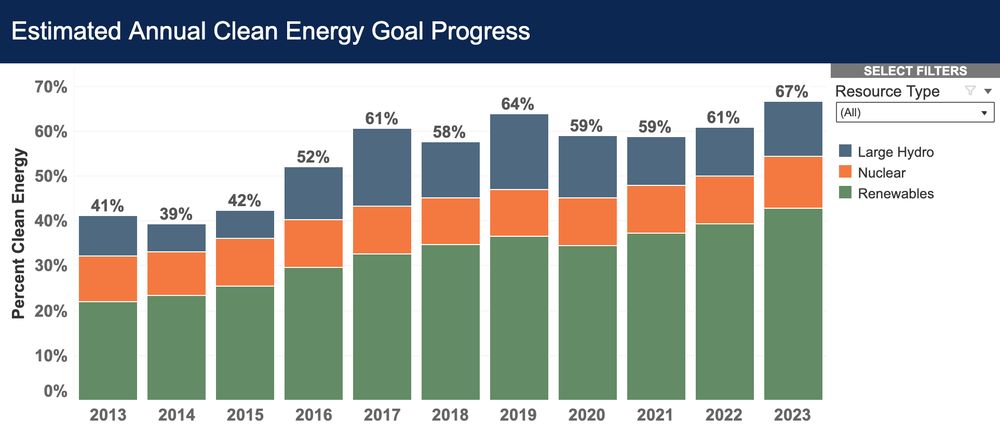
OK, here's a version in which I've swapped in Ember's numbers, which include rooftop, for California's in-state solar generation. This reproduces Bloomberg's value of 67% for 2024, but worsens the discrepancy with their 40% value for 2019.

November 23, 2025 at 3:42 PM
OK, here's a version in which I've swapped in Ember's numbers, which include rooftop, for California's in-state solar generation. This reproduces Bloomberg's value of 67% for 2024, but worsens the discrepancy with their 40% value for 2019.
Thanks! That adds more detail, and a data point for 2024. Still, doesn't corroborate the more sudden, recent jump suggested by the Bloomberg chart.

November 22, 2025 at 5:52 PM
Thanks! That adds more detail, and a data point for 2024. Still, doesn't corroborate the more sudden, recent jump suggested by the Bloomberg chart.
I'm suspicious of the vaguely sourced chart. Doesn't seem to agree with what I'm seeing at the California Energy Commission or EIA via Ember. The progress is very real but I don't think it's been that fast.

November 22, 2025 at 4:48 PM
I'm suspicious of the vaguely sourced chart. Doesn't seem to agree with what I'm seeing at the California Energy Commission or EIA via Ember. The progress is very real but I don't think it's been that fast.
Utah's Intermountain Power Plant coal unit(s) still chugging along at ~500 MW, 2/3 of the way into the month in which they were, at last report, to be shut down (and replaced with two smaller gas units). Guess we'll see what happens on December 1. 🔌💡

November 21, 2025 at 2:36 PM
Utah's Intermountain Power Plant coal unit(s) still chugging along at ~500 MW, 2/3 of the way into the month in which they were, at last report, to be shut down (and replaced with two smaller gas units). Guess we'll see what happens on December 1. 🔌💡
Let's compare the @iea.org WEO2025 electricity mix projections for 2035 to 2024.
Solar soars in all scenarios!
But even the new Stated Policies scenario projects smaller increases in wind+solar, a smaller decrease in coal, and increased gas, compared to what IEA projected last year. 🔌💡
Solar soars in all scenarios!
But even the new Stated Policies scenario projects smaller increases in wind+solar, a smaller decrease in coal, and increased gas, compared to what IEA projected last year. 🔌💡

November 13, 2025 at 8:10 PM
Let's compare the @iea.org WEO2025 electricity mix projections for 2035 to 2024.
Solar soars in all scenarios!
But even the new Stated Policies scenario projects smaller increases in wind+solar, a smaller decrease in coal, and increased gas, compared to what IEA projected last year. 🔌💡
Solar soars in all scenarios!
But even the new Stated Policies scenario projects smaller increases in wind+solar, a smaller decrease in coal, and increased gas, compared to what IEA projected last year. 🔌💡
Thank you!
@solarchase.bsky.social do you know why BNEF's numbers for the last four years are higher than IEA's? The 60 GW discrepancy for 2024 seems kinda significant.
@solarchase.bsky.social do you know why BNEF's numbers for the last four years are higher than IEA's? The 60 GW discrepancy for 2024 seems kinda significant.

November 12, 2025 at 11:51 PM
Thank you!
@solarchase.bsky.social do you know why BNEF's numbers for the last four years are higher than IEA's? The 60 GW discrepancy for 2024 seems kinda significant.
@solarchase.bsky.social do you know why BNEF's numbers for the last four years are higher than IEA's? The 60 GW discrepancy for 2024 seems kinda significant.
I can't say how much of this article is accurate, but I do know the Sierra Club never had a "singular focus on climate change".
The Club's historical mission was to "explore, enjoy, and protect" public lands. Later it took on public health issues and eventually climate—rather awkwardly.
The Club's historical mission was to "explore, enjoy, and protect" public lands. Later it took on public health issues and eventually climate—rather awkwardly.

November 7, 2025 at 6:14 PM
I can't say how much of this article is accurate, but I do know the Sierra Club never had a "singular focus on climate change".
The Club's historical mission was to "explore, enjoy, and protect" public lands. Later it took on public health issues and eventually climate—rather awkwardly.
The Club's historical mission was to "explore, enjoy, and protect" public lands. Later it took on public health issues and eventually climate—rather awkwardly.
Looks like both of the incumbents have lost to their challengers in the Ogden city-wide council races—despite endorsements from the mayor and what's left of the local paper. Hard to say exactly why, but I'm glad we'll have some younger voices adding fresh perspectives.

November 5, 2025 at 12:09 PM
Looks like both of the incumbents have lost to their challengers in the Ogden city-wide council races—despite endorsements from the mayor and what's left of the local paper. Hard to say exactly why, but I'm glad we'll have some younger voices adding fresh perspectives.
They paved paradise and put up a parking lot.

November 3, 2025 at 4:55 AM
They paved paradise and put up a parking lot.
Interesting patterns in this map of under-construction solar farms. 🔌💡 seia.org/research-res...

October 31, 2025 at 11:36 PM
Interesting patterns in this map of under-construction solar farms. 🔌💡 seia.org/research-res...
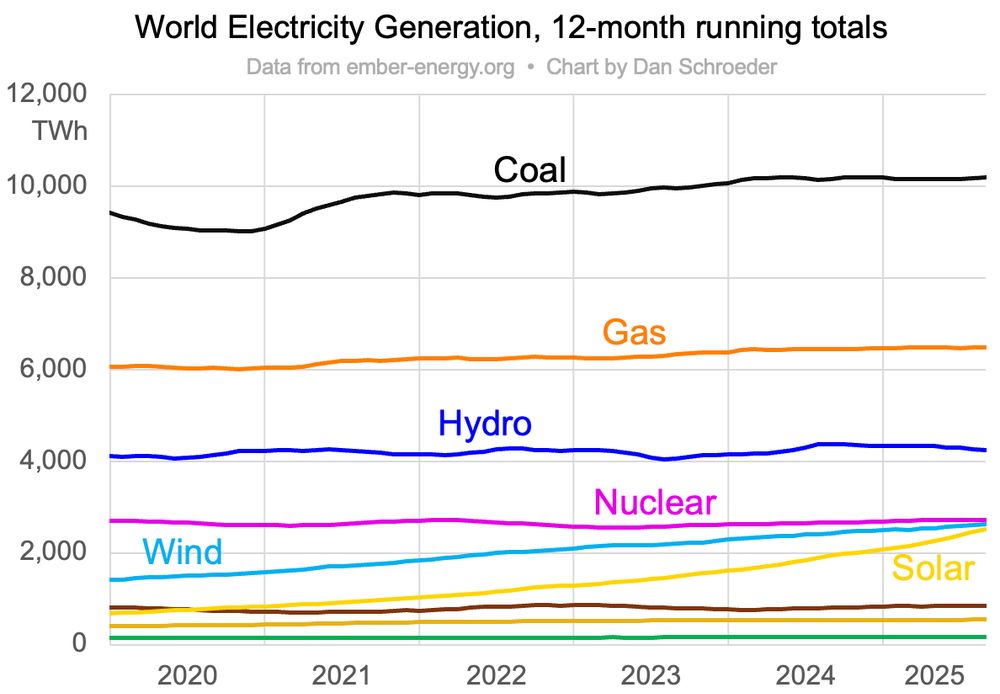
The three-way convergence approaches!
12-month world totals as of August 2025:
Nuclear 9.0%
Wind 8.7%
Solar 8.3%
Thanks to @ember-energy.org for the data update! 🔌💡☢️🌬️🌞
12-month world totals as of August 2025:
Nuclear 9.0%
Wind 8.7%
Solar 8.3%
Thanks to @ember-energy.org for the data update! 🔌💡☢️🌬️🌞
October 25, 2025 at 2:34 PM
The three-way convergence approaches!
12-month world totals as of August 2025:
Nuclear 9.0%
Wind 8.7%
Solar 8.3%
Thanks to @ember-energy.org for the data update! 🔌💡☢️🌬️🌞
12-month world totals as of August 2025:
Nuclear 9.0%
Wind 8.7%
Solar 8.3%
Thanks to @ember-energy.org for the data update! 🔌💡☢️🌬️🌞
So for now, you can charge the battery but not discharge it? How can this be right—or what am I missing?

October 21, 2025 at 2:53 PM
So for now, you can charge the battery but not discharge it? How can this be right—or what am I missing?
Here's a little more about the buffer and BNEF's methodology, from the 2021 version of this thread. x.com/solar_chase/...

October 21, 2025 at 2:08 PM
Here's a little more about the buffer and BNEF's methodology, from the 2021 version of this thread. x.com/solar_chase/...
Interesting changes in the BNEF PV installations projection (right), relative to last year's version (left).


October 20, 2025 at 8:58 PM
Interesting changes in the BNEF PV installations projection (right), relative to last year's version (left).
Regarding nuclear and geothermal, it's now nearly 18 months since @jigarshahdc.bsky.social said this. I'm not sure what qualifies as an announcement, but my gut tells me both technologies are overhyped, at least in the US.

October 16, 2025 at 6:17 PM
Regarding nuclear and geothermal, it's now nearly 18 months since @jigarshahdc.bsky.social said this. I'm not sure what qualifies as an announcement, but my gut tells me both technologies are overhyped, at least in the US.
Looks they're actually at nearly 42% for the most recent 9 months. Must've had a bunch of anomalous weather in May-July 2024.


October 7, 2025 at 6:03 PM
Looks they're actually at nearly 42% for the most recent 9 months. Must've had a bunch of anomalous weather in May-July 2024.
Ember estimates that US hydropower generation in September was the lowest of any calendar month since at least 2001. 🔌💡

October 3, 2025 at 8:01 PM
Ember estimates that US hydropower generation in September was the lowest of any calendar month since at least 2001. 🔌💡
I find it so discouraging to look at this map and see how little renewable energy is under construction in the northeastern states. What are y'all waiting for? At least here in Utah we can blame it on the Republicans.

October 3, 2025 at 1:34 PM
I find it so discouraging to look at this map and see how little renewable energy is under construction in the northeastern states. What are y'all waiting for? At least here in Utah we can blame it on the Republicans.
Thank you!
Interesting that the new gas units are a few months behind schedule.
If I'm interpreting this chart correctly, IPP is still putting out a steady 200MW of coal-fired power.
I'm still puzzled about where the electricity for making hydrogen by Q2 2026 is supposed to come from.
Interesting that the new gas units are a few months behind schedule.
If I'm interpreting this chart correctly, IPP is still putting out a steady 200MW of coal-fired power.
I'm still puzzled about where the electricity for making hydrogen by Q2 2026 is supposed to come from.

October 2, 2025 at 4:50 PM
Thank you!
Interesting that the new gas units are a few months behind schedule.
If I'm interpreting this chart correctly, IPP is still putting out a steady 200MW of coal-fired power.
I'm still puzzled about where the electricity for making hydrogen by Q2 2026 is supposed to come from.
Interesting that the new gas units are a few months behind schedule.
If I'm interpreting this chart correctly, IPP is still putting out a steady 200MW of coal-fired power.
I'm still puzzled about where the electricity for making hydrogen by Q2 2026 is supposed to come from.
You jumped into this thread in response to my criticism of MZJ, who cranks out paper after paper modeling hypothetical allegedly low-cost 100% WWS energy systems all around the world. To bolster the credibility of this work, he regularly tweets about places like Denmark and South Dakota.


September 26, 2025 at 9:47 PM
You jumped into this thread in response to my criticism of MZJ, who cranks out paper after paper modeling hypothetical allegedly low-cost 100% WWS energy systems all around the world. To bolster the credibility of this work, he regularly tweets about places like Denmark and South Dakota.
Just learned that Peter Scott, prof. emeritus of physics at UCSC, died last Oct. at 91. In the 1970s he and William Burke wrote an unpublished text booklet called Special Relativity Primer. I got my hands on a copy in 1981 and couldn't put it down. RIP. #iTeachPhysics web.archive.org/web/20250504...

September 12, 2025 at 7:43 PM
Just learned that Peter Scott, prof. emeritus of physics at UCSC, died last Oct. at 91. In the 1970s he and William Burke wrote an unpublished text booklet called Special Relativity Primer. I got my hands on a copy in 1981 and couldn't put it down. RIP. #iTeachPhysics web.archive.org/web/20250504...
Here's a slightly out of date attempt to do the same for US crude oil. Perhaps a mistake to put so many curves on a single static chart!

September 6, 2025 at 3:18 PM
Here's a slightly out of date attempt to do the same for US crude oil. Perhaps a mistake to put so many curves on a single static chart!
Will solar generation overtake wind before or after wind overtakes nuclear? 🔌💡

August 29, 2025 at 7:45 PM
Will solar generation overtake wind before or after wind overtakes nuclear? 🔌💡