


Datawrapper
@datawrapper.de
Enrich your stories with charts, maps, and tables – interactive, responsive, and on brand. Questions? Write us: datawrapper.de/contact-us
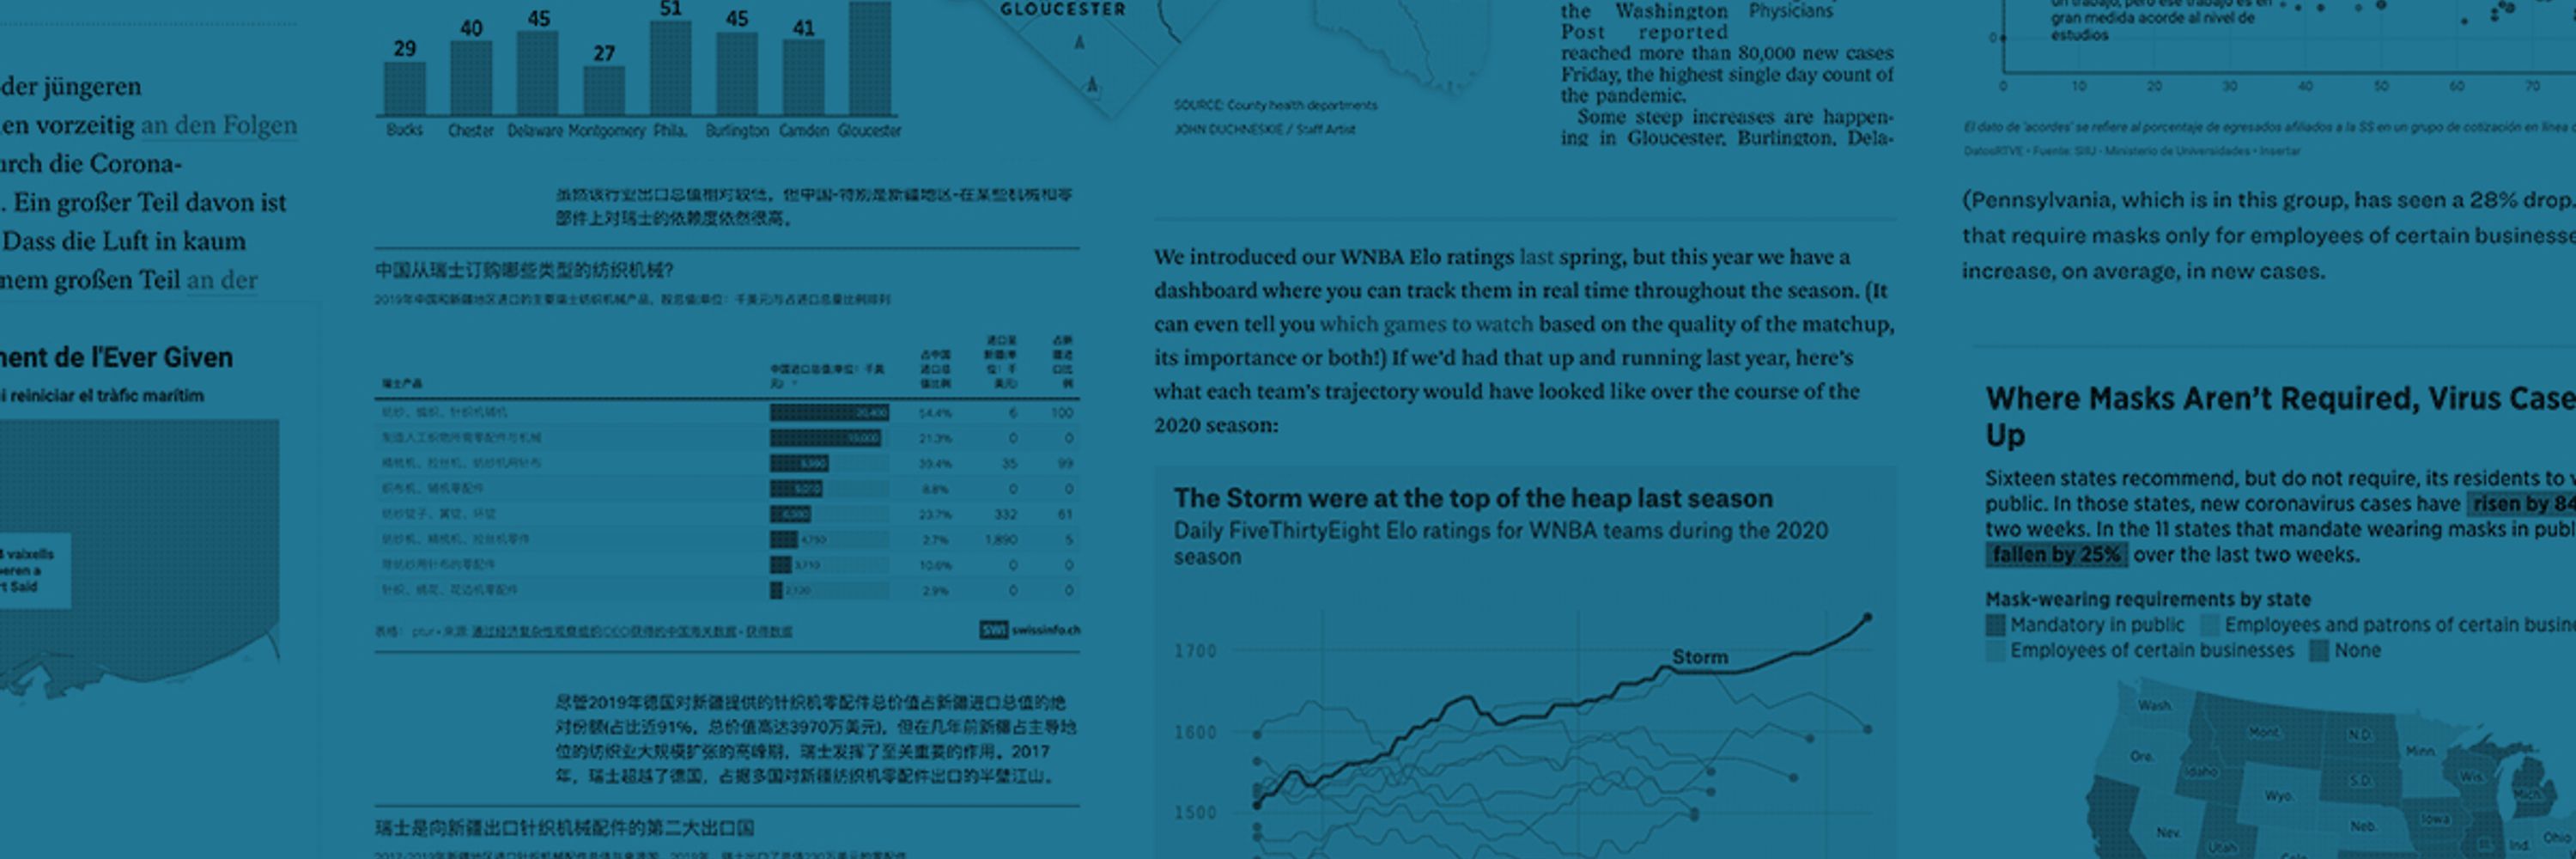
This week's Dispatch brings a varied collection of visualizations, from latest news to the #30DayMapChallenge to analog data vis projects. 📊 🗞️
www.datawrapper.de/blog/data-vi...
www.datawrapper.de/blog/data-vi...


November 11, 2025 at 5:54 PM
This week's Dispatch brings a varied collection of visualizations, from latest news to the #30DayMapChallenge to analog data vis projects. 📊 🗞️
www.datawrapper.de/blog/data-vi...
www.datawrapper.de/blog/data-vi...
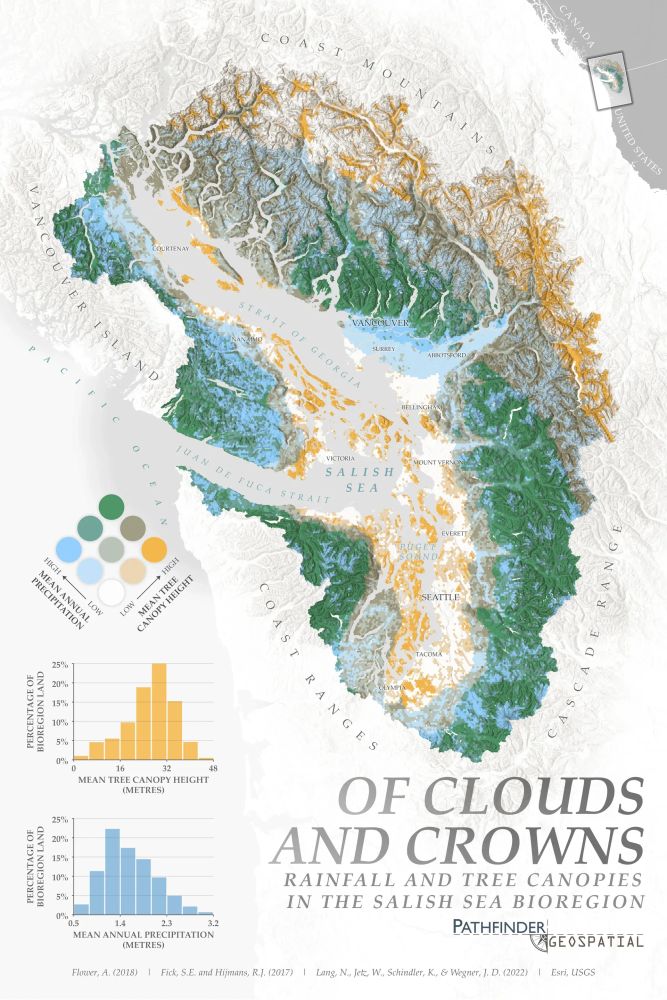
November has officially begun, which means the 🗺️ #30DaysMapChallenge 🗺️ has started. In the latest Data Vis Dispatch, we've listed our favorites, along with even more (highly interactive) maps.
👉🏻 Read the full blog post: www.datawrapper.de/blog/data-vi...
👉🏻 Read the full blog post: www.datawrapper.de/blog/data-vi...


November 4, 2025 at 3:40 PM
November has officially begun, which means the 🗺️ #30DaysMapChallenge 🗺️ has started. In the latest Data Vis Dispatch, we've listed our favorites, along with even more (highly interactive) maps.
👉🏻 Read the full blog post: www.datawrapper.de/blog/data-vi...
👉🏻 Read the full blog post: www.datawrapper.de/blog/data-vi...
On this week's Dispatch: behaviors of cats, solar power boom in Europe, and scrollytelling projects covering the impacts of war. 📊 🖱️
www.datawrapper.de/blog/data-vi...
www.datawrapper.de/blog/data-vi...


October 28, 2025 at 10:19 PM
On this week's Dispatch: behaviors of cats, solar power boom in Europe, and scrollytelling projects covering the impacts of war. 📊 🖱️
www.datawrapper.de/blog/data-vi...
www.datawrapper.de/blog/data-vi...
What happened at the Louvre? Where do birds travel throughout the year? And how much is 50 Cent really worth in this economy? All of that and more in this week's Data Vis Dispatch. 🤔 📊
www.datawrapper.de/blog/data-vi...
www.datawrapper.de/blog/data-vi...


October 21, 2025 at 8:00 PM
What happened at the Louvre? Where do birds travel throughout the year? And how much is 50 Cent really worth in this economy? All of that and more in this week's Data Vis Dispatch. 🤔 📊
www.datawrapper.de/blog/data-vi...
www.datawrapper.de/blog/data-vi...
📊 This week's Dispatch includes charts and maps on addictions, animals, and trees, but also a chance to test your knowledge of Gen Z slang! 💬 🍂
www.datawrapper.de/blog/data-vi...
www.datawrapper.de/blog/data-vi...


October 14, 2025 at 4:37 PM
📊 This week's Dispatch includes charts and maps on addictions, animals, and trees, but also a chance to test your knowledge of Gen Z slang! 💬 🍂
www.datawrapper.de/blog/data-vi...
www.datawrapper.de/blog/data-vi...
This past week has marked several important dates that inspired chart- and map-makers around the world. The latest Dispatch covers ongoing conflicts, reunification, government shutdown, and much more. 📅 📊
www.datawrapper.de/blog/data-vi...
www.datawrapper.de/blog/data-vi...


October 7, 2025 at 5:16 PM
This past week has marked several important dates that inspired chart- and map-makers around the world. The latest Dispatch covers ongoing conflicts, reunification, government shutdown, and much more. 📅 📊
www.datawrapper.de/blog/data-vi...
www.datawrapper.de/blog/data-vi...
📊 On this week's Data Vis Dispatch, tigers and wolves make an appearance, and we also talk social media, politics, and red lines. 🐅 🐺 📈
www.datawrapper.de/blog/data-vi...
www.datawrapper.de/blog/data-vi...


September 30, 2025 at 8:31 PM
📊 On this week's Data Vis Dispatch, tigers and wolves make an appearance, and we also talk social media, politics, and red lines. 🐅 🐺 📈
www.datawrapper.de/blog/data-vi...
www.datawrapper.de/blog/data-vi...
There are different kinds of maps that you can create in Datawrapper. But which one should you use for which type of data and for which use case?
In this tutorial, you'll learn how to pick the one that goes best with your data:
📹 youtu.be/upnbAsc-rhU
In this tutorial, you'll learn how to pick the one that goes best with your data:
📹 youtu.be/upnbAsc-rhU

September 24, 2025 at 2:10 PM
There are different kinds of maps that you can create in Datawrapper. But which one should you use for which type of data and for which use case?
In this tutorial, you'll learn how to pick the one that goes best with your data:
📹 youtu.be/upnbAsc-rhU
In this tutorial, you'll learn how to pick the one that goes best with your data:
📹 youtu.be/upnbAsc-rhU
In this week's Dispatch, you'll find data vis on politics, trains, and minerals, but also interactive tools to explore, and yet another data game at the end. 📊 🕹️
www.datawrapper.de/blog/data-vi...
www.datawrapper.de/blog/data-vi...


September 23, 2025 at 3:45 PM
In this week's Dispatch, you'll find data vis on politics, trains, and minerals, but also interactive tools to explore, and yet another data game at the end. 📊 🕹️
www.datawrapper.de/blog/data-vi...
www.datawrapper.de/blog/data-vi...
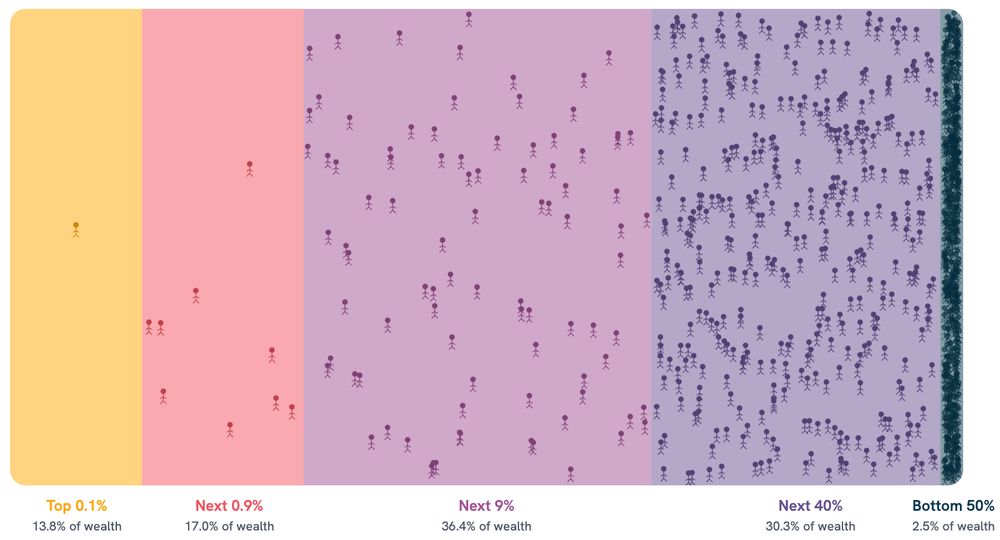
This week's Dispatch brings a range of topics — U.S. politics, gender issues, the economy, conflict, and climate — as well as a chart-themed game at the end. 📊 🕹️
www.datawrapper.de/blog/data-vi...
www.datawrapper.de/blog/data-vi...


September 16, 2025 at 3:51 PM
This week's Dispatch brings a range of topics — U.S. politics, gender issues, the economy, conflict, and climate — as well as a chart-themed game at the end. 📊 🕹️
www.datawrapper.de/blog/data-vi...
www.datawrapper.de/blog/data-vi...
📊 The Dispatch is here! This week's visualizations feature China's military parade, climate change impacts and solutions, and much more. 🗞️
www.datawrapper.de/blog/data-vi...
www.datawrapper.de/blog/data-vi...


September 9, 2025 at 5:43 PM
📊 The Dispatch is here! This week's visualizations feature China's military parade, climate change impacts and solutions, and much more. 🗞️
www.datawrapper.de/blog/data-vi...
www.datawrapper.de/blog/data-vi...
From the political slant of large language models (and the people who make them) to a week of uncertainty in French government — this week's Data Vis Dispatch has it all in pictures! 📈
www.datawrapper.de/blog/data-vi...
www.datawrapper.de/blog/data-vi...


September 3, 2025 at 7:32 AM
From the political slant of large language models (and the people who make them) to a week of uncertainty in French government — this week's Data Vis Dispatch has it all in pictures! 📈
www.datawrapper.de/blog/data-vi...
www.datawrapper.de/blog/data-vi...
Mini line charts? Country flags? Custom highlights? Yes! You can do all that in a Datawrapper table. 🤩
In this video, you'll learn how to turn raw data into a clean, interactive, and visually engaging table: youtu.be/kdYSPjBKfSA
In this video, you'll learn how to turn raw data into a clean, interactive, and visually engaging table: youtu.be/kdYSPjBKfSA

August 28, 2025 at 8:01 AM
Mini line charts? Country flags? Custom highlights? Yes! You can do all that in a Datawrapper table. 🤩
In this video, you'll learn how to turn raw data into a clean, interactive, and visually engaging table: youtu.be/kdYSPjBKfSA
In this video, you'll learn how to turn raw data into a clean, interactive, and visually engaging table: youtu.be/kdYSPjBKfSA
Learn about debatable maps and discover charts on energy, heat, politics, and more in this week’s edition of the Data Vis Dispatch! 📊
www.datawrapper.de/blog/data-vi...
www.datawrapper.de/blog/data-vi...


August 26, 2025 at 6:16 PM
Learn about debatable maps and discover charts on energy, heat, politics, and more in this week’s edition of the Data Vis Dispatch! 📊
www.datawrapper.de/blog/data-vi...
www.datawrapper.de/blog/data-vi...
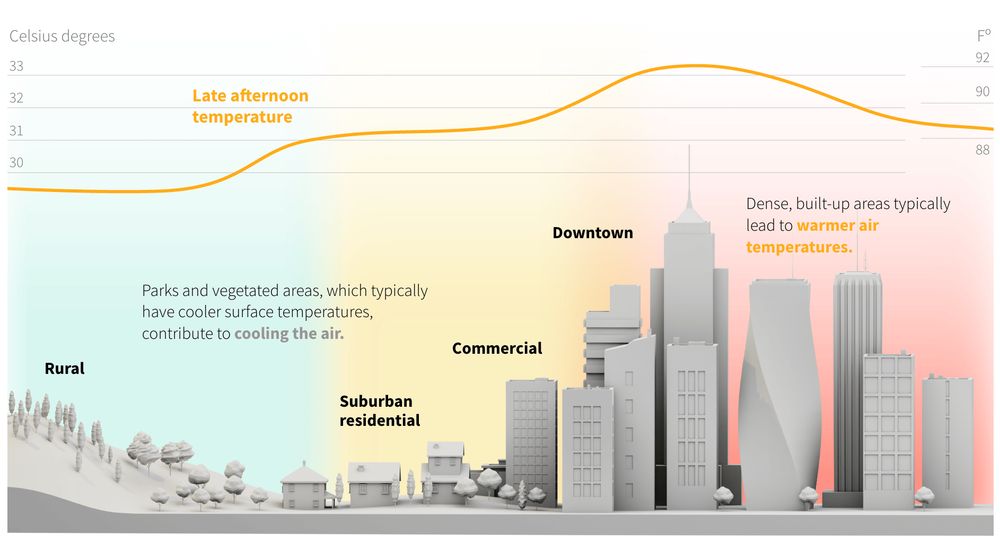
🌇 Learn all about the weather and it’s consequences (both good and bad) in our latest Data Vis Dispatch. You’ll also find charts about sports, migration, and AI in there! 📊
www.datawrapper.de/blog/data-vi...
www.datawrapper.de/blog/data-vi...


August 19, 2025 at 4:35 PM
🌇 Learn all about the weather and it’s consequences (both good and bad) in our latest Data Vis Dispatch. You’ll also find charts about sports, migration, and AI in there! 📊
www.datawrapper.de/blog/data-vi...
www.datawrapper.de/blog/data-vi...
Choropleth maps are one of the most powerful ways to show geographic patterns in your data. 🌍 In this new tutorial, you'll learn how to create, customize, and publish one in Datawrapper.
✨ You can watch it here: youtu.be/-e7O69cgQ_M
✨ You can watch it here: youtu.be/-e7O69cgQ_M

August 14, 2025 at 9:02 AM
Choropleth maps are one of the most powerful ways to show geographic patterns in your data. 🌍 In this new tutorial, you'll learn how to create, customize, and publish one in Datawrapper.
✨ You can watch it here: youtu.be/-e7O69cgQ_M
✨ You can watch it here: youtu.be/-e7O69cgQ_M
📊 This week’s Data Vis Dispatch features visualizations about Europe’s wildfires, mushroom maps, tariff analyses, and opinions about Italian food! 🍝
www.datawrapper.de/blog/data-vi...
www.datawrapper.de/blog/data-vi...


August 12, 2025 at 3:58 PM
📊 This week’s Data Vis Dispatch features visualizations about Europe’s wildfires, mushroom maps, tariff analyses, and opinions about Italian food! 🍝
www.datawrapper.de/blog/data-vi...
www.datawrapper.de/blog/data-vi...
🗞️ In the latest Data Vis Dispatch, we’re taking a trip from Texas to Germany and all around the world, looking at coffee, the environment, and happy songs in trying times! 📊
www.datawrapper.de/blog/data-vi...
www.datawrapper.de/blog/data-vi...


August 5, 2025 at 4:35 PM
🗞️ In the latest Data Vis Dispatch, we’re taking a trip from Texas to Germany and all around the world, looking at coffee, the environment, and happy songs in trying times! 📊
www.datawrapper.de/blog/data-vi...
www.datawrapper.de/blog/data-vi...
📊 In this week's Data Vis Dispatch: U.S. tariffs, humanitarian crisis in Gaza, and much more. 🗞️
www.datawrapper.de/blog/data-vi...
www.datawrapper.de/blog/data-vi...


July 29, 2025 at 9:30 PM
📊 In this week's Data Vis Dispatch: U.S. tariffs, humanitarian crisis in Gaza, and much more. 🗞️
www.datawrapper.de/blog/data-vi...
www.datawrapper.de/blog/data-vi...
🎉 New: If you're mapping the North Pole or a long-haul flight path, then it matters to you that the Earth is a sphere — not the flat rectangle of traditional Mercator projections 🌏
We hope our new globe projection expands your locator map horizons!
www.datawrapper.de/blog/new-glo...
We hope our new globe projection expands your locator map horizons!
www.datawrapper.de/blog/new-glo...


July 25, 2025 at 8:10 AM
🎉 New: If you're mapping the North Pole or a long-haul flight path, then it matters to you that the Earth is a sphere — not the flat rectangle of traditional Mercator projections 🌏
We hope our new globe projection expands your locator map horizons!
www.datawrapper.de/blog/new-glo...
We hope our new globe projection expands your locator map horizons!
www.datawrapper.de/blog/new-glo...
📈 A good line chart tells a story. In this video, you'll learn how to create one from scratch using Datawrapper—no code needed.
🎥 Watch it here: youtu.be/kKhAta1hxVo
🎥 Watch it here: youtu.be/kKhAta1hxVo

July 24, 2025 at 3:02 PM
📈 A good line chart tells a story. In this video, you'll learn how to create one from scratch using Datawrapper—no code needed.
🎥 Watch it here: youtu.be/kKhAta1hxVo
🎥 Watch it here: youtu.be/kKhAta1hxVo
📊 This week's Data Vis Dispatch brings you a healthy mix of charts and maps, covering topics like clean energy, construction, or durians. 🏗️ ☀️
www.datawrapper.de/blog/data-vi...
www.datawrapper.de/blog/data-vi...


July 22, 2025 at 7:53 PM
📊 This week's Data Vis Dispatch brings you a healthy mix of charts and maps, covering topics like clean energy, construction, or durians. 🏗️ ☀️
www.datawrapper.de/blog/data-vi...
www.datawrapper.de/blog/data-vi...
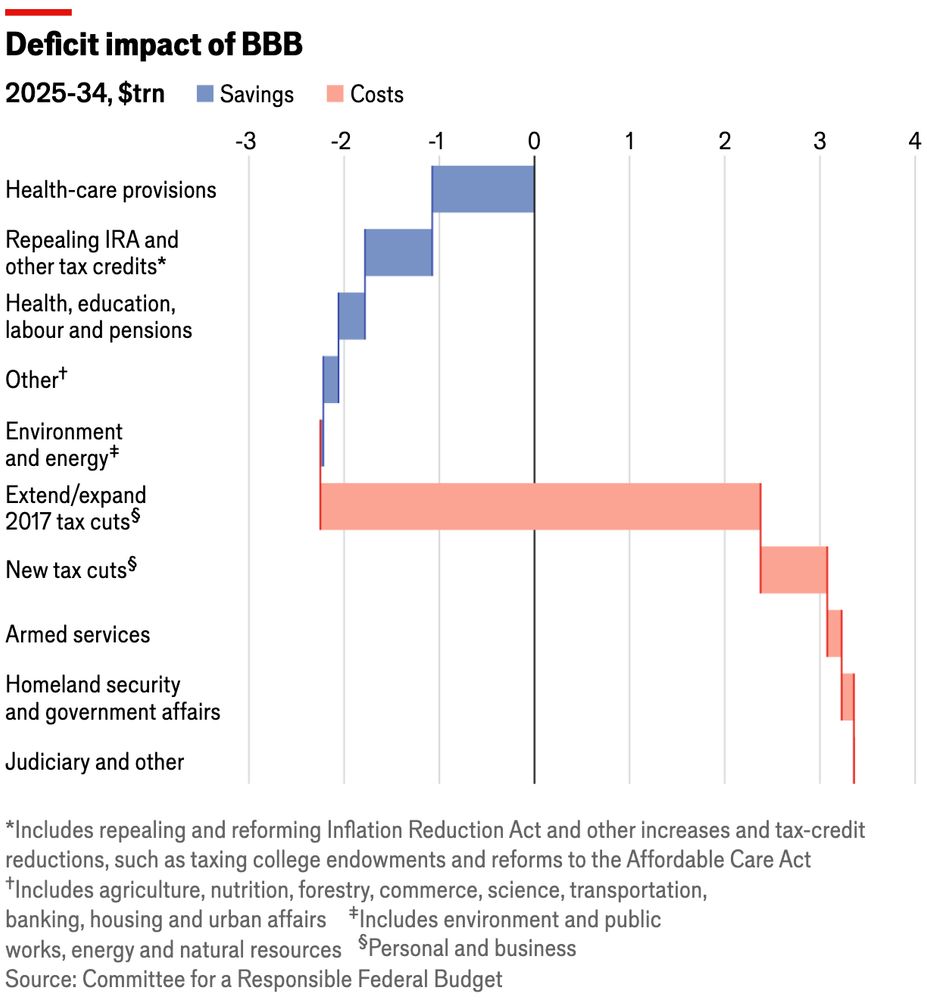
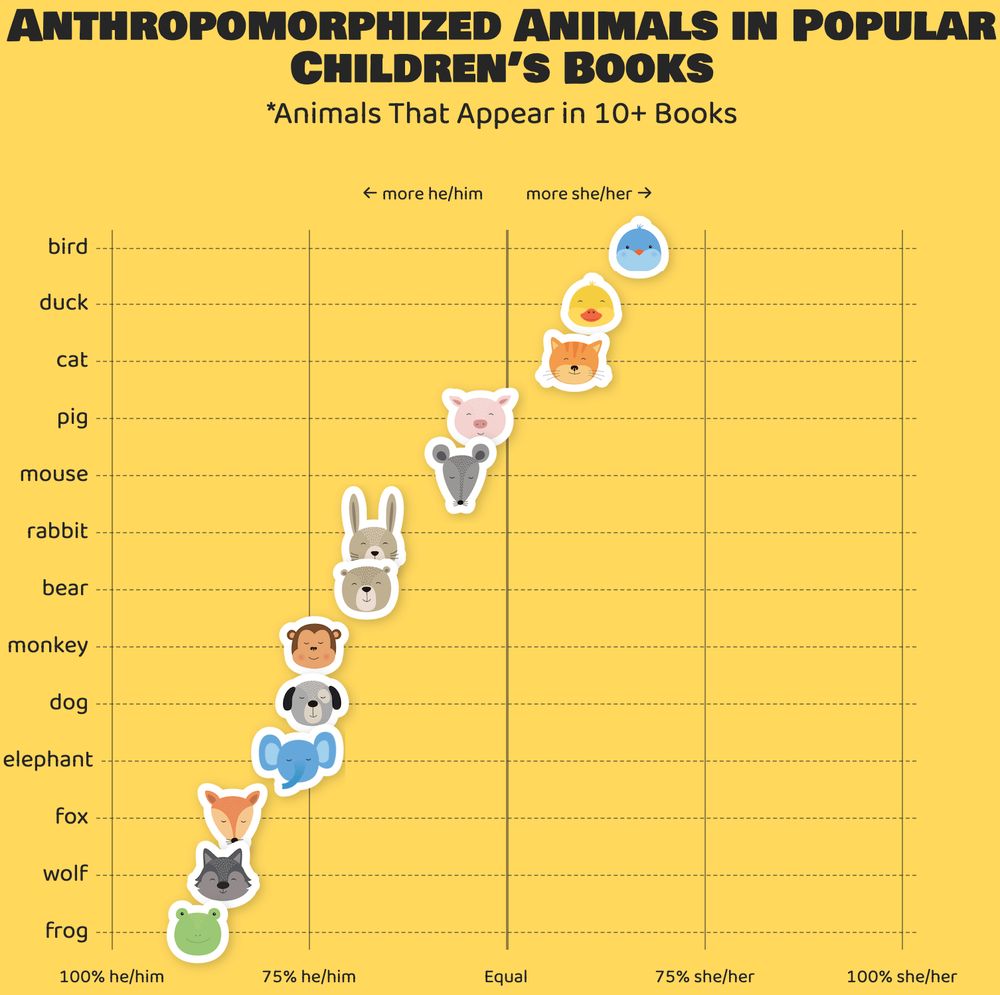
📊 The Dispatch is back with a double edition and a tiny new feature for die-hard fans! You can now use a navigation bar for a quick overview or to go to your favourites. Topics include the Big Beautiful Bill, extreme weather, and animals from children's books. 🐰
www.datawrapper.de/blog/data-vi...
www.datawrapper.de/blog/data-vi...
July 15, 2025 at 5:23 PM
📊 The Dispatch is back with a double edition and a tiny new feature for die-hard fans! You can now use a navigation bar for a quick overview or to go to your favourites. Topics include the Big Beautiful Bill, extreme weather, and animals from children's books. 🐰
www.datawrapper.de/blog/data-vi...
www.datawrapper.de/blog/data-vi...
2️⃣0️⃣0️⃣ Since today marks the 200th publication of the Data Vis Dispatch, our comms team assembled this special edition, going over its history, creation process, and your feedback! 🎂
www.datawrapper.de/blog/data-vi...
www.datawrapper.de/blog/data-vi...


July 8, 2025 at 4:26 PM
2️⃣0️⃣0️⃣ Since today marks the 200th publication of the Data Vis Dispatch, our comms team assembled this special edition, going over its history, creation process, and your feedback! 🎂
www.datawrapper.de/blog/data-vi...
www.datawrapper.de/blog/data-vi...
📊 Here’s a colorful preview of this week’s Data Vis Dispatch! Topics include oil tanker traffic, NYC elections, and the global race for renewable energy 🔋
www.datawrapper.de/blog/data-vi...
www.datawrapper.de/blog/data-vi...


July 1, 2025 at 9:31 PM
📊 Here’s a colorful preview of this week’s Data Vis Dispatch! Topics include oil tanker traffic, NYC elections, and the global race for renewable energy 🔋
www.datawrapper.de/blog/data-vi...
www.datawrapper.de/blog/data-vi...