


Michael Friendly
@datavisfriendly.bsky.social
ASA Fellow; #rstats developer of graphical methods for categorical and multivariate data; #datavis history of data visualization; #historicaldatavis; Milestones project
Web: www.datavis.ca
GitHub: github.com/friendly
Web: www.datavis.ca
GitHub: github.com/friendly
Pinned
There's a delicious time in book writing when I switch from actual writing & making graphs to POLISHING-- smoothing language, adding X-references, and improving graphs that don't pass the smell test.
I'm there now with my book, Visualizing Multivariate Data and Models with R.
What a sweet feeling!
I'm there now with my book, Visualizing Multivariate Data and Models with R.
What a sweet feeling!
#rstats Well worth reading.
Programming languages for statistical computing and graphics show provide the shortest path between an idea in your head and result on your screen or in your paper
Programming languages for statistical computing and graphics show provide the shortest path between an idea in your head and result on your screen or in your paper


November 14, 2025 at 3:58 AM
#rstats Well worth reading.
Programming languages for statistical computing and graphics show provide the shortest path between an idea in your head and result on your screen or in your paper
Programming languages for statistical computing and graphics show provide the shortest path between an idea in your head and result on your screen or in your paper
#TodayinHistory #dataviz #OTD 📊
🎂Nov 13, 1911 Heinz Von Foerster born in Vienna, Italy 🇮🇹
1930: Timeline of historical events drawn on a logarithmic scale, allowing enormous range & changing the default linear view of history for visibility of more recent events
🎂Nov 13, 1911 Heinz Von Foerster born in Vienna, Italy 🇮🇹
1930: Timeline of historical events drawn on a logarithmic scale, allowing enormous range & changing the default linear view of history for visibility of more recent events


November 14, 2025 at 2:33 AM
#TodayinHistory #dataviz #OTD 📊
🎂Nov 13, 1911 Heinz Von Foerster born in Vienna, Italy 🇮🇹
1930: Timeline of historical events drawn on a logarithmic scale, allowing enormous range & changing the default linear view of history for visibility of more recent events
🎂Nov 13, 1911 Heinz Von Foerster born in Vienna, Italy 🇮🇹
1930: Timeline of historical events drawn on a logarithmic scale, allowing enormous range & changing the default linear view of history for visibility of more recent events
Reposted by Michael Friendly

tmap or ggplot2 for maps? 🗺️
David O’Sullivan breaks down the trade-offs in a blog post.
URL: dosull.github.io/posts/2024-1...
#RStats #RSpatial #Maps #tmap #ggplot2
David O’Sullivan breaks down the trade-offs in a blog post.
URL: dosull.github.io/posts/2024-1...
#RStats #RSpatial #Maps #tmap #ggplot2

tmap vs. ggplot2 for mapping – Geospatial Stuff
For me at least the choice between ggplot2 and tmap is an ongoing question. Here are my latest thoughts on the subject (with code).
dosull.github.io
November 12, 2025 at 2:02 PM
#TodayinHistory #dataviz #OTD 📊
📅Nov 12, 1733 Abraham De Moivre published his limit theorem to the binomial distribution
'Approximatio ad Summam Terminorum Binomii in Seriem expansi'
📅Nov 12, 1733 Abraham De Moivre published his limit theorem to the binomial distribution
'Approximatio ad Summam Terminorum Binomii in Seriem expansi'
November 13, 2025 at 1:22 AM
#TodayinHistory #dataviz #OTD 📊
📅Nov 12, 1733 Abraham De Moivre published his limit theorem to the binomial distribution
'Approximatio ad Summam Terminorum Binomii in Seriem expansi'
📅Nov 12, 1733 Abraham De Moivre published his limit theorem to the binomial distribution
'Approximatio ad Summam Terminorum Binomii in Seriem expansi'

#rstats #dataviz
🚀📈 Plotting methods for linear/quadratic discriminant analysis now developing nicely in the dev 1.0.1 version of {candisc} 📦
Now, nice ggplot plots of decision regions in data space for MASS::lda() & MASS::qda
🔗 friendly.r-universe.dev/candisc
🚀📈 Plotting methods for linear/quadratic discriminant analysis now developing nicely in the dev 1.0.1 version of {candisc} 📦
Now, nice ggplot plots of decision regions in data space for MASS::lda() & MASS::qda
🔗 friendly.r-universe.dev/candisc

November 12, 2025 at 2:03 AM
#rstats #dataviz
🚀📈 Plotting methods for linear/quadratic discriminant analysis now developing nicely in the dev 1.0.1 version of {candisc} 📦
Now, nice ggplot plots of decision regions in data space for MASS::lda() & MASS::qda
🔗 friendly.r-universe.dev/candisc
🚀📈 Plotting methods for linear/quadratic discriminant analysis now developing nicely in the dev 1.0.1 version of {candisc} 📦
Now, nice ggplot plots of decision regions in data space for MASS::lda() & MASS::qda
🔗 friendly.r-universe.dev/candisc
#TodayinHistory #dataviz #OTD 📊
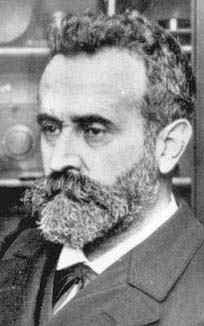
🎂Nov 11, 1851 Jacques Bertillon born in Paris, France 🇫🇷
1896: Use of area rectangles on a #map to display two variables and their product (population of arrondisements in Paris, percent foreigners; area = absolute number of foreigners)
🎂Nov 11, 1851 Jacques Bertillon born in Paris, France 🇫🇷
1896: Use of area rectangles on a #map to display two variables and their product (population of arrondisements in Paris, percent foreigners; area = absolute number of foreigners)

November 12, 2025 at 1:05 AM
#TodayinHistory #dataviz #OTD 📊
🎂Nov 11, 1851 Jacques Bertillon born in Paris, France 🇫🇷
1896: Use of area rectangles on a #map to display two variables and their product (population of arrondisements in Paris, percent foreigners; area = absolute number of foreigners)
🎂Nov 11, 1851 Jacques Bertillon born in Paris, France 🇫🇷
1896: Use of area rectangles on a #map to display two variables and their product (population of arrondisements in Paris, percent foreigners; area = absolute number of foreigners)
#TodayinHistory #dataviz #OTD 📊
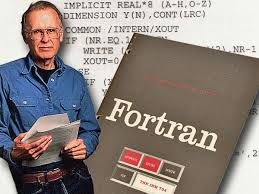
📅Nov 10, 1954 John Backus published the formal proposal for FORTRAN, the first high level language for computing
🔗 bit.ly/3DQnswH
It was proprietary to IBM. The 1st FORTRAN compiler was completed 1955-56.
Who remembers the shift from that to FORTRAN IV?
📅Nov 10, 1954 John Backus published the formal proposal for FORTRAN, the first high level language for computing
🔗 bit.ly/3DQnswH
It was proprietary to IBM. The 1st FORTRAN compiler was completed 1955-56.
Who remembers the shift from that to FORTRAN IV?
November 11, 2025 at 1:34 AM
#TodayinHistory #dataviz #OTD 📊
📅Nov 10, 1954 John Backus published the formal proposal for FORTRAN, the first high level language for computing
🔗 bit.ly/3DQnswH
It was proprietary to IBM. The 1st FORTRAN compiler was completed 1955-56.
Who remembers the shift from that to FORTRAN IV?
📅Nov 10, 1954 John Backus published the formal proposal for FORTRAN, the first high level language for computing
🔗 bit.ly/3DQnswH
It was proprietary to IBM. The 1st FORTRAN compiler was completed 1955-56.
Who remembers the shift from that to FORTRAN IV?
#TodayinHistory #dataviz #OTD 📊
🎂Nov 9, 1854 Matthew Henry Phineas Riall Sankey born in Nenagh, County Tipperary, Ireland
1898: introduced the first energy flow diagram to show the energy efficiency of a steam engine, dubbed the "Sankey diagram"
👀 bit.ly/497fk8l
🎂Nov 9, 1854 Matthew Henry Phineas Riall Sankey born in Nenagh, County Tipperary, Ireland
1898: introduced the first energy flow diagram to show the energy efficiency of a steam engine, dubbed the "Sankey diagram"
👀 bit.ly/497fk8l


November 10, 2025 at 2:25 AM
#TodayinHistory #dataviz #OTD 📊
🎂Nov 9, 1854 Matthew Henry Phineas Riall Sankey born in Nenagh, County Tipperary, Ireland
1898: introduced the first energy flow diagram to show the energy efficiency of a steam engine, dubbed the "Sankey diagram"
👀 bit.ly/497fk8l
🎂Nov 9, 1854 Matthew Henry Phineas Riall Sankey born in Nenagh, County Tipperary, Ireland
1898: introduced the first energy flow diagram to show the energy efficiency of a steam engine, dubbed the "Sankey diagram"
👀 bit.ly/497fk8l
#TodayinHistory #dataviz #OTD 📊
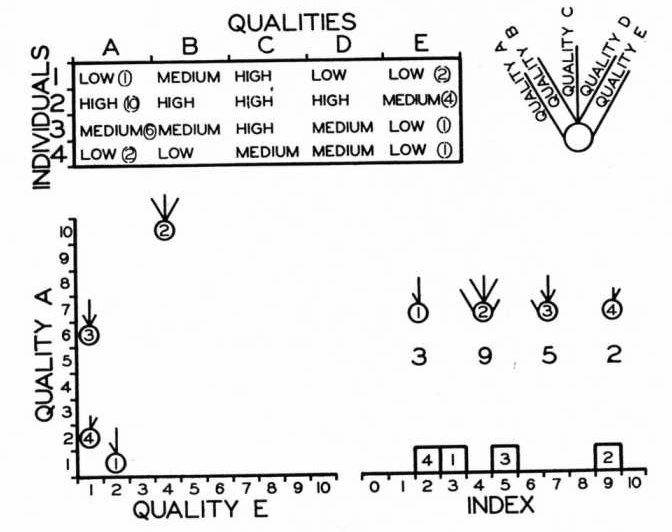
🎂Nov 9, 1897 Edgar Anderson born in Forestville, NY, USA 🇺🇸
1928: Multivariate glyphs, invented to display four variables and their relations (length and width of petals and sepals in iris flowers)
And, of course gave us the famed (or infamous) iris dataset
🎂Nov 9, 1897 Edgar Anderson born in Forestville, NY, USA 🇺🇸
1928: Multivariate glyphs, invented to display four variables and their relations (length and width of petals and sepals in iris flowers)
And, of course gave us the famed (or infamous) iris dataset


November 10, 2025 at 2:07 AM
#TodayinHistory #dataviz #OTD 📊
🎂Nov 9, 1897 Edgar Anderson born in Forestville, NY, USA 🇺🇸
1928: Multivariate glyphs, invented to display four variables and their relations (length and width of petals and sepals in iris flowers)
And, of course gave us the famed (or infamous) iris dataset
🎂Nov 9, 1897 Edgar Anderson born in Forestville, NY, USA 🇺🇸
1928: Multivariate glyphs, invented to display four variables and their relations (length and width of petals and sepals in iris flowers)
And, of course gave us the famed (or infamous) iris dataset
Reposted by Michael Friendly
For me, ggview's most useful space is when I am developing a figure in RStudio with a lot of tweaking, and that figure is eventually going to go into a specific dimension output. So I don't need to be writing out and refreshing the figure to be checking annotations etc as I create them.
November 8, 2025 at 3:02 AM
For me, ggview's most useful space is when I am developing a figure in RStudio with a lot of tweaking, and that figure is eventually going to go into a specific dimension output. So I don't need to be writing out and refreshing the figure to be checking annotations etc as I create them.
An interesting test case for visibility of colored dot maps.
Glad you chose yellow for Cuomo :)
Glad you chose yellow for Cuomo :)

NYC 2025 Mayoral results as a dot density plot using the `dots` #rstats package (cran.r-project.org/web/packages...)

November 8, 2025 at 3:13 AM
An interesting test case for visibility of colored dot maps.
Glad you chose yellow for Cuomo :)
Glad you chose yellow for Cuomo :)
Hmm, I wonder if I should be using {ggview} 📦 in my book? I didn't know this.Thoughts?

Have you ever wanted to make your own climate warming stripes plot? It's super easy with #rstats! (code here gist.github.com/andrewheiss/... )

November 8, 2025 at 2:49 AM
Hmm, I wonder if I should be using {ggview} 📦 in my book? I didn't know this.Thoughts?
Reposted by Michael Friendly


And, did you name your dog, "dog"?

I labeled the function data() and now I stuck in namespace conflict hell between utils and my package
Do I need to rename my function? I don't see how i can pass the devtools::checks()
#rstats
Do I need to rename my function? I don't see how i can pass the devtools::checks()
#rstats
do not name functions after base or utils functions
November 7, 2025 at 2:55 AM
And, did you name your dog, "dog"?
Nice map/graph design; Central Af Republic sure stands out.
But I'm always perplexed by color ramp palettes where so much of the range is dominated by one end of the color scale (green here)
But I'm always perplexed by color ramp palettes where so much of the range is dominated by one end of the color scale (green here)

Day 6 – Dimension 🌍 | #30DayMapChallenge Health is complex and multidimensional.
Central Africa ranks lowest, showing how health understanding varies with chosen dimensions. 🗺️
Code and More: bookdown.org/fede_gazzell...
#RStats #dataviz #health #DataScience #30daymapchallenge
Central Africa ranks lowest, showing how health understanding varies with chosen dimensions. 🗺️
Code and More: bookdown.org/fede_gazzell...
#RStats #dataviz #health #DataScience #30daymapchallenge

November 7, 2025 at 2:42 AM
Nice map/graph design; Central Af Republic sure stands out.
But I'm always perplexed by color ramp palettes where so much of the range is dominated by one end of the color scale (green here)
But I'm always perplexed by color ramp palettes where so much of the range is dominated by one end of the color scale (green here)
#TodayinHistory #dataviz #OTD 📊
🎂Nov 6, 1869 Arthur L. Bowley born in Bristol, UK. 🇬🇧
1901: Smoothing of time series in one of the 1st text books on data graphics
He used 3-, 5-, 10- year running averages, discussed the merits of smoothing
#rstats: data(Bowley, package="HistData"); example(Bowley)
🎂Nov 6, 1869 Arthur L. Bowley born in Bristol, UK. 🇬🇧
1901: Smoothing of time series in one of the 1st text books on data graphics
He used 3-, 5-, 10- year running averages, discussed the merits of smoothing
#rstats: data(Bowley, package="HistData"); example(Bowley)


November 7, 2025 at 2:23 AM
#TodayinHistory #dataviz #OTD 📊
🎂Nov 6, 1869 Arthur L. Bowley born in Bristol, UK. 🇬🇧
1901: Smoothing of time series in one of the 1st text books on data graphics
He used 3-, 5-, 10- year running averages, discussed the merits of smoothing
#rstats: data(Bowley, package="HistData"); example(Bowley)
🎂Nov 6, 1869 Arthur L. Bowley born in Bristol, UK. 🇬🇧
1901: Smoothing of time series in one of the 1st text books on data graphics
He used 3-, 5-, 10- year running averages, discussed the merits of smoothing
#rstats: data(Bowley, package="HistData"); example(Bowley)
That's rich: "found guilty of sexing-up research data"

I hadnt seen this particular take on this story till now. A minimalist apology. Not impressed.
nationalnews.co.uk/news/shamed-...
nationalnews.co.uk/news/shamed-...

Shamed Scientist Apologises For The First Time About The Academic Scandal That Destroyed His Career And Shocked The World
An ecologist who shot to fame after discovering that spiders have human-like personalities has made an emotional apology after being
nationalnews.co.uk
November 7, 2025 at 2:02 AM
That's rich: "found guilty of sexing-up research data"
#TodayinHistory #dataviz #OTD 📊
🎂Nov 6, 1771 Aloys Senefelder born in Prague, Czech Republic
1798: Invention of lithographic technique for printing of maps and diagrams 🗺️
"At the time the effect of lithography ... was as great as has been the introduction [of the Xerox machine]" - A.H. Robinson
🎂Nov 6, 1771 Aloys Senefelder born in Prague, Czech Republic
1798: Invention of lithographic technique for printing of maps and diagrams 🗺️
"At the time the effect of lithography ... was as great as has been the introduction [of the Xerox machine]" - A.H. Robinson


November 7, 2025 at 1:50 AM
#TodayinHistory #dataviz #OTD 📊
🎂Nov 6, 1771 Aloys Senefelder born in Prague, Czech Republic
1798: Invention of lithographic technique for printing of maps and diagrams 🗺️
"At the time the effect of lithography ... was as great as has been the introduction [of the Xerox machine]" - A.H. Robinson
🎂Nov 6, 1771 Aloys Senefelder born in Prague, Czech Republic
1798: Invention of lithographic technique for printing of maps and diagrams 🗺️
"At the time the effect of lithography ... was as great as has been the introduction [of the Xerox machine]" - A.H. Robinson
Now heading to a CRAN near you...
#rstats #dataviz
Thrilled to announce a major release 1.0.0 of the {candisc} 📦 for canonical discriminant and correlation analysis and visualization.
Now includes methods for linear/quadratic discriminant analysis.
CRAN is upload down, but you can get it from
friendly.r-universe.dev/candisc
Thrilled to announce a major release 1.0.0 of the {candisc} 📦 for canonical discriminant and correlation analysis and visualization.
Now includes methods for linear/quadratic discriminant analysis.
CRAN is upload down, but you can get it from
friendly.r-universe.dev/candisc
candisc: Visualizing Generalized Canonical Discriminant and Canonical
Correlation Analysis
friendly.r-universe.dev
November 6, 2025 at 3:40 AM
Now heading to a CRAN near you...
Interesting & nice chart!. Similar idea to what I use in #rstats
vcd::fourfold()
- but uses quarter circles, with CI rings for the odds ratio.
- signif OR !=1 \equiv quarter circles DON'T OVERLAP
vcd::fourfold()
- but uses quarter circles, with CI rings for the odds ratio.
- signif OR !=1 \equiv quarter circles DON'T OVERLAP


November 6, 2025 at 3:39 AM
Interesting & nice chart!. Similar idea to what I use in #rstats
vcd::fourfold()
- but uses quarter circles, with CI rings for the odds ratio.
- signif OR !=1 \equiv quarter circles DON'T OVERLAP
vcd::fourfold()
- but uses quarter circles, with CI rings for the odds ratio.
- signif OR !=1 \equiv quarter circles DON'T OVERLAP
Maybe just what I was looking for!

I'm excited to share side::kick(), an experimental open-source coding agent for RStudio built entirely in R. It can interact with your files, communicate with your active #rstats session, and run code.
Check it out: github.com/simonpcouch/...
Check it out: github.com/simonpcouch/...
November 6, 2025 at 3:26 AM
Maybe just what I was looking for!
Very effective design & execution! Kudos! 👍
The pipe is a nice touch
The pipe is a nice touch

Flint water samples #TidyTuesday
Bootstrapped water samples for estimating proportion of samples with dangerous levels of lead
Code: github.com/borstell/tid...
#R4DS #DataViz #ggplot2
Bootstrapped water samples for estimating proportion of samples with dangerous levels of lead
Code: github.com/borstell/tid...
#R4DS #DataViz #ggplot2

November 6, 2025 at 2:00 AM
Very effective design & execution! Kudos! 👍
The pipe is a nice touch
The pipe is a nice touch
Reposted by Michael Friendly
#TodayinHistory #dataviz #OTD 📊
💀Nov 5, 1879 James Clerk Maxwell died in Cambridge, England 🏴
1861: Invention of the trichromatic process for making color photographs, by taking three monochrome images through red, green and blue filters
💀Nov 5, 1879 James Clerk Maxwell died in Cambridge, England 🏴
1861: Invention of the trichromatic process for making color photographs, by taking three monochrome images through red, green and blue filters


November 2, 2025 at 1:21 AM
#TodayinHistory #dataviz #OTD 📊
💀Nov 5, 1879 James Clerk Maxwell died in Cambridge, England 🏴
1861: Invention of the trichromatic process for making color photographs, by taking three monochrome images through red, green and blue filters
💀Nov 5, 1879 James Clerk Maxwell died in Cambridge, England 🏴
1861: Invention of the trichromatic process for making color photographs, by taking three monochrome images through red, green and blue filters
#rstats #dataviz
Thrilled to announce a major release 1.0.0 of the {candisc} 📦 for canonical discriminant and correlation analysis and visualization.
Now includes methods for linear/quadratic discriminant analysis.
CRAN is upload down, but you can get it from
friendly.r-universe.dev/candisc
Thrilled to announce a major release 1.0.0 of the {candisc} 📦 for canonical discriminant and correlation analysis and visualization.
Now includes methods for linear/quadratic discriminant analysis.
CRAN is upload down, but you can get it from
friendly.r-universe.dev/candisc
candisc: Visualizing Generalized Canonical Discriminant and Canonical
Correlation Analysis
friendly.r-universe.dev
November 5, 2025 at 1:41 AM
#rstats #dataviz
Thrilled to announce a major release 1.0.0 of the {candisc} 📦 for canonical discriminant and correlation analysis and visualization.
Now includes methods for linear/quadratic discriminant analysis.
CRAN is upload down, but you can get it from
friendly.r-universe.dev/candisc
Thrilled to announce a major release 1.0.0 of the {candisc} 📦 for canonical discriminant and correlation analysis and visualization.
Now includes methods for linear/quadratic discriminant analysis.
CRAN is upload down, but you can get it from
friendly.r-universe.dev/candisc