


Centre for Research on Energy and Clean Air
@creacleanair.bsky.social
An independent international research organisation focused on promoting clean energy and clean air with data and evidence.
https://energyandcleanair.org/
https://energyandcleanair.org/
🇷🇺 CREA’s report on false flagging is now available here:
energyandcleanair.org/publication/...
📊 Find more related CREA data here:
energyandcleanair.org/financing-pu...
#FinancingPutinsWar #FossilFuels #Sanctions #StandWithUkraine
energyandcleanair.org/publication/...
📊 Find more related CREA data here:
energyandcleanair.org/financing-pu...
#FinancingPutinsWar #FossilFuels #Sanctions #StandWithUkraine

November 27, 2025 at 7:00 AM
🇷🇺 CREA’s report on false flagging is now available here:
energyandcleanair.org/publication/...
📊 Find more related CREA data here:
energyandcleanair.org/financing-pu...
#FinancingPutinsWar #FossilFuels #Sanctions #StandWithUkraine
energyandcleanair.org/publication/...
📊 Find more related CREA data here:
energyandcleanair.org/financing-pu...
#FinancingPutinsWar #FossilFuels #Sanctions #StandWithUkraine
💡 In third quarter of 2025, Malawi’s flag was used to transport EUR 403mn of Russian crude oil & oil products through Danish Straits
🇪🇺 🇬🇧 EU & UK must reform flag state regulations & practices globally in lieu of their exploitation for ‘shadow’ vessels fuelling Russia’s war
🇪🇺 🇬🇧 EU & UK must reform flag state regulations & practices globally in lieu of their exploitation for ‘shadow’ vessels fuelling Russia’s war

November 27, 2025 at 7:00 AM
💡 In third quarter of 2025, Malawi’s flag was used to transport EUR 403mn of Russian crude oil & oil products through Danish Straits
🇪🇺 🇬🇧 EU & UK must reform flag state regulations & practices globally in lieu of their exploitation for ‘shadow’ vessels fuelling Russia’s war
🇪🇺 🇬🇧 EU & UK must reform flag state regulations & practices globally in lieu of their exploitation for ‘shadow’ vessels fuelling Russia’s war
❗🇲🇼 The most frequently used false flag is Malawi
In July 2025, the Malawian Secretary for Transport and Public Works wrote to the @imohq.bsky.social (IMO) asking for ‘appropriate action to be taken against the fraudsters’
❗ 📈 The practice has not stopped, it has increased
In July 2025, the Malawian Secretary for Transport and Public Works wrote to the @imohq.bsky.social (IMO) asking for ‘appropriate action to be taken against the fraudsters’
❗ 📈 The practice has not stopped, it has increased

November 27, 2025 at 7:00 AM
❗🇲🇼 The most frequently used false flag is Malawi
In July 2025, the Malawian Secretary for Transport and Public Works wrote to the @imohq.bsky.social (IMO) asking for ‘appropriate action to be taken against the fraudsters’
❗ 📈 The practice has not stopped, it has increased
In July 2025, the Malawian Secretary for Transport and Public Works wrote to the @imohq.bsky.social (IMO) asking for ‘appropriate action to be taken against the fraudsters’
❗ 📈 The practice has not stopped, it has increased
🇷🇺 NEW | REPORT - Flags of inconvenience: 113 vessels flying false flag transported EUR 4.7bn Russian oil in first three quarters of 2025
❗False flagging operations have surged after multiple rounds of sanctions
❗False flagging operations have surged after multiple rounds of sanctions

November 27, 2025 at 7:00 AM
🇷🇺 NEW | REPORT - Flags of inconvenience: 113 vessels flying false flag transported EUR 4.7bn Russian oil in first three quarters of 2025
❗False flagging operations have surged after multiple rounds of sanctions
❗False flagging operations have surged after multiple rounds of sanctions
🇮🇳 NEW | REPORT: Satellite assessment shows #India's Indo-Gangetic airshed most polluted, demanding shift beyond city policies
📷: Seasonal airshed compliance
energyandcleanair.org/publication/a-satellite-based-pm2-5-assessment-across-indias-airsheds-states-and-districts/
@manojkumarnr.bsky.social
📷: Seasonal airshed compliance
energyandcleanair.org/publication/a-satellite-based-pm2-5-assessment-across-indias-airsheds-states-and-districts/
@manojkumarnr.bsky.social

November 25, 2025 at 2:31 AM
🇮🇳 NEW | REPORT: Satellite assessment shows #India's Indo-Gangetic airshed most polluted, demanding shift beyond city policies
📷: Seasonal airshed compliance
energyandcleanair.org/publication/a-satellite-based-pm2-5-assessment-across-indias-airsheds-states-and-districts/
@manojkumarnr.bsky.social
📷: Seasonal airshed compliance
energyandcleanair.org/publication/a-satellite-based-pm2-5-assessment-across-indias-airsheds-states-and-districts/
@manojkumarnr.bsky.social
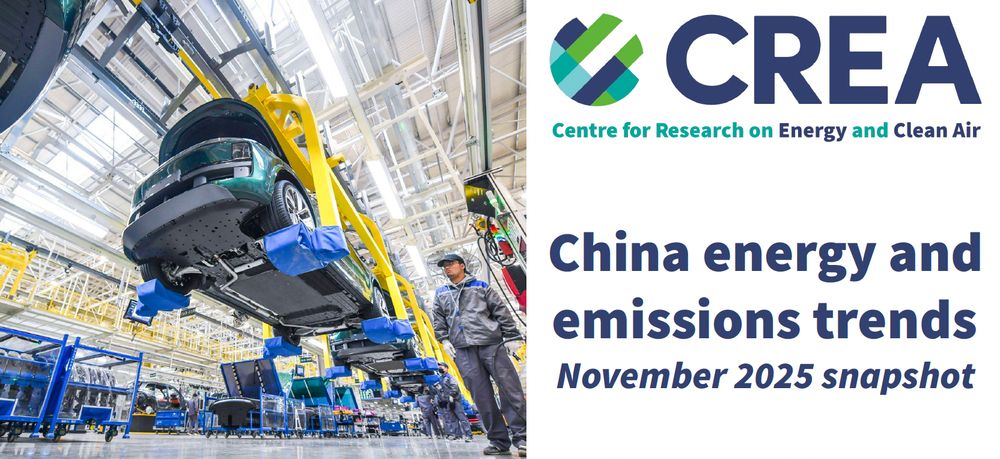
🇨🇳 CREA's November 2025 #ChinaMonthlySnapshot of China's energy & air pollution trends is now available in EN & CN👇
energyandcleanair.org/china-energy...
energyandcleanair.org/china-energy...
November 17, 2025 at 12:00 AM
🇨🇳 CREA's November 2025 #ChinaMonthlySnapshot of China's energy & air pollution trends is now available in EN & CN👇
energyandcleanair.org/china-energy...
energyandcleanair.org/china-energy...
💨 In October 2025, Shijiazhuang (Hebei) had highest monthly average PM2.5 among all provincial capitals; ozone pollution generally highest in South China; Tianjin continued to record highest nitrogen dioxide (NO₂)
🏅Shijiazhuang: PM2.5
🏅Nanchang & Hangzhou: Ozone
🏅Tianjin: NO₂
🏅Shijiazhuang: PM2.5
🏅Nanchang & Hangzhou: Ozone
🏅Tianjin: NO₂

November 17, 2025 at 12:00 AM
💨 In October 2025, Shijiazhuang (Hebei) had highest monthly average PM2.5 among all provincial capitals; ozone pollution generally highest in South China; Tianjin continued to record highest nitrogen dioxide (NO₂)
🏅Shijiazhuang: PM2.5
🏅Nanchang & Hangzhou: Ozone
🏅Tianjin: NO₂
🏅Shijiazhuang: PM2.5
🏅Nanchang & Hangzhou: Ozone
🏅Tianjin: NO₂
🇨🇳 NEW | #China monthly snapshot on #Energy & #AirPollution out now in EN & CN👇
📈 In October 2025, coal power generation had largest year-on-year increase
🚗 3-month average market share of NEVs in new sales reached 50%
💨 Human emissions lifted PM2.5. & ozone in Northeast
📈 In October 2025, coal power generation had largest year-on-year increase
🚗 3-month average market share of NEVs in new sales reached 50%
💨 Human emissions lifted PM2.5. & ozone in Northeast

November 17, 2025 at 12:00 AM
🇨🇳 NEW | #China monthly snapshot on #Energy & #AirPollution out now in EN & CN👇
📈 In October 2025, coal power generation had largest year-on-year increase
🚗 3-month average market share of NEVs in new sales reached 50%
💨 Human emissions lifted PM2.5. & ozone in Northeast
📈 In October 2025, coal power generation had largest year-on-year increase
🚗 3-month average market share of NEVs in new sales reached 50%
💨 Human emissions lifted PM2.5. & ozone in Northeast
🇷🇺 CREA’s monthly analysis on fossil fuel exports from Russia is now available here in EN & 🇺🇦 UA soon to follow:
energyandcleanair.org/october-2025...
Find all related CREA data here:
energyandcleanair.org/financing-pu...
#FinancingPutinsWar #FossilFuels #G7 #NATO #Sanctions #StandWithUkraine
energyandcleanair.org/october-2025...
Find all related CREA data here:
energyandcleanair.org/financing-pu...
#FinancingPutinsWar #FossilFuels #G7 #NATO #Sanctions #StandWithUkraine

November 13, 2025 at 2:15 PM
🇷🇺 CREA’s monthly analysis on fossil fuel exports from Russia is now available here in EN & 🇺🇦 UA soon to follow:
energyandcleanair.org/october-2025...
Find all related CREA data here:
energyandcleanair.org/financing-pu...
#FinancingPutinsWar #FossilFuels #G7 #NATO #Sanctions #StandWithUkraine
energyandcleanair.org/october-2025...
Find all related CREA data here:
energyandcleanair.org/financing-pu...
#FinancingPutinsWar #FossilFuels #G7 #NATO #Sanctions #StandWithUkraine
🚢 In October 2025, G7+ tankers transported 38% of Russian crude oil exports
⚠️ Non-sanctioned ‘shadow’ tankers accounted for 18%
⚠️ The largest share, 44%, was carried by sanctioned ‘shadow’ tankers
⚠️ 41 ‘shadow’ tankers were 20 years or older & pose serious risks
⚠️ Non-sanctioned ‘shadow’ tankers accounted for 18%
⚠️ The largest share, 44%, was carried by sanctioned ‘shadow’ tankers
⚠️ 41 ‘shadow’ tankers were 20 years or older & pose serious risks

November 13, 2025 at 2:15 PM
🚢 In October 2025, G7+ tankers transported 38% of Russian crude oil exports
⚠️ Non-sanctioned ‘shadow’ tankers accounted for 18%
⚠️ The largest share, 44%, was carried by sanctioned ‘shadow’ tankers
⚠️ 41 ‘shadow’ tankers were 20 years or older & pose serious risks
⚠️ Non-sanctioned ‘shadow’ tankers accounted for 18%
⚠️ The largest share, 44%, was carried by sanctioned ‘shadow’ tankers
⚠️ 41 ‘shadow’ tankers were 20 years or older & pose serious risks
❗In October 2025, the EU, Australia, UK & US imported EUR 971 mn of refined products from six Indian & Turkish refineries using Russian crude
❗🇦🇺 Australia’s imports saw a 140% increase to EUR 93 mn
❗🇺🇸 US imports recorded 17% increase to EUR 126.6 mn
❗🇦🇺 Australia’s imports saw a 140% increase to EUR 93 mn
❗🇺🇸 US imports recorded 17% increase to EUR 126.6 mn

November 13, 2025 at 2:15 PM
❗In October 2025, the EU, Australia, UK & US imported EUR 971 mn of refined products from six Indian & Turkish refineries using Russian crude
❗🇦🇺 Australia’s imports saw a 140% increase to EUR 93 mn
❗🇺🇸 US imports recorded 17% increase to EUR 126.6 mn
❗🇦🇺 Australia’s imports saw a 140% increase to EUR 93 mn
❗🇺🇸 US imports recorded 17% increase to EUR 126.6 mn
In October 2025, top EU importers were:
🇭🇺 Hungary
🇸🇰 Slovakia
🇫🇷 France
🇧🇪 Belgium
🇷🇴 Romania
💡 The five largest EU importers of Russian fossil fuels paid Russia EUR 938 mn for fossil fuels
⚠️ Natural gas — unsanctioned by EU — accounted for two-thirds of these imports
🇭🇺 Hungary
🇸🇰 Slovakia
🇫🇷 France
🇧🇪 Belgium
🇷🇴 Romania
💡 The five largest EU importers of Russian fossil fuels paid Russia EUR 938 mn for fossil fuels
⚠️ Natural gas — unsanctioned by EU — accounted for two-thirds of these imports

November 13, 2025 at 2:15 PM
In October 2025, top EU importers were:
🇭🇺 Hungary
🇸🇰 Slovakia
🇫🇷 France
🇧🇪 Belgium
🇷🇴 Romania
💡 The five largest EU importers of Russian fossil fuels paid Russia EUR 938 mn for fossil fuels
⚠️ Natural gas — unsanctioned by EU — accounted for two-thirds of these imports
🇭🇺 Hungary
🇸🇰 Slovakia
🇫🇷 France
🇧🇪 Belgium
🇷🇴 Romania
💡 The five largest EU importers of Russian fossil fuels paid Russia EUR 938 mn for fossil fuels
⚠️ Natural gas — unsanctioned by EU — accounted for two-thirds of these imports
In October 2025, top importers of RU fossil fuels were:
🇨🇳 China
🇮🇳 India
🇹🇷 Turkiye
🇪🇺 EU
🇰🇷 South Korea
❗Rosneft owned Vadinar refinery — now sanctioned by EU & UK — increased production to 90% capacity in Oct. 2025; RU imports up 32% month-on-month; highest since invasion
🇨🇳 China
🇮🇳 India
🇹🇷 Turkiye
🇪🇺 EU
🇰🇷 South Korea
❗Rosneft owned Vadinar refinery — now sanctioned by EU & UK — increased production to 90% capacity in Oct. 2025; RU imports up 32% month-on-month; highest since invasion

November 13, 2025 at 2:15 PM
In October 2025, top importers of RU fossil fuels were:
🇨🇳 China
🇮🇳 India
🇹🇷 Turkiye
🇪🇺 EU
🇰🇷 South Korea
❗Rosneft owned Vadinar refinery — now sanctioned by EU & UK — increased production to 90% capacity in Oct. 2025; RU imports up 32% month-on-month; highest since invasion
🇨🇳 China
🇮🇳 India
🇹🇷 Turkiye
🇪🇺 EU
🇰🇷 South Korea
❗Rosneft owned Vadinar refinery — now sanctioned by EU & UK — increased production to 90% capacity in Oct. 2025; RU imports up 32% month-on-month; highest since invasion
🇷🇺 NEW | Monthly analysis of Russian fossil fuel exports & sanctions
📉 In October 2025, revenues continue to slide to lowest levels since full-scale invasion but more to be done
❗️Sanctioned tankers transported 44% of Russian crude
📉 In October 2025, revenues continue to slide to lowest levels since full-scale invasion but more to be done
❗️Sanctioned tankers transported 44% of Russian crude

November 13, 2025 at 2:15 PM
🇷🇺 NEW | Monthly analysis of Russian fossil fuel exports & sanctions
📉 In October 2025, revenues continue to slide to lowest levels since full-scale invasion but more to be done
❗️Sanctioned tankers transported 44% of Russian crude
📉 In October 2025, revenues continue to slide to lowest levels since full-scale invasion but more to be done
❗️Sanctioned tankers transported 44% of Russian crude
🇹🇭 NEW | Report - The hidden cost of #gas: Toxic emissions from #Thailand’s power sector
The country's gas power plants' #NOX emissions exceed the total emissions of buses, motorcycles, & taxis in Bangkok Metropolitan Region
The country's gas power plants' #NOX emissions exceed the total emissions of buses, motorcycles, & taxis in Bangkok Metropolitan Region

November 13, 2025 at 2:01 AM
🇹🇭 NEW | Report - The hidden cost of #gas: Toxic emissions from #Thailand’s power sector
The country's gas power plants' #NOX emissions exceed the total emissions of buses, motorcycles, & taxis in Bangkok Metropolitan Region
The country's gas power plants' #NOX emissions exceed the total emissions of buses, motorcycles, & taxis in Bangkok Metropolitan Region
🇨🇳 📰 NEW | Analysis: #China’s #CO2 #emissions have now been flat or falling for 18 months
www.carbonbrief.org/analysis-chinas-co2-emissions-have-now-been-flat-or-falling-for-18-months/
@laurimyllyvirta.bsky.social w/ @carbonbrief.org
www.carbonbrief.org/analysis-chinas-co2-emissions-have-now-been-flat-or-falling-for-18-months/
@laurimyllyvirta.bsky.social w/ @carbonbrief.org

November 11, 2025 at 2:27 AM
🇨🇳 📰 NEW | Analysis: #China’s #CO2 #emissions have now been flat or falling for 18 months
www.carbonbrief.org/analysis-chinas-co2-emissions-have-now-been-flat-or-falling-for-18-months/
@laurimyllyvirta.bsky.social w/ @carbonbrief.org
www.carbonbrief.org/analysis-chinas-co2-emissions-have-now-been-flat-or-falling-for-18-months/
@laurimyllyvirta.bsky.social w/ @carbonbrief.org
🇨🇳 NEW | Experts think #China can exceed its new 2035 #NDCs, but are less certain about short-term #emissions cuts
Full China Climate Transition Outlook 2025 survey:
energyandcleanair.org/publication/chinas-climate-transition-outlook-2025-expert-survey/
w/ @belindaschaepe.bsky.social; Xunpeng Shi
Full China Climate Transition Outlook 2025 survey:
energyandcleanair.org/publication/chinas-climate-transition-outlook-2025-expert-survey/
w/ @belindaschaepe.bsky.social; Xunpeng Shi

November 6, 2025 at 1:27 AM
🇨🇳 NEW | Experts think #China can exceed its new 2035 #NDCs, but are less certain about short-term #emissions cuts
Full China Climate Transition Outlook 2025 survey:
energyandcleanair.org/publication/chinas-climate-transition-outlook-2025-expert-survey/
w/ @belindaschaepe.bsky.social; Xunpeng Shi
Full China Climate Transition Outlook 2025 survey:
energyandcleanair.org/publication/chinas-climate-transition-outlook-2025-expert-survey/
w/ @belindaschaepe.bsky.social; Xunpeng Shi
🏅 🌿 Shillong, in the state of Meghalaya, was the cleanest city in India in October 2025, with a monthly average PM2.5 of 10 µg/m³
💡 Besides Delhi, all other megacities, such as Chennai, Mumbai, Kolkata, and Bangalore, saw their monthly averages in Oct falling within the NAAQS
💡 Besides Delhi, all other megacities, such as Chennai, Mumbai, Kolkata, and Bangalore, saw their monthly averages in Oct falling within the NAAQS

November 4, 2025 at 4:43 AM
🏅 🌿 Shillong, in the state of Meghalaya, was the cleanest city in India in October 2025, with a monthly average PM2.5 of 10 µg/m³
💡 Besides Delhi, all other megacities, such as Chennai, Mumbai, Kolkata, and Bangalore, saw their monthly averages in Oct falling within the NAAQS
💡 Besides Delhi, all other megacities, such as Chennai, Mumbai, Kolkata, and Bangalore, saw their monthly averages in Oct falling within the NAAQS
🏅 💨 Dharuhera ranked as most polluted city in India in October 2025, recording a monthly average PM2.5 concentration of 123 µg/m³
⚠️ It exceeded the daily NAAQS limit of 60 µg/m³ on 77% of the days of the month
⚠️ It exceeded the daily NAAQS limit of 60 µg/m³ on 77% of the days of the month

November 4, 2025 at 4:43 AM
🏅 💨 Dharuhera ranked as most polluted city in India in October 2025, recording a monthly average PM2.5 concentration of 123 µg/m³
⚠️ It exceeded the daily NAAQS limit of 60 µg/m³ on 77% of the days of the month
⚠️ It exceeded the daily NAAQS limit of 60 µg/m³ on 77% of the days of the month
💡 The monthly average PM2.5 levels in all 98 National Clean Air Programme (NCAP) cities with more than 80% of days with data surpassed the WHO's daily guideline for PM2.5, while 86 cities met India's daily NAAQS

November 4, 2025 at 4:43 AM
💡 The monthly average PM2.5 levels in all 98 National Clean Air Programme (NCAP) cities with more than 80% of days with data surpassed the WHO's daily guideline for PM2.5, while 86 cities met India's daily NAAQS
🇮🇳 NEW | #India ambient #AirQuality monthly snapshot is out!
🌿📉 Air quality sharply declined across India in Oct, particularly in the NCR
💡 212 of 249 cities w/ data for over 80% of days recorded PM2.5 below India’s national standards
⚠️ Only 6 cities complied w/ @who.int
🌿📉 Air quality sharply declined across India in Oct, particularly in the NCR
💡 212 of 249 cities w/ data for over 80% of days recorded PM2.5 below India’s national standards
⚠️ Only 6 cities complied w/ @who.int

November 4, 2025 at 4:43 AM
🇮🇳 NEW | #India ambient #AirQuality monthly snapshot is out!
🌿📉 Air quality sharply declined across India in Oct, particularly in the NCR
💡 212 of 249 cities w/ data for over 80% of days recorded PM2.5 below India’s national standards
⚠️ Only 6 cities complied w/ @who.int
🌿📉 Air quality sharply declined across India in Oct, particularly in the NCR
💡 212 of 249 cities w/ data for over 80% of days recorded PM2.5 below India’s national standards
⚠️ Only 6 cities complied w/ @who.int
🇨🇳 The 4-year assessment of China’s overseas coal power projects is now available here:
energyandcleanair.org/publication/...
energyandcleanair.org/publication/...

November 3, 2025 at 12:30 AM
🇨🇳 The 4-year assessment of China’s overseas coal power projects is now available here:
energyandcleanair.org/publication/...
energyandcleanair.org/publication/...
⚠️ Yet, 12.1 GW of capacity remains under construction across 14 projects
💡 These are largely off-grid captive coal projects in Indonesia, India, Laos, Zimbabwe, and Zambia, that serve industrial needs and are owned by private Chinese companies, a loophole yet to be addressed
💡 These are largely off-grid captive coal projects in Indonesia, India, Laos, Zimbabwe, and Zambia, that serve industrial needs and are owned by private Chinese companies, a loophole yet to be addressed

November 3, 2025 at 12:30 AM
⚠️ Yet, 12.1 GW of capacity remains under construction across 14 projects
💡 These are largely off-grid captive coal projects in Indonesia, India, Laos, Zimbabwe, and Zambia, that serve industrial needs and are owned by private Chinese companies, a loophole yet to be addressed
💡 These are largely off-grid captive coal projects in Indonesia, India, Laos, Zimbabwe, and Zambia, that serve industrial needs and are owned by private Chinese companies, a loophole yet to be addressed
As of July 2025, the total capacity of overseas coal projects in the pipeline has dropped to 31.4 GW, down from nearly 50 GW in 2024
Cancellations have also accelerated, after a slowdown in 2024, with 16.4 GW of new capacity cancelled in 2025
Cancellations have also accelerated, after a slowdown in 2024, with 16.4 GW of new capacity cancelled in 2025

November 3, 2025 at 12:30 AM
As of July 2025, the total capacity of overseas coal projects in the pipeline has dropped to 31.4 GW, down from nearly 50 GW in 2024
Cancellations have also accelerated, after a slowdown in 2024, with 16.4 GW of new capacity cancelled in 2025
Cancellations have also accelerated, after a slowdown in 2024, with 16.4 GW of new capacity cancelled in 2025
🇨🇳 🇺🇳 NEW | Report: Assessing China’s overseas coal power ban 4 years on
Following President Xi's 2021 pledge of no new overseas coal projects, 59.3GW of projects have been cancelled, or 6.1bn tonnes of avoided lifetime carbon dioxide (CO₂) emissions, yet loopholes persist
Following President Xi's 2021 pledge of no new overseas coal projects, 59.3GW of projects have been cancelled, or 6.1bn tonnes of avoided lifetime carbon dioxide (CO₂) emissions, yet loopholes persist

November 3, 2025 at 12:30 AM
🇨🇳 🇺🇳 NEW | Report: Assessing China’s overseas coal power ban 4 years on
Following President Xi's 2021 pledge of no new overseas coal projects, 59.3GW of projects have been cancelled, or 6.1bn tonnes of avoided lifetime carbon dioxide (CO₂) emissions, yet loopholes persist
Following President Xi's 2021 pledge of no new overseas coal projects, 59.3GW of projects have been cancelled, or 6.1bn tonnes of avoided lifetime carbon dioxide (CO₂) emissions, yet loopholes persist