


Climate platypus
@climateplatypus.bsky.social
Climate info, Australian focus. No speculation. Just observations and scientific projections. Any opinions mine. Working in climate science.

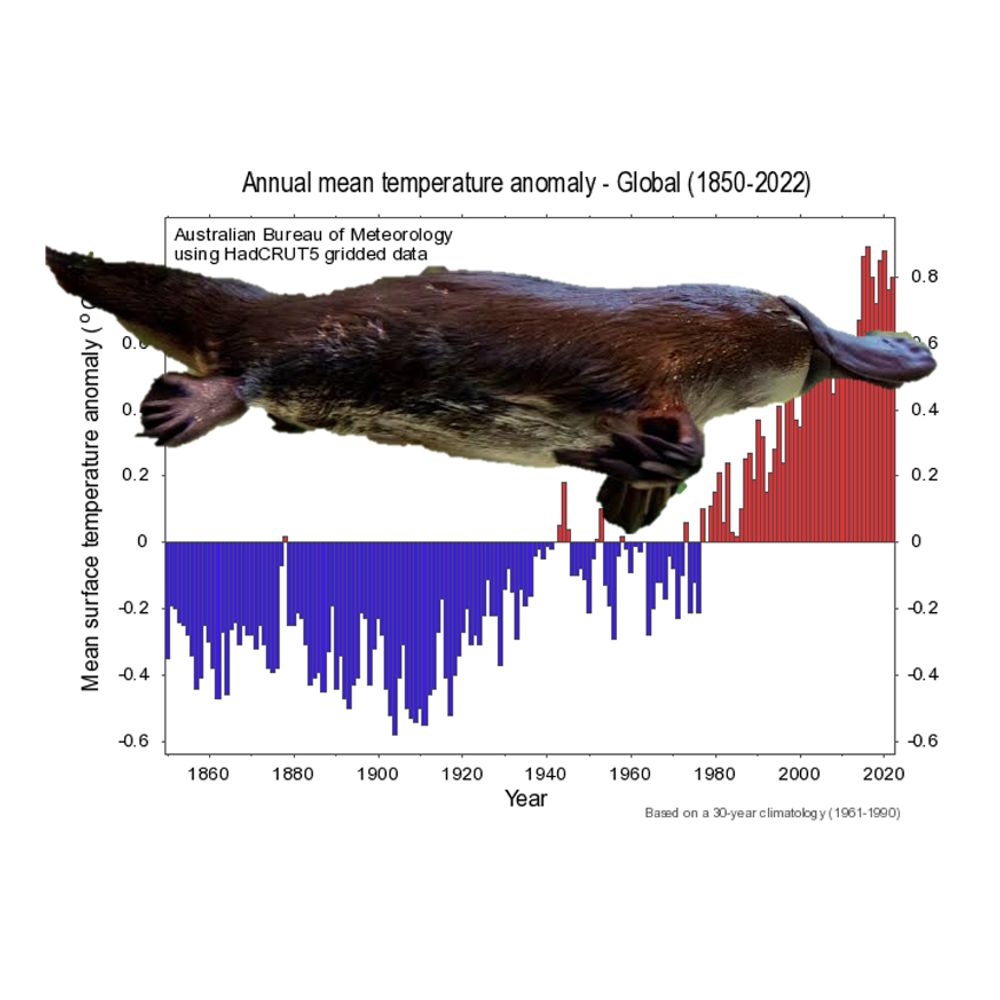
October heat records are being set across Western Australia, South Australia, Northern Territory, Queensland and New South Wales this week.

October 21, 2025 at 12:24 AM
October heat records are being set across Western Australia, South Australia, Northern Territory, Queensland and New South Wales this week.

I mean.
This is a lot.
Is it any wonder a platypus has trouble coping?
www.theguardian.com/environment/...
This is a lot.
Is it any wonder a platypus has trouble coping?
www.theguardian.com/environment/...

Victoria’s mountain ash forests could lose a quarter of giant trees as temperatures rise
Eucalyptus regnans – which regularly reach 60 to 80m tall – lose about 9% of their trees for every degree of warming, research finds
www.theguardian.com
October 16, 2025 at 2:32 AM
I mean.
This is a lot.
Is it any wonder a platypus has trouble coping?
www.theguardian.com/environment/...
This is a lot.
Is it any wonder a platypus has trouble coping?
www.theguardian.com/environment/...
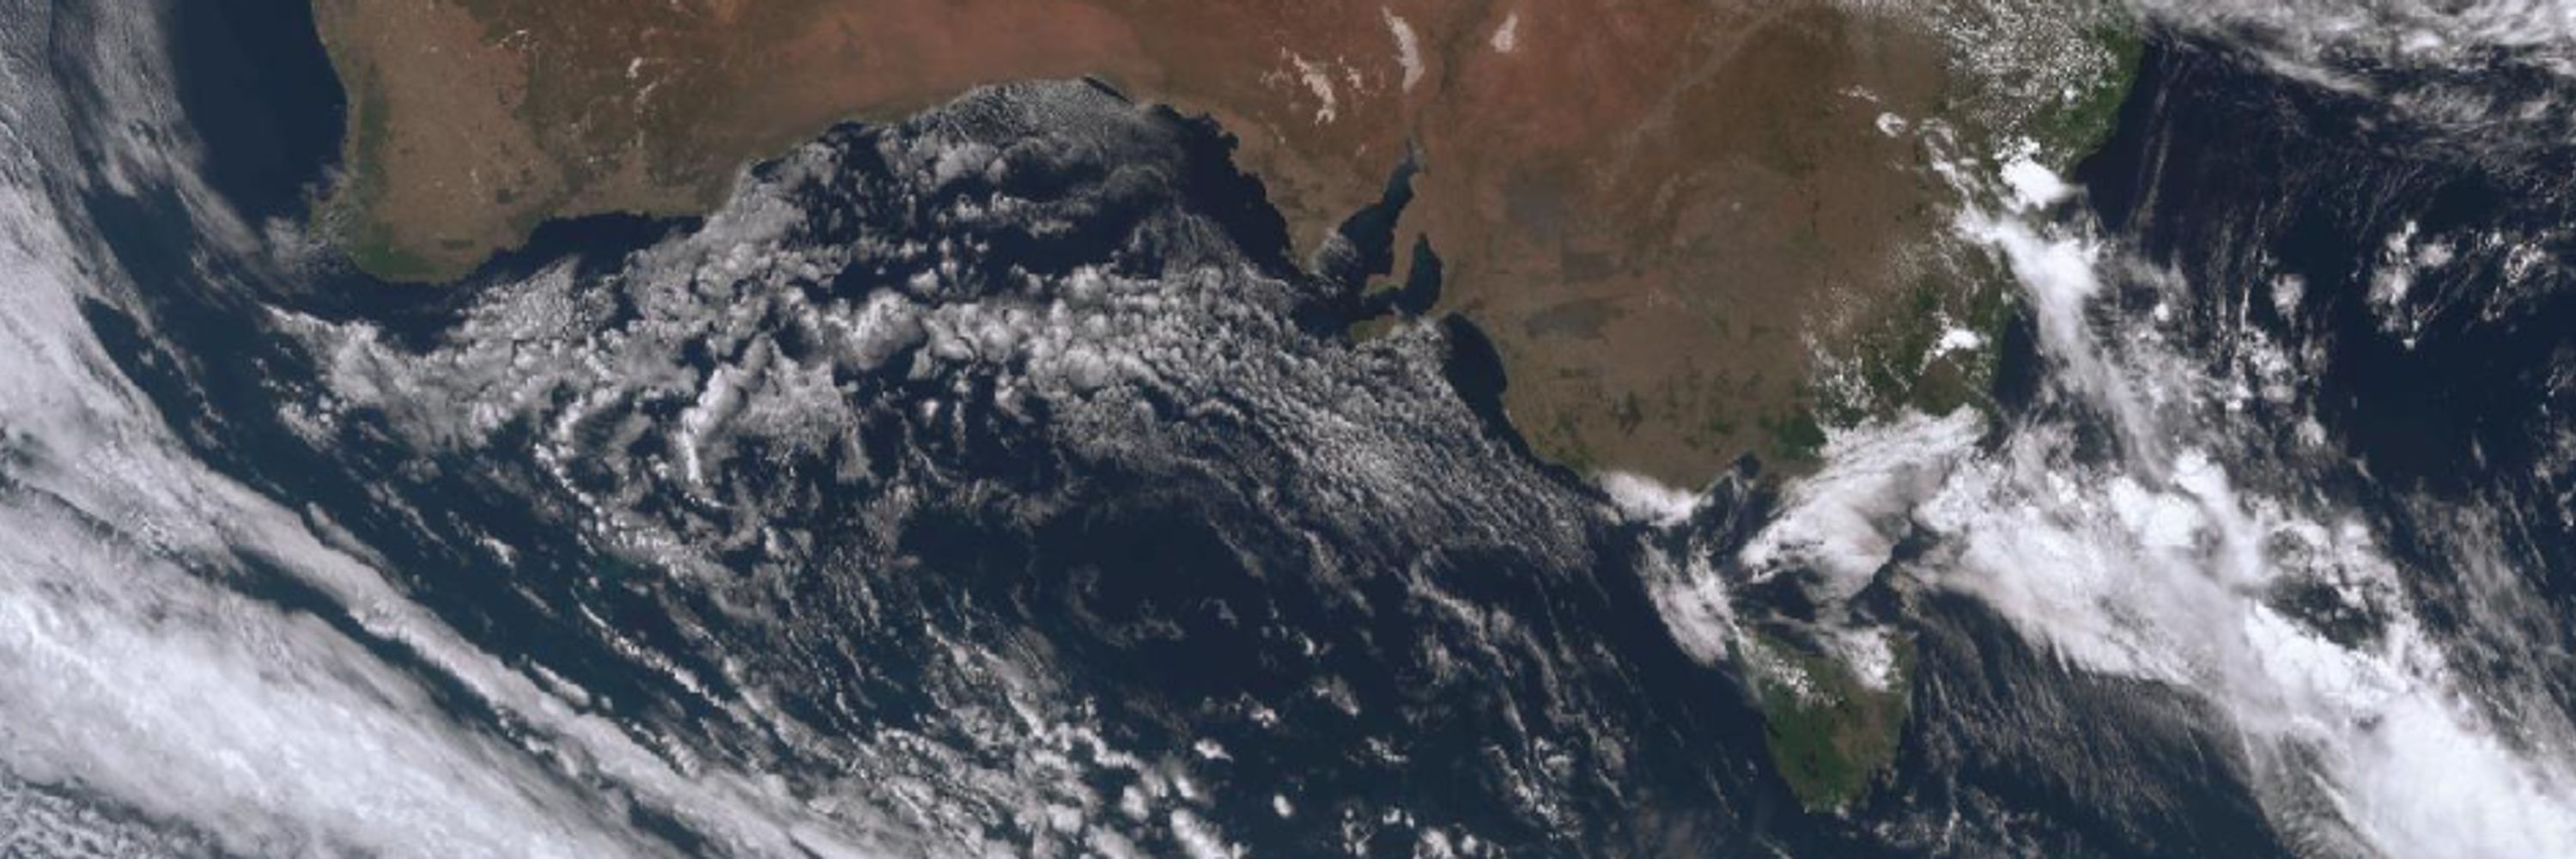
Seas are definitely warmer than usual.
www.theguardian.com/australia-ne...
www.theguardian.com/australia-ne...

Cause of Gold Coast mass fish kill unknown with marine heatwave most likely culprit, scientists say
Local community group says whatever the cause ‘kids shouldn’t be in the water’ with dead fish
www.theguardian.com
October 6, 2025 at 10:58 PM
Seas are definitely warmer than usual.
www.theguardian.com/australia-ne...
www.theguardian.com/australia-ne...
Long range forecast update. Minimum temperatures are very likely to be warmer than usual across almost the whole continent for October to December. 🔥🌏 www.bom.gov.au/climate/outl...

September 25, 2025 at 5:18 AM
Long range forecast update. Minimum temperatures are very likely to be warmer than usual across almost the whole continent for October to December. 🔥🌏 www.bom.gov.au/climate/outl...
Long-range forecast update. Maximum temperatures likely to be above average for almost all of Australia for October to December 2025. www.bom.gov.au/climate/outl...

September 25, 2025 at 5:15 AM
Long-range forecast update. Maximum temperatures likely to be above average for almost all of Australia for October to December 2025. www.bom.gov.au/climate/outl...
Long-range forecast update. Rainfall is likely to be above average for most of eastern half of Australia for Oct-December. Likely to be below average for western Tasmania. www.bom.gov.au/climate/outl...

September 25, 2025 at 5:12 AM
Long-range forecast update. Rainfall is likely to be above average for most of eastern half of Australia for Oct-December. Likely to be below average for western Tasmania. www.bom.gov.au/climate/outl...
Latest long range forecast October — December from Bureau of Meteorology. Very high chance of above average minimum temperatures for almost all of Austraila. 🔥🔥

September 18, 2025 at 7:27 AM
Latest long range forecast October — December from Bureau of Meteorology. Very high chance of above average minimum temperatures for almost all of Austraila. 🔥🔥
Latest long range forecast October — December from Bureau of Meteorology. High chance of above average maximum temperatures for much of Austraila. 🔥

September 18, 2025 at 7:26 AM
Latest long range forecast October — December from Bureau of Meteorology. High chance of above average maximum temperatures for much of Austraila. 🔥
Latest long range forecast October — December from Bureau of Meteorology. High chance of above average rainfall for much of eastern Aus and parts of northern WA.

September 18, 2025 at 7:25 AM
Latest long range forecast October — December from Bureau of Meteorology. High chance of above average rainfall for much of eastern Aus and parts of northern WA.
Sea surface temperatures greaty influence our weather and climate. Here's a plot of how Australian region sea surface temperatures for winter 2025 compared to temps from winters of previous years. 🔥🌏
www.bom.gov.au/cgi-bin/clim...
www.bom.gov.au/cgi-bin/clim...

September 15, 2025 at 3:47 AM
Sea surface temperatures greaty influence our weather and climate. Here's a plot of how Australian region sea surface temperatures for winter 2025 compared to temps from winters of previous years. 🔥🌏
www.bom.gov.au/cgi-bin/clim...
www.bom.gov.au/cgi-bin/clim...
Something called the "future climate and hazards report" is linked on this page and will be quite relevant to all of our lives whether we like it or not. www.acs.gov.au/pages/hazard...

Hazard insights
In an increasingly warming world, Australia's natural hazards are changing. The way we experience bushfires, floods, heatwaves, tropical cyclones and storms, and other hazards will be different in the...
www.acs.gov.au
September 15, 2025 at 3:40 AM
Something called the "future climate and hazards report" is linked on this page and will be quite relevant to all of our lives whether we like it or not. www.acs.gov.au/pages/hazard...
Australia's first National Climate Risk Assessment was released today. This is big because priority hazards and risks are identified. We can see what is likely to happen under different climate futures. www.acs.gov.au/pages/nation...
National Climate Risk Assessment
Learn about Australia's first National Climate Risk Assessment.
www.acs.gov.au
September 15, 2025 at 3:38 AM
Australia's first National Climate Risk Assessment was released today. This is big because priority hazards and risks are identified. We can see what is likely to happen under different climate futures. www.acs.gov.au/pages/nation...
Winter 2025: Rainfall on Melbourne's water supply catchments?
Rainfall on water supply catchments to the east of Melbourne was 60-80% of average for winter.
www.bom.gov.au/climate/curr...
Rainfall on water supply catchments to the east of Melbourne was 60-80% of average for winter.
www.bom.gov.au/climate/curr...

September 10, 2025 at 6:22 AM
Winter 2025: Rainfall on Melbourne's water supply catchments?
Rainfall on water supply catchments to the east of Melbourne was 60-80% of average for winter.
www.bom.gov.au/climate/curr...
Rainfall on water supply catchments to the east of Melbourne was 60-80% of average for winter.
www.bom.gov.au/climate/curr...
August 2025: Rainfall in Victoria?
Overall it was 35% below average and in the lowest 10% of all Augusts since 1900. Melbourne's water supply catchments received generally 40-60% of average. www.bom.gov.au/climate/curr...
Overall it was 35% below average and in the lowest 10% of all Augusts since 1900. Melbourne's water supply catchments received generally 40-60% of average. www.bom.gov.au/climate/curr...

September 10, 2025 at 6:08 AM
August 2025: Rainfall in Victoria?
Overall it was 35% below average and in the lowest 10% of all Augusts since 1900. Melbourne's water supply catchments received generally 40-60% of average. www.bom.gov.au/climate/curr...
Overall it was 35% below average and in the lowest 10% of all Augusts since 1900. Melbourne's water supply catchments received generally 40-60% of average. www.bom.gov.au/climate/curr...
August 2025: Rainfall in Tasmania??
0–20% of average for land around Orford and Triabunna. From Hobart up to Campbell Town and Freycinet, 20–40% of average. The wild rivers & southwest country 60-80% of average. Drying Tassie is a climate change signal.
www.bom.gov.au/climate/curr...
0–20% of average for land around Orford and Triabunna. From Hobart up to Campbell Town and Freycinet, 20–40% of average. The wild rivers & southwest country 60-80% of average. Drying Tassie is a climate change signal.
www.bom.gov.au/climate/curr...

September 10, 2025 at 5:58 AM
August 2025: Rainfall in Tasmania??
0–20% of average for land around Orford and Triabunna. From Hobart up to Campbell Town and Freycinet, 20–40% of average. The wild rivers & southwest country 60-80% of average. Drying Tassie is a climate change signal.
www.bom.gov.au/climate/curr...
0–20% of average for land around Orford and Triabunna. From Hobart up to Campbell Town and Freycinet, 20–40% of average. The wild rivers & southwest country 60-80% of average. Drying Tassie is a climate change signal.
www.bom.gov.au/climate/curr...
Winter 2025: Victoria received close to average rainfall. But east of Melbourne, Melbourne's drinking water catchments received generally between 60 and 80% of average.
www.bom.gov.au/climate/curr...
www.bom.gov.au/climate/curr...
September 10, 2025 at 5:43 AM
Winter 2025: Victoria received close to average rainfall. But east of Melbourne, Melbourne's drinking water catchments received generally between 60 and 80% of average.
www.bom.gov.au/climate/curr...
www.bom.gov.au/climate/curr...
Were days your winter days warm?
Yes in far north Queensland, south central Victoria and in Tasmania - where on average winter maximum temperatures in 2025 were in the warmest 10% of all years since 1910.
www.bom.gov.au/climate/curr...
Yes in far north Queensland, south central Victoria and in Tasmania - where on average winter maximum temperatures in 2025 were in the warmest 10% of all years since 1910.
www.bom.gov.au/climate/curr...

September 10, 2025 at 5:21 AM
Were days your winter days warm?
Yes in far north Queensland, south central Victoria and in Tasmania - where on average winter maximum temperatures in 2025 were in the warmest 10% of all years since 1910.
www.bom.gov.au/climate/curr...
Yes in far north Queensland, south central Victoria and in Tasmania - where on average winter maximum temperatures in 2025 were in the warmest 10% of all years since 1910.
www.bom.gov.au/climate/curr...
Did you have a wet winter? A dry winter? Here's a map of what sort of winter your part of Australia had.
Areas shown as "very much above/below" received rain in the top/bottom 10% of all years since 1900. www.bom.gov.au/climate/curr...
Areas shown as "very much above/below" received rain in the top/bottom 10% of all years since 1900. www.bom.gov.au/climate/curr...

September 10, 2025 at 5:17 AM
Did you have a wet winter? A dry winter? Here's a map of what sort of winter your part of Australia had.
Areas shown as "very much above/below" received rain in the top/bottom 10% of all years since 1900. www.bom.gov.au/climate/curr...
Areas shown as "very much above/below" received rain in the top/bottom 10% of all years since 1900. www.bom.gov.au/climate/curr...
What would you guess? Were sea surface temperatures around the world last week WARMER or COOLER than the baseline climatology of 1991-2020? 👀🔥🌏
www.bom.gov.au/climate/enso...
www.bom.gov.au/climate/enso...

September 10, 2025 at 4:58 AM
What would you guess? Were sea surface temperatures around the world last week WARMER or COOLER than the baseline climatology of 1991-2020? 👀🔥🌏
www.bom.gov.au/climate/enso...
www.bom.gov.au/climate/enso...

What about minimum temperatures? Do you think we can expect below average minimum temperatures across Australia from July to September? Nope. www.bom.gov.au/climate/outl...

July 3, 2025 at 6:22 AM
What about minimum temperatures? Do you think we can expect below average minimum temperatures across Australia from July to September? Nope. www.bom.gov.au/climate/outl...
Do you think it's likely we'll see below average maximum temperatures in Australia from July to September? Of course not. www.bom.gov.au/climate/outl...

July 3, 2025 at 6:20 AM
Do you think it's likely we'll see below average maximum temperatures in Australia from July to September? Of course not. www.bom.gov.au/climate/outl...
Latest long-range forecasts issued by Bureau of Meteorology. For July to September 2025.
Rainfall likely above average for central & eastern mainland.
Not for SE SA, western Vic, western Tassie though. Below average likely for western Tassie. www.bom.gov.au/climate/outl...
Rainfall likely above average for central & eastern mainland.
Not for SE SA, western Vic, western Tassie though. Below average likely for western Tassie. www.bom.gov.au/climate/outl...

July 3, 2025 at 6:17 AM
Latest long-range forecasts issued by Bureau of Meteorology. For July to September 2025.
Rainfall likely above average for central & eastern mainland.
Not for SE SA, western Vic, western Tassie though. Below average likely for western Tassie. www.bom.gov.au/climate/outl...
Rainfall likely above average for central & eastern mainland.
Not for SE SA, western Vic, western Tassie though. Below average likely for western Tassie. www.bom.gov.au/climate/outl...