


Cees Bassa
@cbassa.bsky.social
Astronomer at ASTRON in the Netherlands, working with the LOFAR low frequency radio telescope.
Two days too late and perhaps only funny for those speaking Dutch. (H/T Gemma Janssen.)

May 9, 2025 at 7:14 PM
Two days too late and perhaps only funny for those speaking Dutch. (H/T Gemma Janssen.)
Original paper is at ui.adsabs.harvard.edu/abs/1967AJ..... and our simulations could reproduce the observed curves for all their observing dates. The backscatter power relation we used is from Evans & Hagfors (Radar Astronomy, p306).

April 20, 2025 at 2:57 PM
Original paper is at ui.adsabs.harvard.edu/abs/1967AJ..... and our simulations could reproduce the observed curves for all their observing dates. The backscatter power relation we used is from Evans & Hagfors (Radar Astronomy, p306).
Thanks for the independent analysis! The doppler spread curve is one that we had looked at to estimate the loss in the link budget, which was about 3dB in 1Hz. Using Arecibo radar measurements of Venus from 1964 we could reproduce the delay-doppler curve from Dyce et al. 1967 (red points).

April 20, 2025 at 2:57 PM
Thanks for the independent analysis! The doppler spread curve is one that we had looked at to estimate the loss in the link budget, which was about 3dB in 1Hz. Using Arecibo radar measurements of Venus from 1964 we could reproduce the delay-doppler curve from Dyce et al. 1967 (red points).
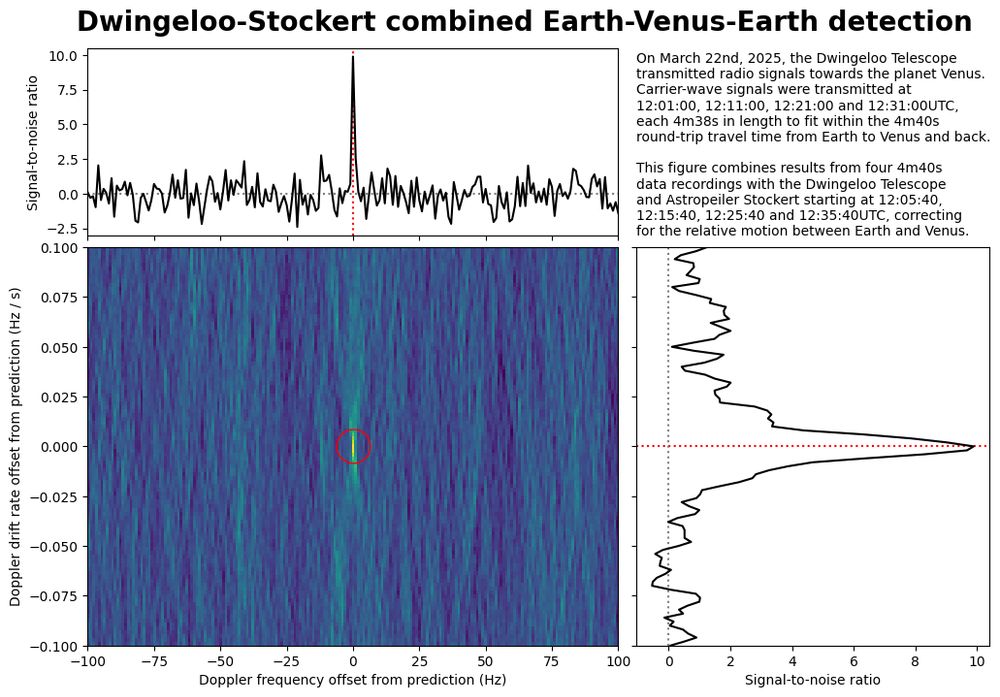
A bit late, but here is some additional analysis of the Earth-Venus-Earth radar experiments with @radiotelescoop.bsky.social from March 22nd, 2025. It takes the 4 recordings at the Dwingeloo and Stockert telescopes and searches in Doppler frequency and Doppler rates for the radar reflections.
April 10, 2025 at 7:26 PM
A bit late, but here is some additional analysis of the Earth-Venus-Earth radar experiments with @radiotelescoop.bsky.social from March 22nd, 2025. It takes the 4 recordings at the Dwingeloo and Stockert telescopes and searches in Doppler frequency and Doppler rates for the radar reflections.
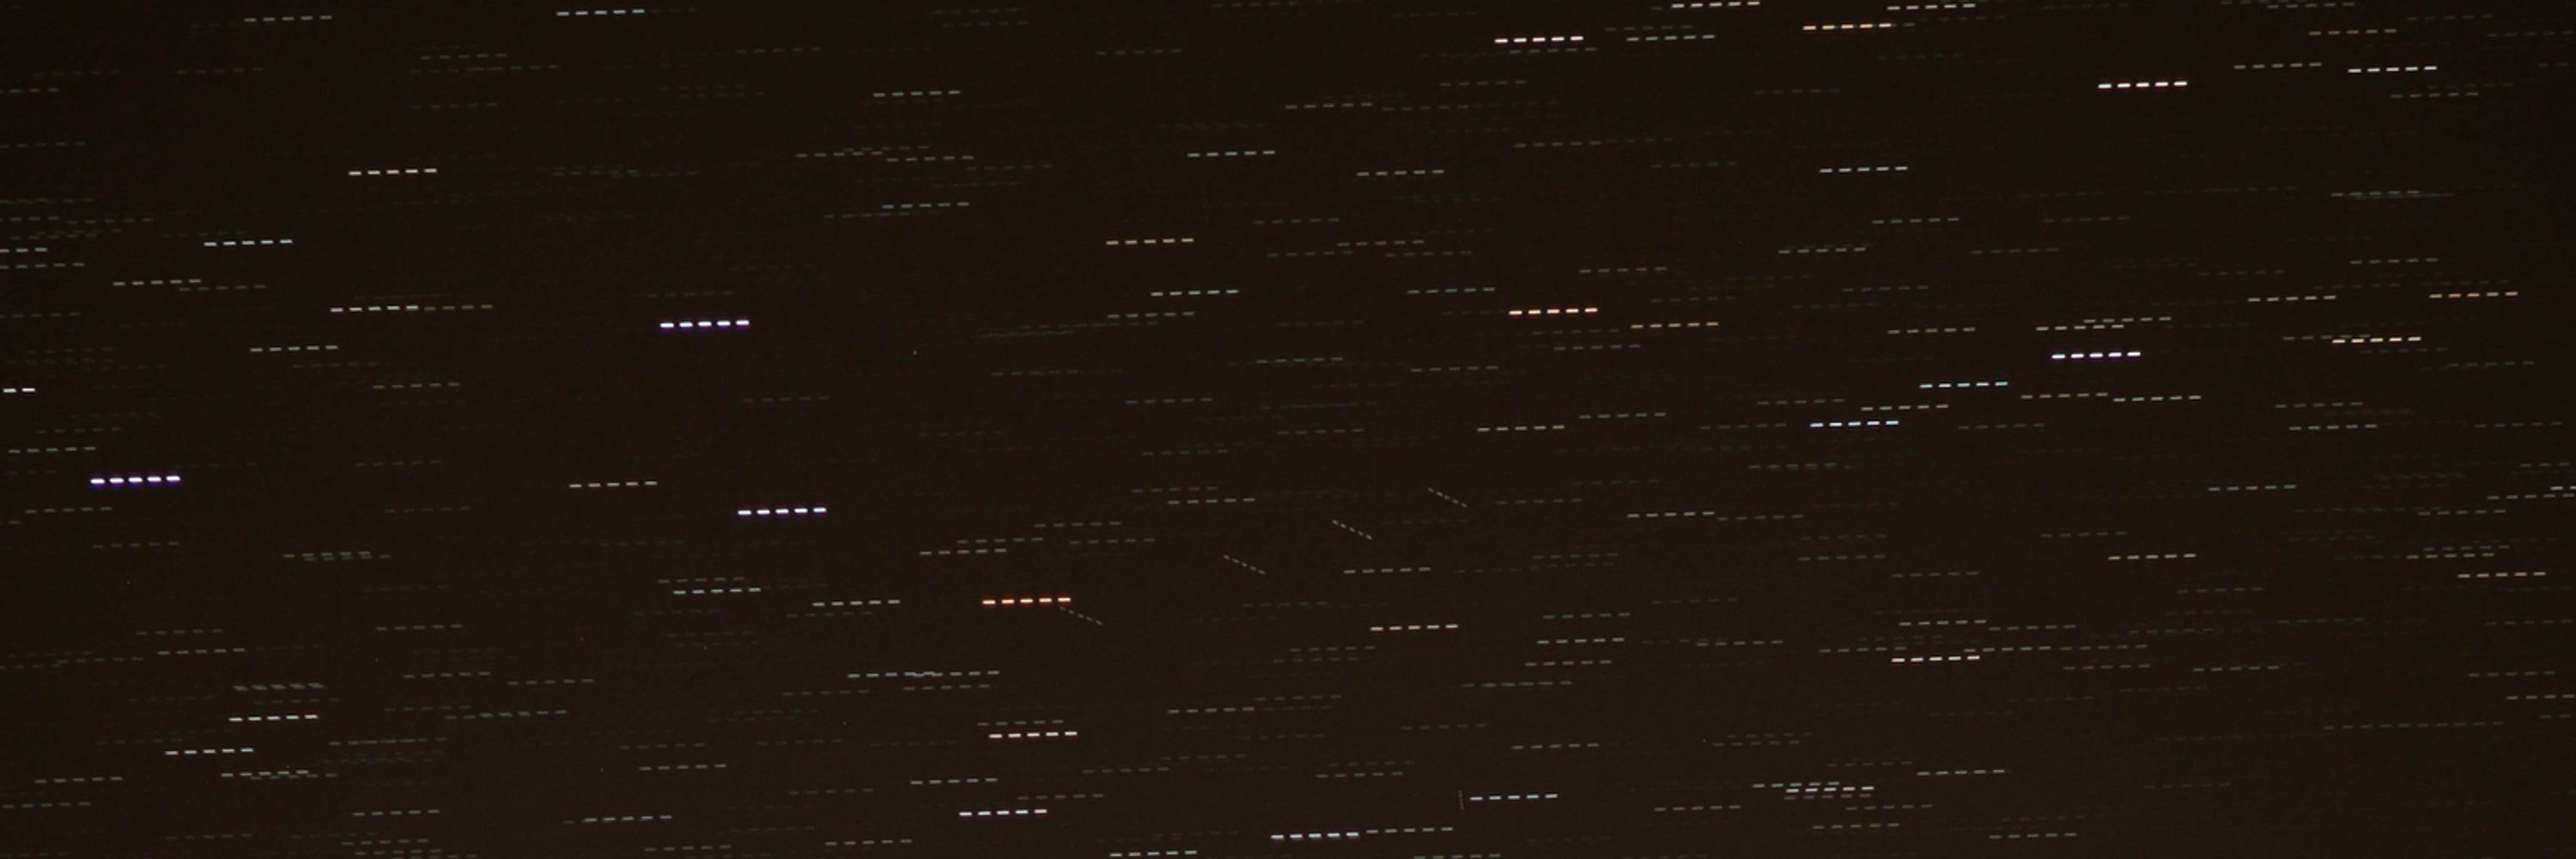
This video shows the Moon occulting several stars from the Pleiades star cluster (M45) earlier this evening. The 40 minute observing run is condensed into 40 seconds. The brightest star is Merope (23 Tau) at magnitude 4.2. Now to work through 20GB of timestamped images to extract occultation times.
April 1, 2025 at 10:11 PM
This video shows the Moon occulting several stars from the Pleiades star cluster (M45) earlier this evening. The 40 minute observing run is condensed into 40 seconds. The brightest star is Merope (23 Tau) at magnitude 4.2. Now to work through 20GB of timestamped images to extract occultation times.
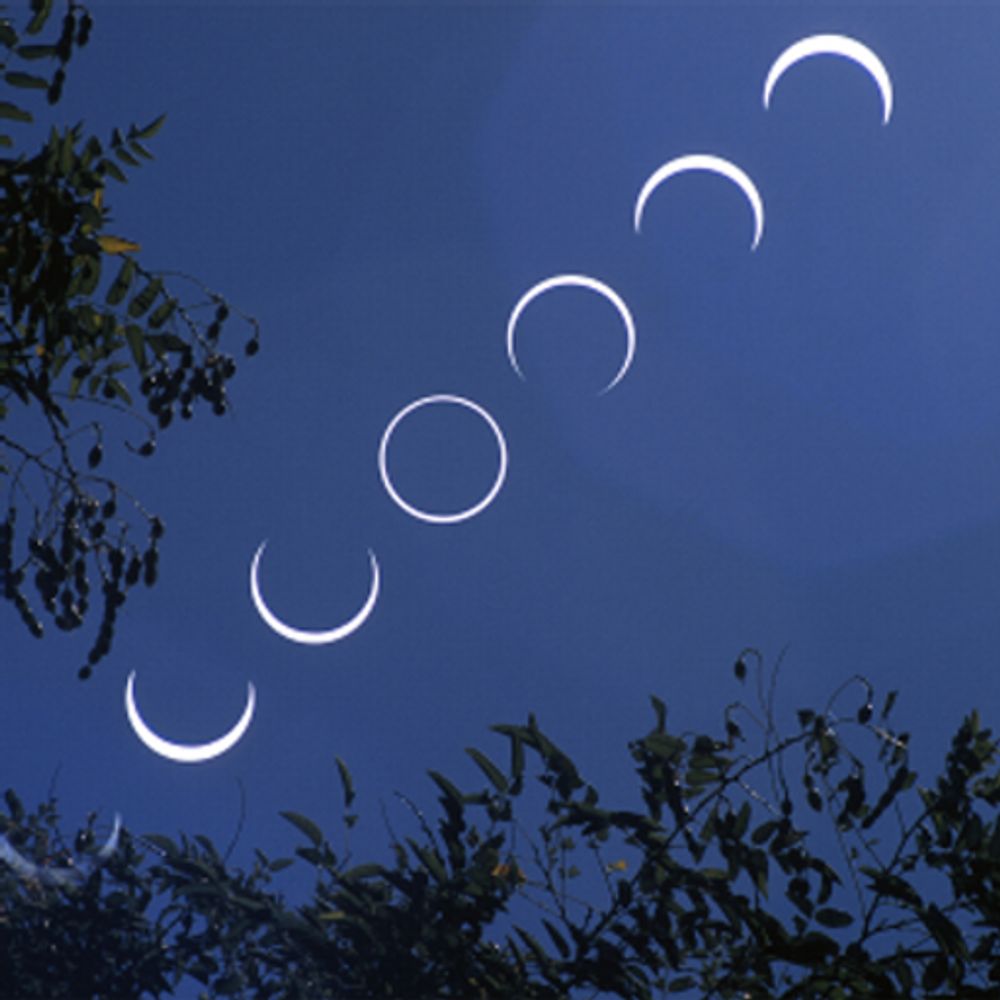
Some how I completely missed the fact that the Moon was going to occult several of the stars in the Pleiades. I managed to quickly put together a CMOS camera and a 300mm lens to capture the motion of the Moon across these stars at 10fps. Here's the occultation of the 8th magnitude star HD23361.
April 1, 2025 at 9:41 PM
Some how I completely missed the fact that the Moon was going to occult several of the stars in the Pleiades. I managed to quickly put together a CMOS camera and a 300mm lens to capture the motion of the Moon across these stars at 10fps. Here's the occultation of the 8th magnitude star HD23361.
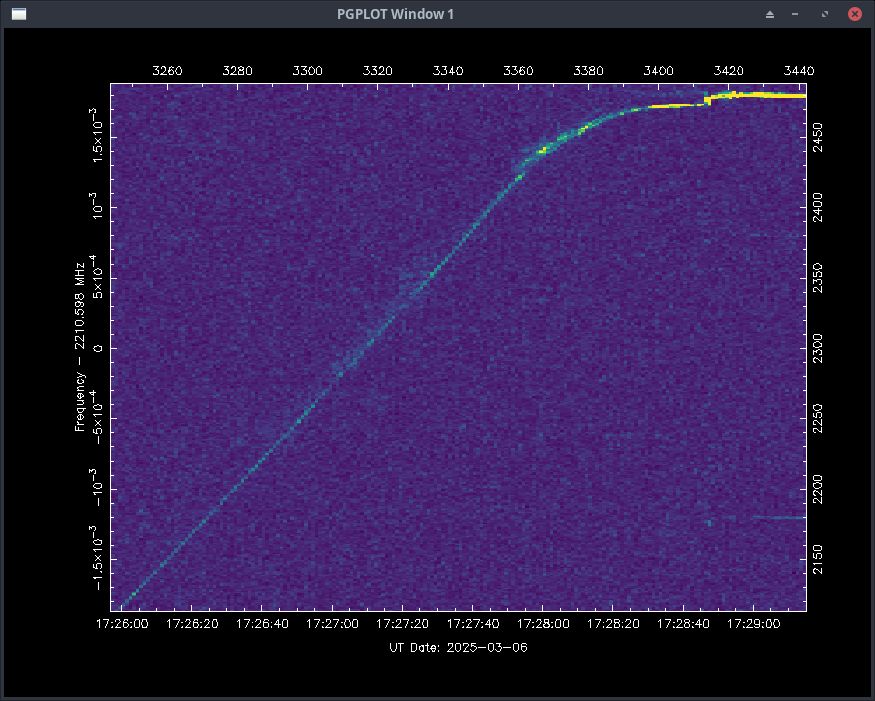
Zooming in on the final minutes of the descent burn, we can see the braking burn transitioning into a hover around 17:28UTC and then a slower descent. At 17:28:45UTC there's a jump in frequency and then a slower leveling off to the Doppler frequency of the Moon. Congratulations on the landing!
March 6, 2025 at 9:01 PM
Zooming in on the final minutes of the descent burn, we can see the braking burn transitioning into a hover around 17:28UTC and then a slower descent. At 17:28:45UTC there's a jump in frequency and then a slower leveling off to the Doppler frequency of the Moon. Congratulations on the landing!
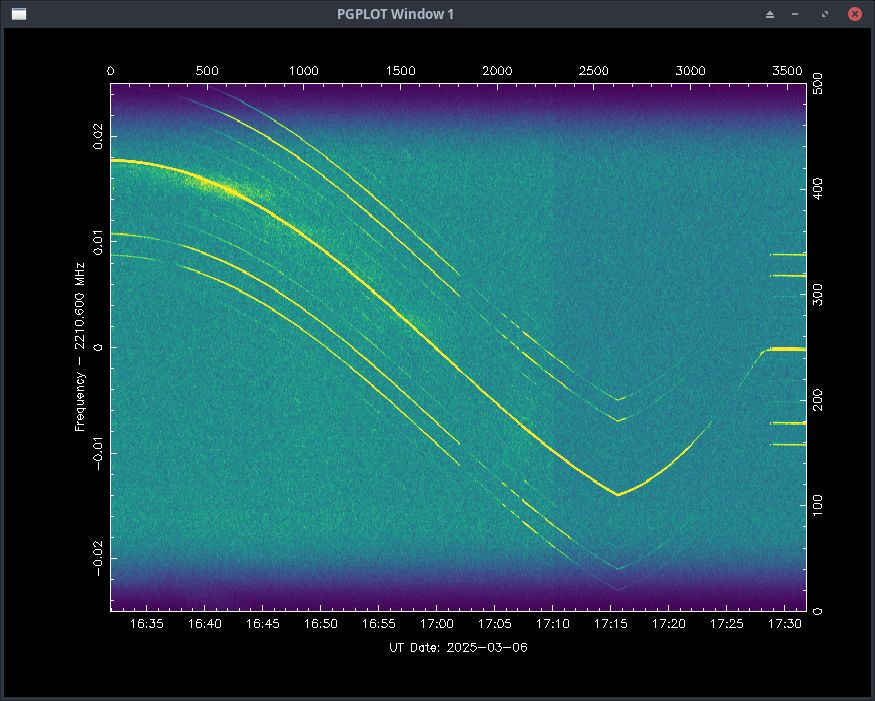
This spectrogram shows the signal from when #IM-2 emerged from behind the Moon around 16:30UTC, and then started its descent burn at 17:16UTC. The signals faded a bit during powered descent, but around 17:28:55UTC the frequency drift stopped, indicated it had successfully landed!

March 6, 2025 at 9:01 PM
This spectrogram shows the signal from when #IM-2 emerged from behind the Moon around 16:30UTC, and then started its descent burn at 17:16UTC. The signals faded a bit during powered descent, but around 17:28:55UTC the frequency drift stopped, indicated it had successfully landed!
For the second time this week, the @radiotelescoop.bsky.social had a front row seat on a lunar landing attempt. This time by @intuitivemachines.bsky.social #IM-2 lunar lander. We listed to Doppler effect on the S-band signals at 2210.6MHz during its successful descent to the lunar surface.
March 6, 2025 at 9:01 PM
For the second time this week, the @radiotelescoop.bsky.social had a front row seat on a lunar landing attempt. This time by @intuitivemachines.bsky.social #IM-2 lunar lander. We listed to Doppler effect on the S-band signals at 2210.6MHz during its successful descent to the lunar surface.
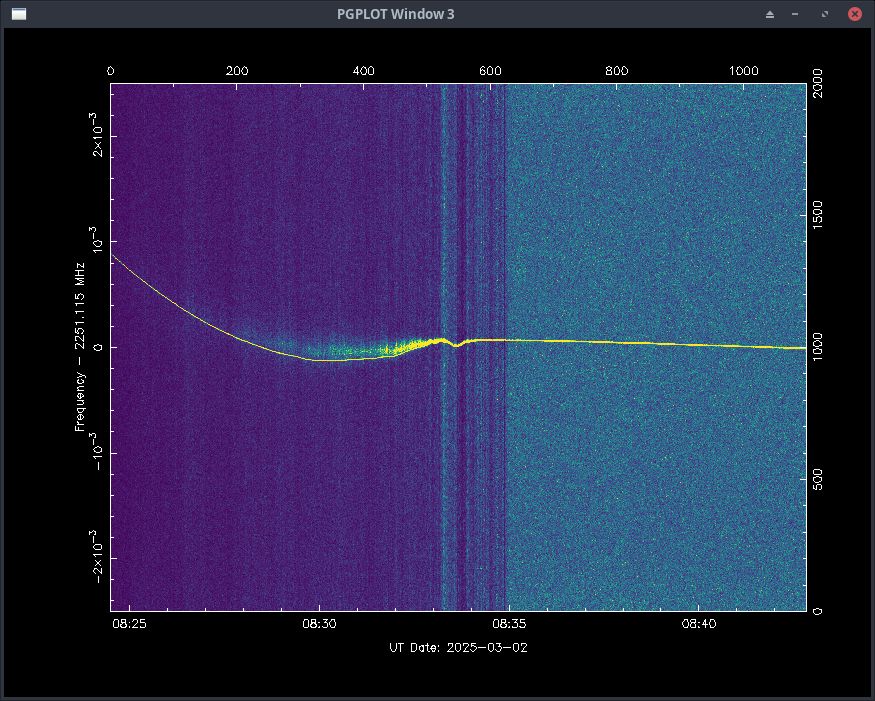
As we've seen with other spacecraft near the Moon, we also see reflected radio signals from the lunar surface as the fuzzy signals above the carrier signal from 08:26 to 08:33UTC. When the velocity of the spacecraft decreases, these signals merge with the carrier as they have the same Doppler shift.

March 2, 2025 at 1:38 PM
As we've seen with other spacecraft near the Moon, we also see reflected radio signals from the lunar surface as the fuzzy signals above the carrier signal from 08:26 to 08:33UTC. When the velocity of the spacecraft decreases, these signals merge with the carrier as they have the same Doppler shift.
The zoomed in plot shows the observed line-of-sight Doppler shift during the landing burn, until terminal guidance around 08:32UTC, and the wobble during landing guidance around 08:33UTC. Landing is at 08:34UTC and the Doppler shift then stabilizes as it follows that of the Moon.
March 2, 2025 at 1:38 PM
The zoomed in plot shows the observed line-of-sight Doppler shift during the landing burn, until terminal guidance around 08:32UTC, and the wobble during landing guidance around 08:33UTC. Landing is at 08:34UTC and the Doppler shift then stabilizes as it follows that of the Moon.
While the signal is broadband as it carries data (left plot), squaring the recorded voltages successively reveals carriers (middle and right plots). This is because the data is phase modulated, masking the carrier frequency. Squaring the data removes this and shows the carrier signal.


March 2, 2025 at 1:38 PM
While the signal is broadband as it carries data (left plot), squaring the recorded voltages successively reveals carriers (middle and right plots). This is because the data is phase modulated, masking the carrier frequency. Squaring the data removes this and shows the carrier signal.
With the #BGM-1 lander from @firefly-aerospace.bsky.social now safely on the surface of the Moon, we've had some time to take a closer look at the @radiotelescoop.bsky.social's observation of the #BGM-1 signal during the landing, which shows several events during the landing sequence.
March 2, 2025 at 1:38 PM
With the #BGM-1 lander from @firefly-aerospace.bsky.social now safely on the surface of the Moon, we've had some time to take a closer look at the @radiotelescoop.bsky.social's observation of the #BGM-1 signal during the landing, which shows several events during the landing sequence.
The radio signals show a brief dip in signal strength around the space craft pitch over just before landing around 08:35UTC and then remaining constant after the successful landing. Lunar surface operations appear to have started with a change in the signal modulation at 08:47UTC.

March 2, 2025 at 8:52 AM
The radio signals show a brief dip in signal strength around the space craft pitch over just before landing around 08:35UTC and then remaining constant after the successful landing. Lunar surface operations appear to have started with a change in the signal modulation at 08:47UTC.
Tracking the @firefly-aerospace.bsky.social Blue Ghost MIssion 1 #BGM1 lunar landing with @radiotelescoop.bsky.social. The effects of the descent burn are becoming visible in the Doppler data.

March 2, 2025 at 8:31 AM
Tracking the @firefly-aerospace.bsky.social Blue Ghost MIssion 1 #BGM1 lunar landing with @radiotelescoop.bsky.social. The effects of the descent burn are becoming visible in the Doppler data.
For those in Western Europe, check out the Western sky right now! There's some green cloud display happening. This is a video of the last 30 mins (19:30 to 20:00UTC). It's unclear to me if these are Northern Lights or some freak Noctilucent Clouds.
February 28, 2025 at 8:09 PM
For those in Western Europe, check out the Western sky right now! There's some green cloud display happening. This is a video of the last 30 mins (19:30 to 20:00UTC). It's unclear to me if these are Northern Lights or some freak Noctilucent Clouds.
Last night at 03:45UTC a Falcon 9 rocket body re-entered the Earth's atmosphere over Europe. My all sky camera caught it breaking up into several pieces and leaving luminous trails. This Falcon 9 launched Starlinks on February 1st, and apparently the upper stage did not de-orbit after launch.

February 19, 2025 at 8:04 AM
Last night at 03:45UTC a Falcon 9 rocket body re-entered the Earth's atmosphere over Europe. My all sky camera caught it breaking up into several pieces and leaving luminous trails. This Falcon 9 launched Starlinks on February 1st, and apparently the upper stage did not de-orbit after launch.
To clarify what is exactly happening, this figure compares the keogram with predictions for rise and set times of the Sun and the Moon.

January 4, 2025 at 4:36 PM
To clarify what is exactly happening, this figure compares the keogram with predictions for rise and set times of the Sun and the Moon.
Combining the 8.4 million individual exposures (2TB of data) into a single keogram covering the 4 years from 2021 upto 2025 shows the repeated change in length of the night, and also highlights the small differences in sunset and sunrise times due to the eccentric orbit of the Earth around the Sun.

January 4, 2025 at 2:45 PM
Combining the 8.4 million individual exposures (2TB of data) into a single keogram covering the 4 years from 2021 upto 2025 shows the repeated change in length of the night, and also highlights the small differences in sunset and sunrise times due to the eccentric orbit of the Earth around the Sun.
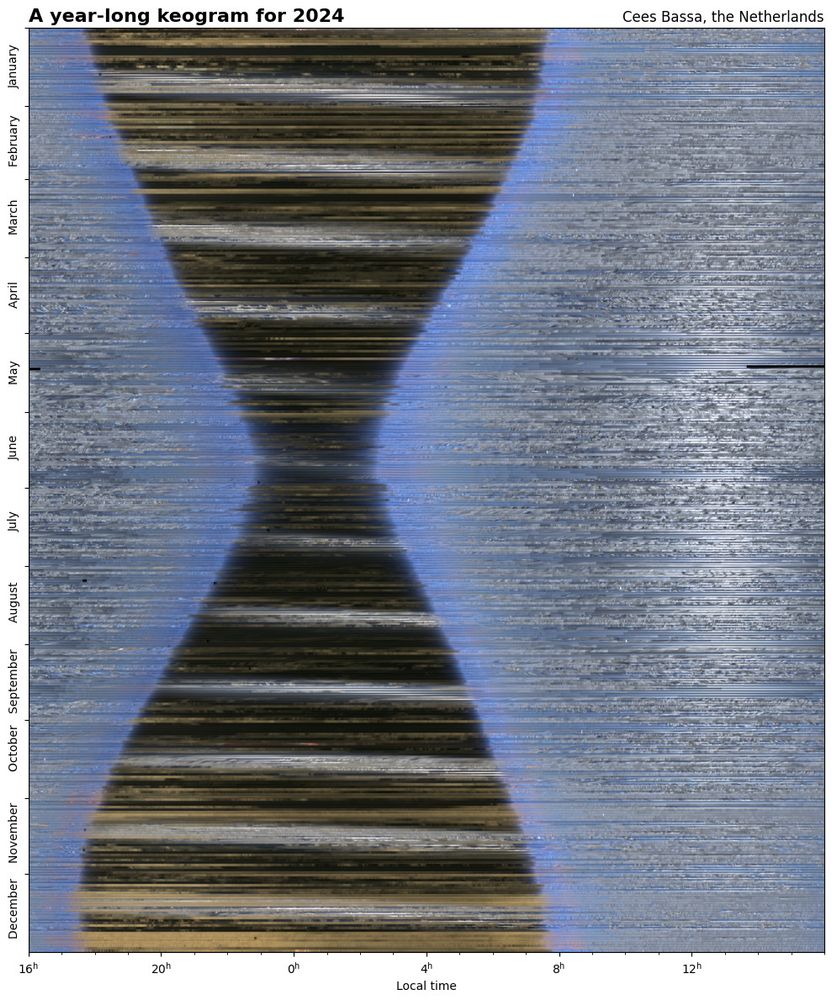
It is interesting to compare the shape of the 4 separate year-long keograms. The shape of the hourglass stays the same, but the diagonal bands of the Moon moving over the sky change from year to year.


January 4, 2025 at 2:39 PM
It is interesting to compare the shape of the 4 separate year-long keograms. The shape of the hourglass stays the same, but the diagonal bands of the Moon moving over the sky change from year to year.
The all-sky camera consists of a ZWO ASI178MC color camera with a 2.5mm F/1.2 fish-eye lens. A small Raspberry Pi computer operates the camera and sets the exposure time and camera gain based on the sky brightness. It also controls a dew heater and a fan to prevent condensation on the acrylic dome.

January 4, 2025 at 2:32 PM
The all-sky camera consists of a ZWO ASI178MC color camera with a 2.5mm F/1.2 fish-eye lens. A small Raspberry Pi computer operates the camera and sets the exposure time and camera gain based on the sky brightness. It also controls a dew heater and a fan to prevent condensation on the acrylic dome.
During 2024 there were two nights with Northern Lights that were relatively clear. The keograms of those nights captured the colors and motion of the Aurora Borealis. Keograms were specifically designed to study the Aurora: victoriaweather.ca/keogram.php.


January 4, 2025 at 2:20 PM
During 2024 there were two nights with Northern Lights that were relatively clear. The keograms of those nights captured the colors and motion of the Aurora Borealis. Keograms were specifically designed to study the Aurora: victoriaweather.ca/keogram.php.
Similarly, the stars move across the sky. During June, when the nights on the Northern hemisphere are short and the sky does not fully darken, the bright star Vega is high in the sky. Over these 12 daily keograms, we see Vega moving slowly left by 4 minutes every day.

January 4, 2025 at 2:13 PM
Similarly, the stars move across the sky. During June, when the nights on the Northern hemisphere are short and the sky does not fully darken, the bright star Vega is high in the sky. Over these 12 daily keograms, we see Vega moving slowly left by 4 minutes every day.
Zooming in on the daily keograms, the motion of celestial objects becomes clear. These daily keograms from January 16th to February 2nd 2024 show the Moon moving across the sky. It starts at sunset near first quarter, culminates around full moon, and ends at sunrise near last quarter.

January 4, 2025 at 2:13 PM
Zooming in on the daily keograms, the motion of celestial objects becomes clear. These daily keograms from January 16th to February 2nd 2024 show the Moon moving across the sky. It starts at sunset near first quarter, culminates around full moon, and ends at sunrise near last quarter.
The year-long keogram is constructed from daily keograms, where each daily keogram takes the central pixel column of the all-sky images of each successive image to show motion in the sky. This video shows the all-sky images for a 24h time span and the resulting keogram shown below.
January 4, 2025 at 1:59 PM
The year-long keogram is constructed from daily keograms, where each daily keogram takes the central pixel column of the all-sky images of each successive image to show motion in the sky. This video shows the all-sky images for a 24h time span and the resulting keogram shown below.