


Jessi Cacioppo
@cacioppoj.bsky.social
Data analyst | Math enthusiast
Reposted by Jessi Cacioppo

UC Love Data Week is next week! Advance your data skills with free virtual workshops hosted by UC Davis DataLab and fellow UC data orgs. DataLab and UC Davis Library session topics include data cleaning, data repository finders, AI, and data visualization. Register now: buff.ly/YEc3muC

February 2, 2026 at 7:16 PM
UC Love Data Week is next week! Advance your data skills with free virtual workshops hosted by UC Davis DataLab and fellow UC data orgs. DataLab and UC Davis Library session topics include data cleaning, data repository finders, AI, and data visualization. Register now: buff.ly/YEc3muC
Reposted by Jessi Cacioppo

Ever wanted to learn #Shiny but felt overwhelmed?
✨ A gRadual Intro to Shiny ✨
A beginner-friendly workshop with Ted Laderas that starts simple and builds up gRadually.
📅 Feb 17, 2026
⏰ 8:00–9:30 AM PST / 4:00–5:30 PM UTC
🌐 Online
#RLadies #RStats #Shiny #DataScience
✨ A gRadual Intro to Shiny ✨
A beginner-friendly workshop with Ted Laderas that starts simple and builds up gRadually.
📅 Feb 17, 2026
⏰ 8:00–9:30 AM PST / 4:00–5:30 PM UTC
🌐 Online
#RLadies #RStats #Shiny #DataScience

February 4, 2026 at 10:19 AM
Ever wanted to learn #Shiny but felt overwhelmed?
✨ A gRadual Intro to Shiny ✨
A beginner-friendly workshop with Ted Laderas that starts simple and builds up gRadually.
📅 Feb 17, 2026
⏰ 8:00–9:30 AM PST / 4:00–5:30 PM UTC
🌐 Online
#RLadies #RStats #Shiny #DataScience
✨ A gRadual Intro to Shiny ✨
A beginner-friendly workshop with Ted Laderas that starts simple and builds up gRadually.
📅 Feb 17, 2026
⏰ 8:00–9:30 AM PST / 4:00–5:30 PM UTC
🌐 Online
#RLadies #RStats #Shiny #DataScience
Reposted by Jessi Cacioppo

🎨 Event Alert: Enhance your ggplot2 Data Visualization Skills! 📅 Join expert Nicola Rennie, author of “The Art of Visualization with ggplot2.” Learn to craft effective R visuals from exploring data to polishing charts. 🗓️ RSVP here: www.meetup.com/rladies-rome... #DataViz #RStats

Developing your data visualisation skills in ggplot2, Tue, Nov 4, 2025, 6:00 PM | Meetup
In this session, we'll be working through the process of developing a visualisation in ggplot2. We'll start with a brand new dataset and create some exploratory plots; sket
www.meetup.com
November 3, 2025 at 8:53 AM
🎨 Event Alert: Enhance your ggplot2 Data Visualization Skills! 📅 Join expert Nicola Rennie, author of “The Art of Visualization with ggplot2.” Learn to craft effective R visuals from exploring data to polishing charts. 🗓️ RSVP here: www.meetup.com/rladies-rome... #DataViz #RStats
Reposted by Jessi Cacioppo

I'll be running a free, online workshop at @rinpharma.bsky.social on Nov 3rd!
If you've never built an #RStats package before, or if you want to learn some tips to make better packages, come along to build a package together! 📦
⏰ 10am EST / 3pm GMT
#RPharma
If you've never built an #RStats package before, or if you want to learn some tips to make better packages, come along to build a package together! 📦
⏰ 10am EST / 3pm GMT
#RPharma

📣 The schedule for R/Pharma Conf 2025 are out!
Register here for Free on the zoom platform : events.zoom.us/ev/Ai-geyS63...
🗓️ ROW : rpharma-2025.sessionize.com/schedule
🗓️ APAC : rpharma-2025.sessionize.com/schedule
Workshops : Nov 3, 4, 7
Talks : Nov 5, 6
rinpharma.com
Register here for Free on the zoom platform : events.zoom.us/ev/Ai-geyS63...
🗓️ ROW : rpharma-2025.sessionize.com/schedule
🗓️ APAC : rpharma-2025.sessionize.com/schedule
Workshops : Nov 3, 4, 7
Talks : Nov 5, 6
rinpharma.com

R/Pharma 2025
events.zoom.us
October 23, 2025 at 9:14 PM
I'll be running a free, online workshop at @rinpharma.bsky.social on Nov 3rd!
If you've never built an #RStats package before, or if you want to learn some tips to make better packages, come along to build a package together! 📦
⏰ 10am EST / 3pm GMT
#RPharma
If you've never built an #RStats package before, or if you want to learn some tips to make better packages, come along to build a package together! 📦
⏰ 10am EST / 3pm GMT
#RPharma
Reposted by Jessi Cacioppo

R-Ladies and its chapters share so many amazing recordings!
Interested in seeing what they are and how to watch them?
🔍 Check out the R-Ladies YouTube Video Feed
🔗 ivelasq.github.io/rladies-vide...
Made with flexdashboard + GitHub Actions!
🧑🏫 Tutorial here: ivelasq.rbind.io/blog/automat...
Interested in seeing what they are and how to watch them?
🔍 Check out the R-Ladies YouTube Video Feed
🔗 ivelasq.github.io/rladies-vide...
Made with flexdashboard + GitHub Actions!
🧑🏫 Tutorial here: ivelasq.rbind.io/blog/automat...

September 24, 2025 at 5:08 PM
R-Ladies and its chapters share so many amazing recordings!
Interested in seeing what they are and how to watch them?
🔍 Check out the R-Ladies YouTube Video Feed
🔗 ivelasq.github.io/rladies-vide...
Made with flexdashboard + GitHub Actions!
🧑🏫 Tutorial here: ivelasq.rbind.io/blog/automat...
Interested in seeing what they are and how to watch them?
🔍 Check out the R-Ladies YouTube Video Feed
🔗 ivelasq.github.io/rladies-vide...
Made with flexdashboard + GitHub Actions!
🧑🏫 Tutorial here: ivelasq.rbind.io/blog/automat...
Reposted by Jessi Cacioppo

Hello #dataBS (& especially #TidyTuesday) fam! I'm trying to organize a thing to help me keep TidyTuesday running smoothly, but first I need to get a bit of a runway. Every week I curate a TT dataset, and it's wearing me down. Please see github.com/rfordatascie... for some ways you can help! #RStats
August 15, 2025 at 11:23 AM
Hello #dataBS (& especially #TidyTuesday) fam! I'm trying to organize a thing to help me keep TidyTuesday running smoothly, but first I need to get a bit of a runway. Every week I curate a TT dataset, and it's wearing me down. Please see github.com/rfordatascie... for some ways you can help! #RStats
Reposted by Jessi Cacioppo
Last but very definitely not least in the #useR2025 ⚡️talks: @vincentab.bsky.social showing us the power of {tinytable}!
IMHO: {gt} is king for fancy reproducible html tables, but {tinytable} should be the go-to for quick formatting and other file formats.
vincentarelbundock.github.io/tinytable/
IMHO: {gt} is king for fancy reproducible html tables, but {tinytable} should be the go-to for quick formatting and other file formats.
vincentarelbundock.github.io/tinytable/

August 10, 2025 at 3:33 PM
Last but very definitely not least in the #useR2025 ⚡️talks: @vincentab.bsky.social showing us the power of {tinytable}!
IMHO: {gt} is king for fancy reproducible html tables, but {tinytable} should be the go-to for quick formatting and other file formats.
vincentarelbundock.github.io/tinytable/
IMHO: {gt} is king for fancy reproducible html tables, but {tinytable} should be the go-to for quick formatting and other file formats.
vincentarelbundock.github.io/tinytable/
Reposted by Jessi Cacioppo
The virtual useR! 2025 event is happening tomorrow (August 1). There's still time to register. Claim your spot, for free, before time runs out!
The program: user2025.r-project.org/program/virt...
Registration: user2025.r-project.org/register
#useR2025 #rstats
The program: user2025.r-project.org/program/virt...
Registration: user2025.r-project.org/register
#useR2025 #rstats
July 31, 2025 at 12:05 PM
The virtual useR! 2025 event is happening tomorrow (August 1). There's still time to register. Claim your spot, for free, before time runs out!
The program: user2025.r-project.org/program/virt...
Registration: user2025.r-project.org/register
#useR2025 #rstats
The program: user2025.r-project.org/program/virt...
Registration: user2025.r-project.org/register
#useR2025 #rstats
Day 30 of the #30DayChartChallenge - National Geographic
IUCN Red List data on species threatened with extinction
Made using #rstats with helpful tips from Albert Rapp on using symbols in the subtitle instead of a legend
www.youtube.com/watch?v=X1gk...
albert-rapp.de/posts/ggplot...
IUCN Red List data on species threatened with extinction
Made using #rstats with helpful tips from Albert Rapp on using symbols in the subtitle instead of a legend
www.youtube.com/watch?v=X1gk...
albert-rapp.de/posts/ggplot...

April 30, 2025 at 11:10 PM
Day 30 of the #30DayChartChallenge - National Geographic
IUCN Red List data on species threatened with extinction
Made using #rstats with helpful tips from Albert Rapp on using symbols in the subtitle instead of a legend
www.youtube.com/watch?v=X1gk...
albert-rapp.de/posts/ggplot...
IUCN Red List data on species threatened with extinction
Made using #rstats with helpful tips from Albert Rapp on using symbols in the subtitle instead of a legend
www.youtube.com/watch?v=X1gk...
albert-rapp.de/posts/ggplot...
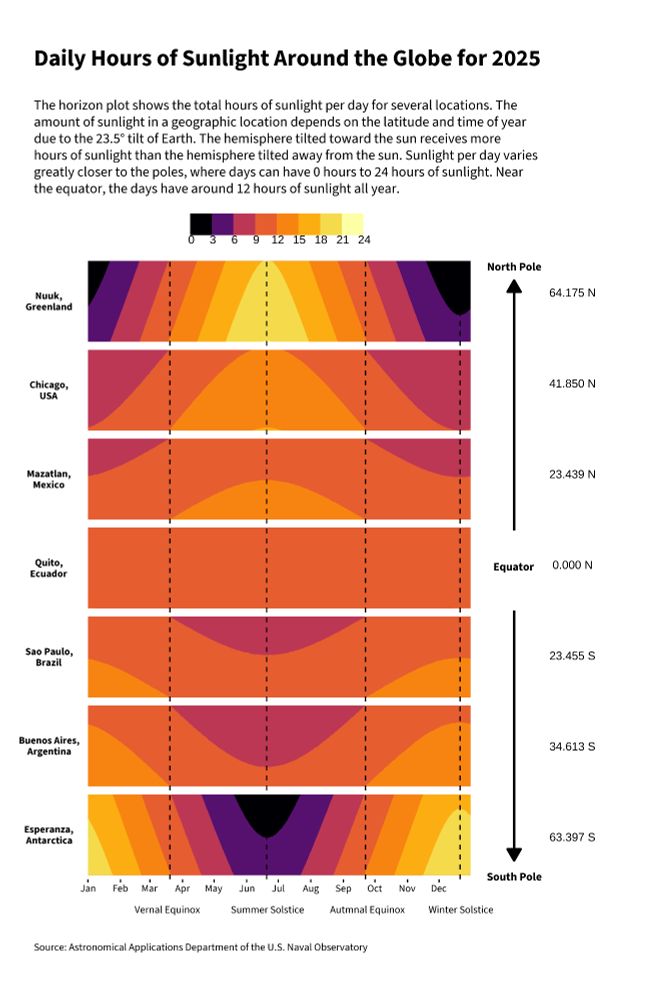
Day 22 of the #30DayChartChallenge - Stars 🌟
Daily hours of sunlight ☀️ for places at different latitudes
Made with #rstats {ggHoriPlot} for the horizon plot and {cowplot} to assemble the pieces
Daily hours of sunlight ☀️ for places at different latitudes
Made with #rstats {ggHoriPlot} for the horizon plot and {cowplot} to assemble the pieces
April 23, 2025 at 5:09 AM
Day 22 of the #30DayChartChallenge - Stars 🌟
Daily hours of sunlight ☀️ for places at different latitudes
Made with #rstats {ggHoriPlot} for the horizon plot and {cowplot} to assemble the pieces
Daily hours of sunlight ☀️ for places at different latitudes
Made with #rstats {ggHoriPlot} for the horizon plot and {cowplot} to assemble the pieces
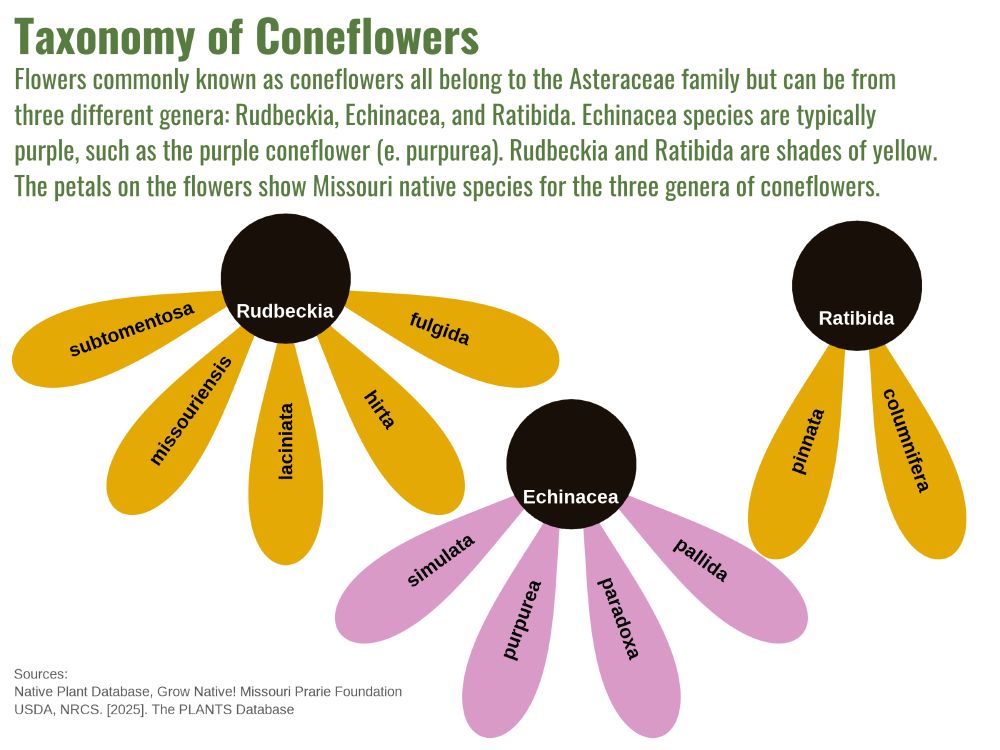
Day 14 of the #30DayChartChallenge - Kinship
Taxonomic relationship of Missouri native coneflowers
This started out as a quick flowchart in #Rstats until I realized that playing around with coord_polar would make my chart look like an actual coneflower.
Taxonomic relationship of Missouri native coneflowers
This started out as a quick flowchart in #Rstats until I realized that playing around with coord_polar would make my chart look like an actual coneflower.
April 15, 2025 at 5:14 AM
Day 14 of the #30DayChartChallenge - Kinship
Taxonomic relationship of Missouri native coneflowers
This started out as a quick flowchart in #Rstats until I realized that playing around with coord_polar would make my chart look like an actual coneflower.
Taxonomic relationship of Missouri native coneflowers
This started out as a quick flowchart in #Rstats until I realized that playing around with coord_polar would make my chart look like an actual coneflower.
Day 13 of the #30DayChartChallenge - Clusters
Looking at the heights vs spread of Missouri native plants 🌿
I tried out using #rstats {ggh4x} and {cowplot} packages to fill the empty facet with text.
Looking at the heights vs spread of Missouri native plants 🌿
I tried out using #rstats {ggh4x} and {cowplot} packages to fill the empty facet with text.
April 13, 2025 at 8:22 PM
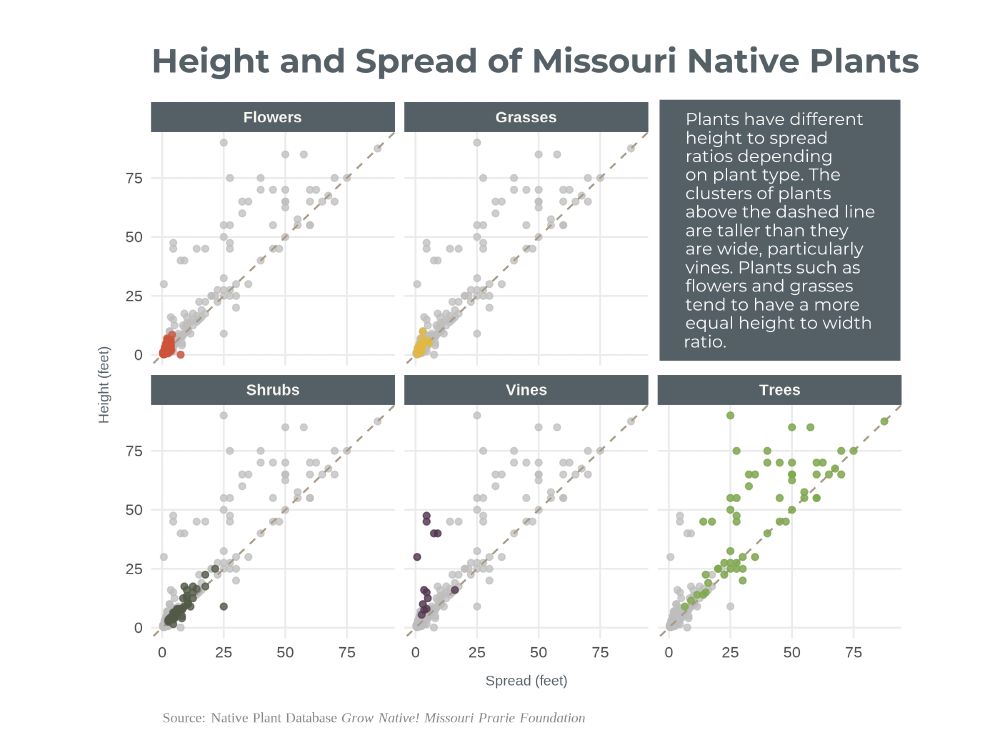
Day 13 of the #30DayChartChallenge - Clusters
Looking at the heights vs spread of Missouri native plants 🌿
I tried out using #rstats {ggh4x} and {cowplot} packages to fill the empty facet with text.
Looking at the heights vs spread of Missouri native plants 🌿
I tried out using #rstats {ggh4x} and {cowplot} packages to fill the empty facet with text.
April 11, 2025 at 2:33 PM
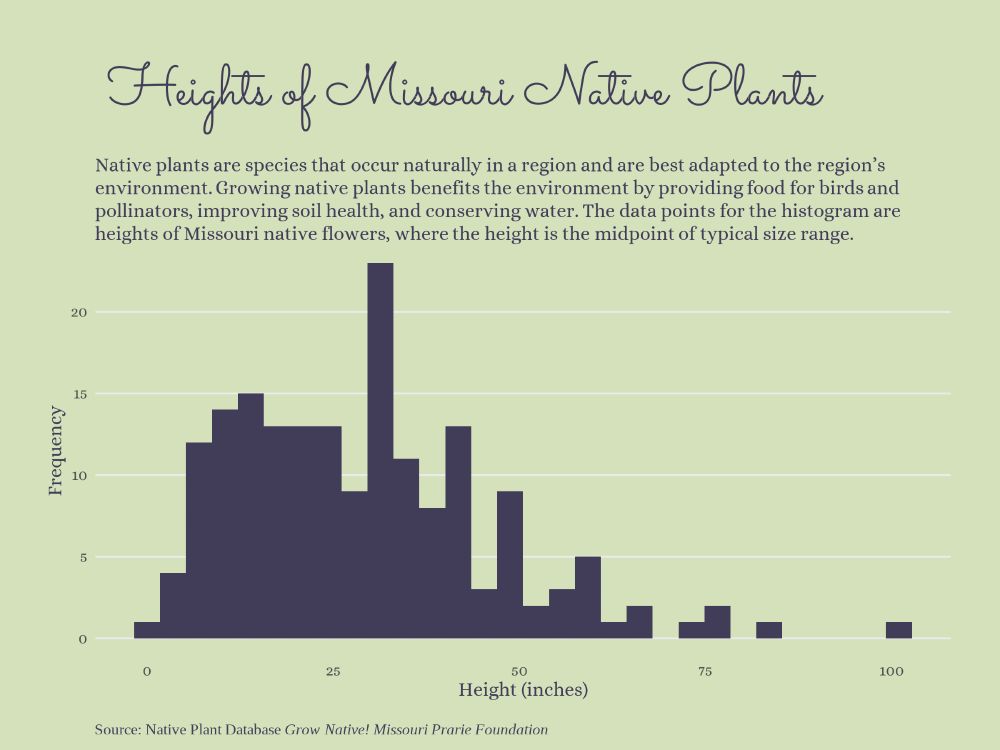
Day 8 of the #30DayChartChallenge - Histogram
April 8, 2025 at 2:48 PM
Day 8 of the #30DayChartChallenge - Histogram
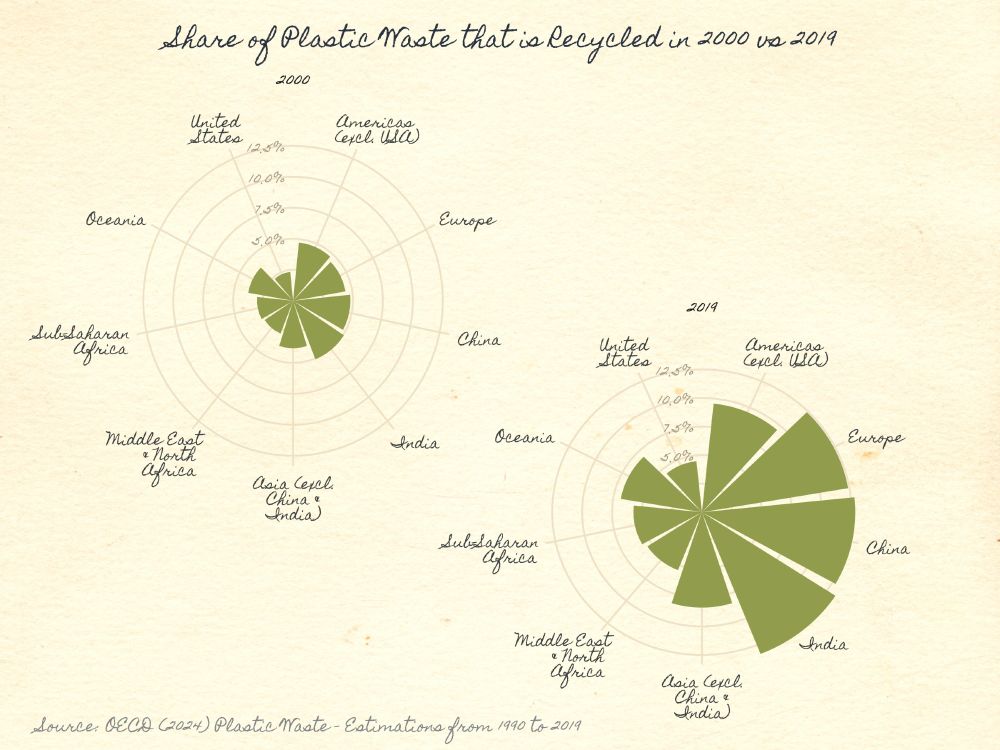
Day 6 of the #30DayChartChallenge Florence Nightingale (theme day)
April 6, 2025 at 5:59 PM
Day 6 of the #30DayChartChallenge Florence Nightingale (theme day)