


Ahmad Barclay
@bothness.bsky.social
Architect // #DataViz storyteller // UX coder. Making useful stuff with #OpenData at the ONS. Occasionally #PalOpenMaps. Views my own. Portfolio @ ahmadbarclay.com
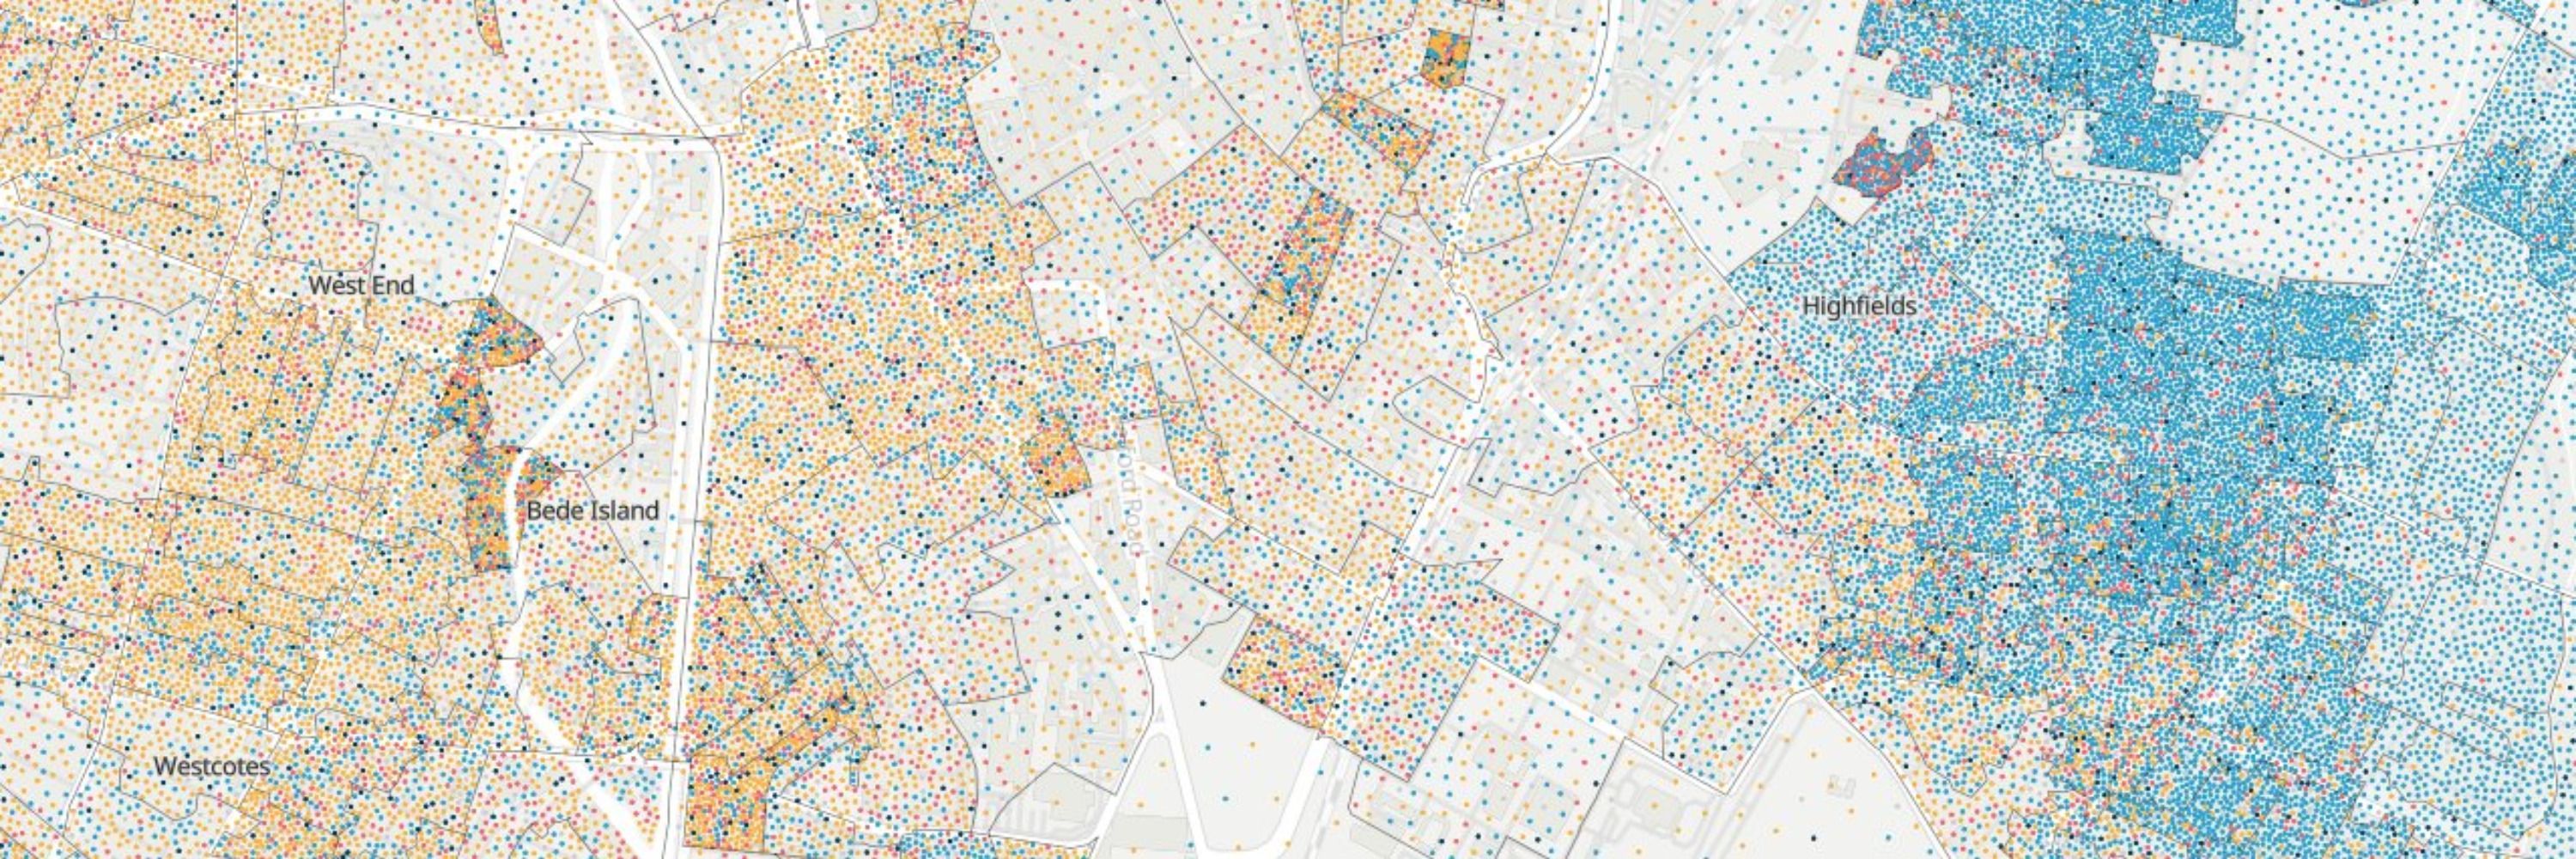
The points are placed using custom code based on Mitchell's best candidate algorithm to achieve an even spread. More points are generated as you zoom into the map, and the point locations and colours remain consistent as you change years.
2/3
2/3

November 1, 2025 at 8:53 AM
The points are placed using custom code based on Mitchell's best candidate algorithm to achieve an even spread. More points are generated as you zoom into the map, and the point locations and colours remain consistent as you change years.
2/3
2/3
#30DayMapChallenge
Day 1: Points
Worked on this experimental dot density map using UK population data by age and sex. The points are generated and coloured in real-time as you explore the map.
onsdigital.github.io/dot-map-poc/
1/3
Day 1: Points
Worked on this experimental dot density map using UK population data by age and sex. The points are generated and coloured in real-time as you explore the map.
onsdigital.github.io/dot-map-poc/
1/3
November 1, 2025 at 8:50 AM
#30DayMapChallenge
Day 1: Points
Worked on this experimental dot density map using UK population data by age and sex. The points are generated and coloured in real-time as you explore the map.
onsdigital.github.io/dot-map-poc/
1/3
Day 1: Points
Worked on this experimental dot density map using UK population data by age and sex. The points are generated and coloured in real-time as you explore the map.
onsdigital.github.io/dot-map-poc/
1/3
I wonder what the implications of this are for people who don't have/want a smart phone? Or who lose their phone or who have run out of battery when their ID is requested?

September 27, 2025 at 9:50 AM
I wonder what the implications of this are for people who don't have/want a smart phone? Or who lose their phone or who have run out of battery when their ID is requested?
Neat tool from @forensicarchi.bsky.social for live tracking the #Gaza #flotilla. 22 ships currently sailing flotilla-orpin.vercel.app

September 6, 2025 at 5:56 PM
Neat tool from @forensicarchi.bsky.social for live tracking the #Gaza #flotilla. 22 ships currently sailing flotilla-orpin.vercel.app
#PlaceNameTweener was inspired by this exceedingly silly map by @terriblemapshq.bsky.social. All of the code is open source and can be found here on GitHub github.com/bothness/pla...

August 28, 2025 at 10:58 AM
#PlaceNameTweener was inspired by this exceedingly silly map by @terriblemapshq.bsky.social. All of the code is open source and can be found here on GitHub github.com/bothness/pla...
Have you never wondered what made up places you might find between #Iceland and #Ireland, or between #Northampton and #Southampton? Today, you can open up this new world of possibilities with #PlaceNameTweener, inspired by @terriblemapshq.bsky.social! bothness.github.io/placetweener/
August 28, 2025 at 10:53 AM
Have you never wondered what made up places you might find between #Iceland and #Ireland, or between #Northampton and #Southampton? Today, you can open up this new world of possibilities with #PlaceNameTweener, inspired by @terriblemapshq.bsky.social! bothness.github.io/placetweener/
Just realised that every @canaries.co.uk game so far this season has ended in a 2-1 away win. Pitty we played half of them at home!

August 23, 2025 at 10:21 PM
Just realised that every @canaries.co.uk game so far this season has ended in a 2-1 away win. Pitty we played half of them at home!
Hi Steve. If you're referring to the best-fit methodology for matching a boundary to small area geographies, this follows the best practice recommended by ONS geography (geoportal.statistics.gov.uk/datasets/f0a...). The underlying geographies for a selection can be viewed on the profile builder page

May 23, 2025 at 12:15 PM
Hi Steve. If you're referring to the best-fit methodology for matching a boundary to small area geographies, this follows the best practice recommended by ONS geography (geoportal.statistics.gov.uk/datasets/f0a...). The underlying geographies for a selection can be viewed on the profile builder page
We've been working on an overhaul of the #ONS Build a Custom Area Profile tool to add new features and datasets. My colleague @henrylau.co.uk has just published a new how-to blog for people new to the tool digitalblog.ons.gov.uk/2025/05/23/w...
May 23, 2025 at 10:41 AM
We've been working on an overhaul of the #ONS Build a Custom Area Profile tool to add new features and datasets. My colleague @henrylau.co.uk has just published a new how-to blog for people new to the tool digitalblog.ons.gov.uk/2025/05/23/w...
Thanks Gregor. I'll experiment with a few approaches. For background, we used svelte/animate in our existing (very limited) #LayerCake driven charts library, but have been keen to explore the concept of leveraging CSS transitions for enhanced performance. onsvisual.github.io/svelte-charts/
May 23, 2025 at 9:25 AM
Thanks Gregor. I'll experiment with a few approaches. For background, we used svelte/animate in our existing (very limited) #LayerCake driven charts library, but have been keen to explore the concept of leveraging CSS transitions for enhanced performance. onsvisual.github.io/svelte-charts/
Really exciting stuff... We were looking to overhaul our #Svelte charts library at #ONS but this might meet our needs and more! Is there a mechanism you'd recommend for transitions? I tried this quick hack using CSS, but wondering if you had another approach in mind? svelte.dev/playground/c...
May 22, 2025 at 4:25 PM
Really exciting stuff... We were looking to overhaul our #Svelte charts library at #ONS but this might meet our needs and more! Is there a mechanism you'd recommend for transitions? I tried this quick hack using CSS, but wondering if you had another approach in mind? svelte.dev/playground/c...

Officially, we're all sold out for this #DataStorytelling event in #London on 12 May, but unofficially we're looking for a bigger room at UCL, so if you join the waiting list there's still a good chance to you can join us!

May 9, 2025 at 6:46 PM
Officially, we're all sold out for this #DataStorytelling event in #London on 12 May, but unofficially we're looking for a bigger room at UCL, so if you join the waiting list there's still a good chance to you can join us!
For anyone in #London on Tuesday 20th May, I'll be part of this event at UCL with the fantastic @monachalabi.bsky.social to promote the new #VisualizingPalestine book. Registration is free! www.outsavvy.com/event/27000/...

May 1, 2025 at 8:44 AM
For anyone in #London on Tuesday 20th May, I'll be part of this event at UCL with the fantastic @monachalabi.bsky.social to promote the new #VisualizingPalestine book. Registration is free! www.outsavvy.com/event/27000/...
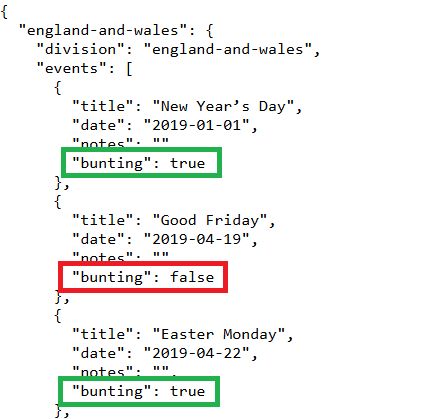
On the topic of the Bank Holidays API, it may well be the most quintessentially British API in existence, with a boolean (true/false) value for "bunting".
And, in case you were wondering, every bank holiday is a good day for bunting unless someone died for our sins! www.api.gov.uk/gds/bank-hol...
And, in case you were wondering, every bank holiday is a good day for bunting unless someone died for our sins! www.api.gov.uk/gds/bank-hol...
March 26, 2025 at 2:26 PM
On the topic of the Bank Holidays API, it may well be the most quintessentially British API in existence, with a boolean (true/false) value for "bunting".
And, in case you were wondering, every bank holiday is a good day for bunting unless someone died for our sins! www.api.gov.uk/gds/bank-hol...
And, in case you were wondering, every bank holiday is a good day for bunting unless someone died for our sins! www.api.gov.uk/gds/bank-hol...
We've got a new way to explore weekly mortality data (death registrations and "expected deaths") on the #ONS website. The plan is for this tool to replace the weekly bulletin that has been running for the past few years. And feedback greatly appreciated!
www.ons.gov.uk/peoplepopula...
www.ons.gov.uk/peoplepopula...


March 26, 2025 at 2:12 PM
We've got a new way to explore weekly mortality data (death registrations and "expected deaths") on the #ONS website. The plan is for this tool to replace the weekly bulletin that has been running for the past few years. And feedback greatly appreciated!
www.ons.gov.uk/peoplepopula...
www.ons.gov.uk/peoplepopula...
In context, to date, Tesla shares have only reverted to where they were before Trump was elected, and today's "rebound" is barely a blip

March 12, 2025 at 7:24 AM
In context, to date, Tesla shares have only reverted to where they were before Trump was elected, and today's "rebound" is barely a blip
Looking back, I can't believe Tufte tarred this iconic visual with the same "chart junk" brush as this hot mess

March 8, 2025 at 10:04 PM
Looking back, I can't believe Tufte tarred this iconic visual with the same "chart junk" brush as this hot mess
2/3
I wanted to highlight in particular this new waterfall chart (left) which illustrates the breakdown of how inflation changed from the previous month, replacing the bar chart (right) from previous publications.
I wanted to highlight in particular this new waterfall chart (left) which illustrates the breakdown of how inflation changed from the previous month, replacing the bar chart (right) from previous publications.


February 20, 2025 at 10:22 AM
2/3
I wanted to highlight in particular this new waterfall chart (left) which illustrates the breakdown of how inflation changed from the previous month, replacing the bar chart (right) from previous publications.
I wanted to highlight in particular this new waterfall chart (left) which illustrates the breakdown of how inflation changed from the previous month, replacing the bar chart (right) from previous publications.
🧵1/3
The team has been hard at work over the past month to transform the way #ONS presents the latest CPI (inflation) data. Please do share your feedback on this new preview website, especially on the new charts and "facts and figures" sections. nwp-prototype.ons.gov.uk/economy/infl...
The team has been hard at work over the past month to transform the way #ONS presents the latest CPI (inflation) data. Please do share your feedback on this new preview website, especially on the new charts and "facts and figures" sections. nwp-prototype.ons.gov.uk/economy/infl...


February 20, 2025 at 10:22 AM
🧵1/3
The team has been hard at work over the past month to transform the way #ONS presents the latest CPI (inflation) data. Please do share your feedback on this new preview website, especially on the new charts and "facts and figures" sections. nwp-prototype.ons.gov.uk/economy/infl...
The team has been hard at work over the past month to transform the way #ONS presents the latest CPI (inflation) data. Please do share your feedback on this new preview website, especially on the new charts and "facts and figures" sections. nwp-prototype.ons.gov.uk/economy/infl...
Potentially a very interesting role at the UK #NationalArchives for someone with an academic/research interest in #CounterMapping

February 3, 2025 at 6:46 PM
Potentially a very interesting role at the UK #NationalArchives for someone with an academic/research interest in #CounterMapping
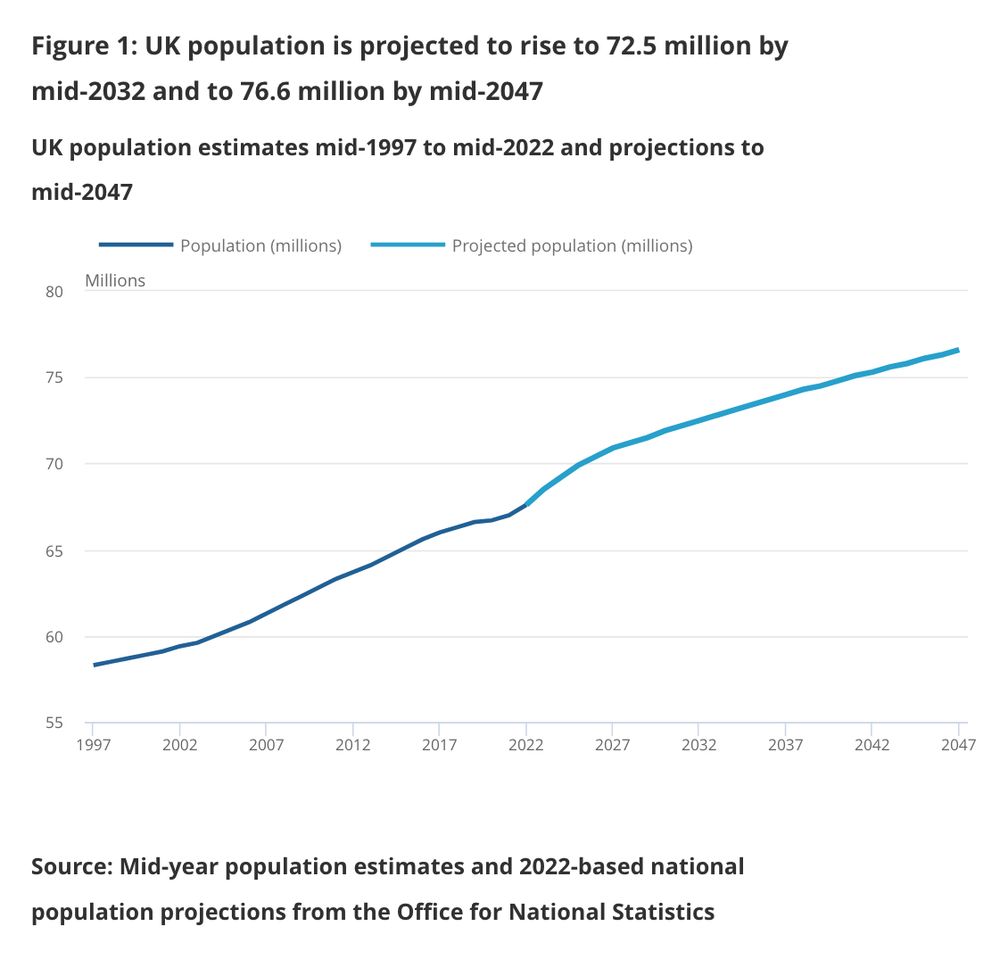
This new tool is released alongside the latest official UK population projection, which is for an increase of 4.9 million people (7.3%) between mid-2022 and mid-2032, from an estimated 67.6 million (2022) to 72.5 million (2032). You can read more here: www.ons.gov.uk/peoplepopula...

January 28, 2025 at 10:47 AM
This new tool is released alongside the latest official UK population projection, which is for an increase of 4.9 million people (7.3%) between mid-2022 and mid-2032, from an estimated 67.6 million (2022) to 72.5 million (2032). You can read more here: www.ons.gov.uk/peoplepopula...
📈📉We've just published a nifty new #ONS tool that allows you to see how different factors affect population projections! Adjust life expectancy, fertility rate and net migration to see how they affect estimates...
www.ons.gov.uk/peoplepopula...
www.ons.gov.uk/peoplepopula...
January 28, 2025 at 10:24 AM
📈📉We've just published a nifty new #ONS tool that allows you to see how different factors affect population projections! Adjust life expectancy, fertility rate and net migration to see how they affect estimates...
www.ons.gov.uk/peoplepopula...
www.ons.gov.uk/peoplepopula...
Only 2 days left to apply for this #DataJournalism role at the #ONS. A great opportunity to help make statistics more open, accessible and useful to the less nerdy folks among us...

January 26, 2025 at 1:59 PM
Only 2 days left to apply for this #DataJournalism role at the #ONS. A great opportunity to help make statistics more open, accessible and useful to the less nerdy folks among us...
You can find examples of the kinds of projects you'd be working on as a #DataJournalist at the #ONS in our digital content portfolio... onsvisual.github.io/project_cairo/


January 21, 2025 at 2:30 PM
You can find examples of the kinds of projects you'd be working on as a #DataJournalist at the #ONS in our digital content portfolio... onsvisual.github.io/project_cairo/