


@appliedepi.bsky.social
Improving Applied Epidemiology worldwide. Increasing the knowledge and resources of Epidemiologists no matter who or where they are.
Creator of the EpiRHandbook: https://epirhandbook.com/
Creator of the EpiRHandbook: https://epirhandbook.com/
The main takeaways are:
1) Ggplot customization possibilities are pretty endless.
2) Merry Christmas and happy holidays to you all!
🎄🎄🎄
1) Ggplot customization possibilities are pretty endless.
2) Merry Christmas and happy holidays to you all!
🎄🎄🎄
December 24, 2024 at 8:57 PM
The main takeaways are:
1) Ggplot customization possibilities are pretty endless.
2) Merry Christmas and happy holidays to you all!
🎄🎄🎄
1) Ggplot customization possibilities are pretty endless.
2) Merry Christmas and happy holidays to you all!
🎄🎄🎄
That code shows other cool things too, like how we added in a new font ("Grand Hotel") for the ggplot title.
We used the {showtext} package for this: font_add_google() loads the font from Google Fonts, and showtext_auto() ensures R applies the font to the plot.
We used the {showtext} package for this: font_add_google() loads the font from Google Fonts, and showtext_auto() ensures R applies the font to the plot.
December 24, 2024 at 8:57 PM
That code shows other cool things too, like how we added in a new font ("Grand Hotel") for the ggplot title.
We used the {showtext} package for this: font_add_google() loads the font from Google Fonts, and showtext_auto() ensures R applies the font to the plot.
We used the {showtext} package for this: font_add_google() loads the font from Google Fonts, and showtext_auto() ensures R applies the font to the plot.
Repeatedly rerunning the code is quite fun
December 24, 2024 at 8:57 PM
Repeatedly rerunning the code is quite fun
And how did we get Santa's coordinates?
Since he didn't share his location, we created a function (get_random_night_coords()) to randomly generate coordinates of a location with a current local time between 11pm and 3am, assuming those are his working hours!
Close enough!
Since he didn't share his location, we created a function (get_random_night_coords()) to randomly generate coordinates of a location with a current local time between 11pm and 3am, assuming those are his working hours!
Close enough!

December 24, 2024 at 8:57 PM
And how did we get Santa's coordinates?
Since he didn't share his location, we created a function (get_random_night_coords()) to randomly generate coordinates of a location with a current local time between 11pm and 3am, assuming those are his working hours!
Close enough!
Since he didn't share his location, we created a function (get_random_night_coords()) to randomly generate coordinates of a location with a current local time between 11pm and 3am, assuming those are his working hours!
Close enough!
Both of these figures are created with ggplot2, and use a saved PNG file of Santa.
geom_image() from {ggimage} places the image at specified coordinates, reading from the file path.
Here's the ggplot code for the second figure:
geom_image() from {ggimage} places the image at specified coordinates, reading from the file path.
Here's the ggplot code for the second figure:

December 24, 2024 at 8:57 PM
Both of these figures are created with ggplot2, and use a saved PNG file of Santa.
geom_image() from {ggimage} places the image at specified coordinates, reading from the file path.
Here's the ggplot code for the second figure:
geom_image() from {ggimage} places the image at specified coordinates, reading from the file path.
Here's the ggplot code for the second figure:
And if you want his current location:

December 24, 2024 at 8:57 PM
And if you want his current location:
coalesce() is from the {dplyr} package. It returns the first non-missing value from a set of columns, based on the order you specify.
It’s not just for dates, but for any use-case where you need to pick one value from across columns!
It’s not just for dates, but for any use-case where you need to pick one value from across columns!
December 23, 2024 at 8:38 PM
coalesce() is from the {dplyr} package. It returns the first non-missing value from a set of columns, based on the order you specify.
It’s not just for dates, but for any use-case where you need to pick one value from across columns!
It’s not just for dates, but for any use-case where you need to pick one value from across columns!
Can you recommend any other holiday or Christmas-related R packages? We'd love to know!
December 22, 2024 at 9:25 PM
Can you recommend any other holiday or Christmas-related R packages? We'd love to know!
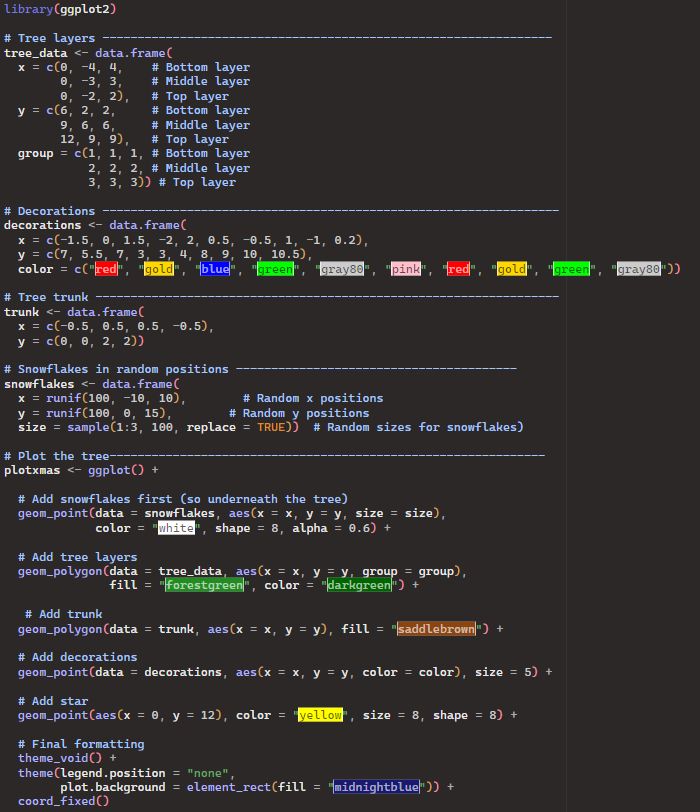
Here's the code if you like the "minimalist" aesthetic.
That said, it does show the versality of ggplot!
That said, it does show the versality of ggplot!
December 22, 2024 at 9:25 PM
Here's the code if you like the "minimalist" aesthetic.
That said, it does show the versality of ggplot!
That said, it does show the versality of ggplot!
P.s. Before finding the {christmas} package I was ready to make this the main event for this post:

December 22, 2024 at 9:25 PM
P.s. Before finding the {christmas} package I was ready to make this the main event for this post:
And finally, if you want the function code pasted above, you can get it from the Applied Epi Community: community.appliedepi.org/t/custom-ggp...
Enjoy!
#RStats #Dataviz
Enjoy!
#RStats #Dataviz

Custom ggplot functions!
Hi all! I’m pasting in some example code to create a custom ggplot function. This example creates different epicurves using the Ebola linelist from Applied Epi’s introcourse. It allows you to defin...
community.appliedepi.org
December 22, 2024 at 12:24 AM
And finally, if you want the function code pasted above, you can get it from the Applied Epi Community: community.appliedepi.org/t/custom-ggp...
Enjoy!
#RStats #Dataviz
Enjoy!
#RStats #Dataviz
You can make the function more complex, but don't overdo it - too many arguments could become hard to understand and edit!
It's all about balance and the best solution for your problem🤓
Learn more here:
epirhandbook.com/en/new_pages...
ggplot2.tidyverse.org/reference/ti...
It's all about balance and the best solution for your problem🤓
Learn more here:
epirhandbook.com/en/new_pages...
ggplot2.tidyverse.org/reference/ti...

Tidy eval helpers — tidyeval
This page lists the tidy eval tools reexported in this package from
rlang. To learn about using tidy eval in scripts and packages at a
high level, see the dplyr programming vignette
and the ggplot2 in...
ggplot2.tidyverse.org
December 22, 2024 at 12:24 AM
You can make the function more complex, but don't overdo it - too many arguments could become hard to understand and edit!
It's all about balance and the best solution for your problem🤓
Learn more here:
epirhandbook.com/en/new_pages...
ggplot2.tidyverse.org/reference/ti...
It's all about balance and the best solution for your problem🤓
Learn more here:
epirhandbook.com/en/new_pages...
ggplot2.tidyverse.org/reference/ti...
Want to further customize colours? 🎨
The example above uses the same colour palette for each plot, with scale_fill_brewer().
For custom colours, you can also define a palette inside scale_fill_manual() - or as a separate object that you refer to (as discussed yesterday).
The example above uses the same colour palette for each plot, with scale_fill_brewer().
For custom colours, you can also define a palette inside scale_fill_manual() - or as a separate object that you refer to (as discussed yesterday).

December 22, 2024 at 12:24 AM
Want to further customize colours? 🎨
The example above uses the same colour palette for each plot, with scale_fill_brewer().
For custom colours, you can also define a palette inside scale_fill_manual() - or as a separate object that you refer to (as discussed yesterday).
The example above uses the same colour palette for each plot, with scale_fill_brewer().
For custom colours, you can also define a palette inside scale_fill_manual() - or as a separate object that you refer to (as discussed yesterday).
Why the squiggly brackets {{x}}? 🤔 They're for tidy evaluation!
{{ }} allows ggplot() to recognize the inputs for "xvalue" and "fillvalue" as column names from your data.
Without them, your function won’t know how to evaluate these column names properly!
December 22, 2024 at 12:24 AM
Why the squiggly brackets {{x}}? 🤔 They're for tidy evaluation!
{{ }} allows ggplot() to recognize the inputs for "xvalue" and "fillvalue" as column names from your data.
Without them, your function won’t know how to evaluate these column names properly!