


Andres Gonzalez
@andresanalytics.bsky.social
Statistician | #RStats | Data Viz
🔗 https://andresgonzalezstats.com/
👨💻 GitHub: https://github.com/OKcomputer626
🔗 https://andresgonzalezstats.com/
👨💻 GitHub: https://github.com/OKcomputer626
#TidyTuesday Week 45, 2025 - WHO TB Burden Data: Incidence, Mortality, and Population Data 📊
A global look at how TB incidence and mortality vary across regions and populations.
🔗: andresgonzalezstats.com/visualizatio...
A global look at how TB incidence and mortality vary across regions and populations.
🔗: andresgonzalezstats.com/visualizatio...
November 13, 2025 at 4:17 AM
#TidyTuesday Week 45, 2025 - WHO TB Burden Data: Incidence, Mortality, and Population Data 📊
A global look at how TB incidence and mortality vary across regions and populations.
🔗: andresgonzalezstats.com/visualizatio...
A global look at how TB incidence and mortality vary across regions and populations.
🔗: andresgonzalezstats.com/visualizatio...
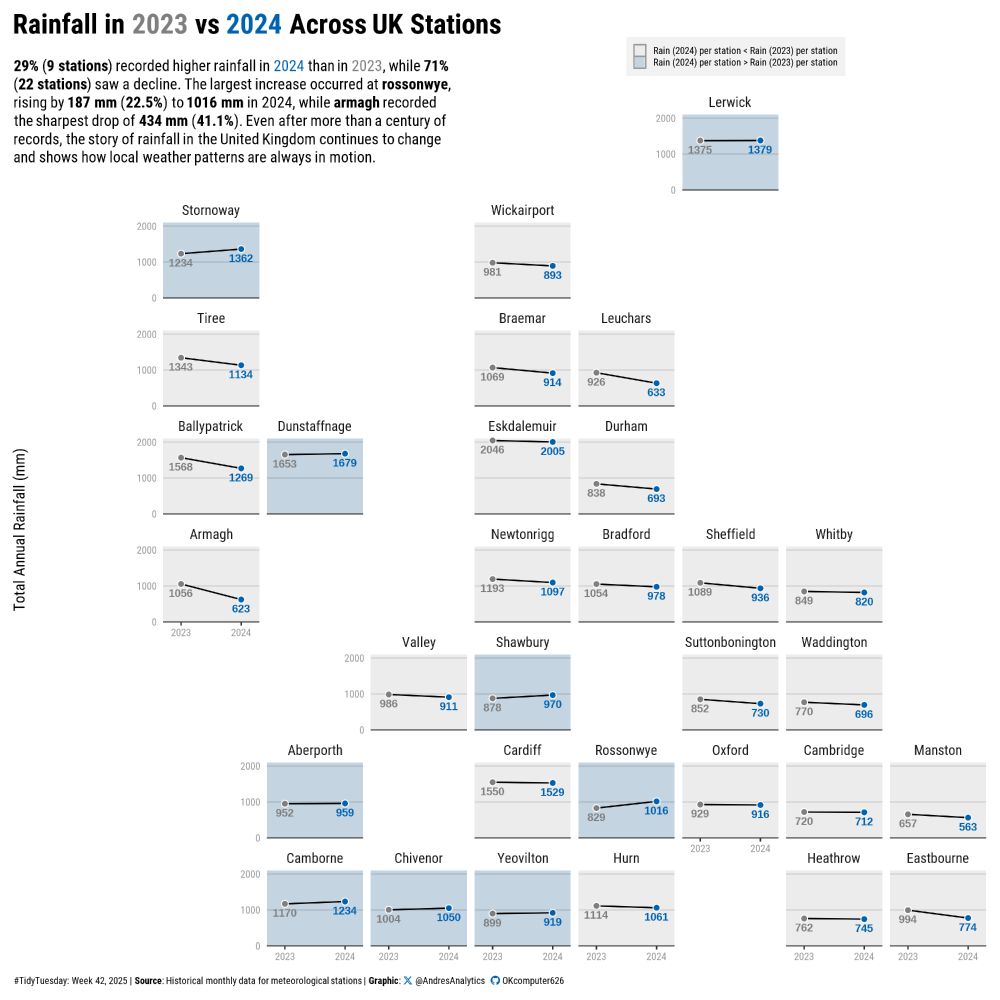
#TidyTuesday Week 42, 2025 - Historic UK Meteorological & Climate Data 📊
The chart uses the {gridmappr} package to compare total annual rainfall at UK stations in 2023 and 2024 showing most stations recorded less rain in 2024 while a few saw increases.
🔗: andresgonzalezstats.com/visualizatio...
The chart uses the {gridmappr} package to compare total annual rainfall at UK stations in 2023 and 2024 showing most stations recorded less rain in 2024 while a few saw increases.
🔗: andresgonzalezstats.com/visualizatio...
October 27, 2025 at 5:08 AM
#TidyTuesday Week 42, 2025 - Historic UK Meteorological & Climate Data 📊
The chart uses the {gridmappr} package to compare total annual rainfall at UK stations in 2023 and 2024 showing most stations recorded less rain in 2024 while a few saw increases.
🔗: andresgonzalezstats.com/visualizatio...
The chart uses the {gridmappr} package to compare total annual rainfall at UK stations in 2023 and 2024 showing most stations recorded less rain in 2024 while a few saw increases.
🔗: andresgonzalezstats.com/visualizatio...
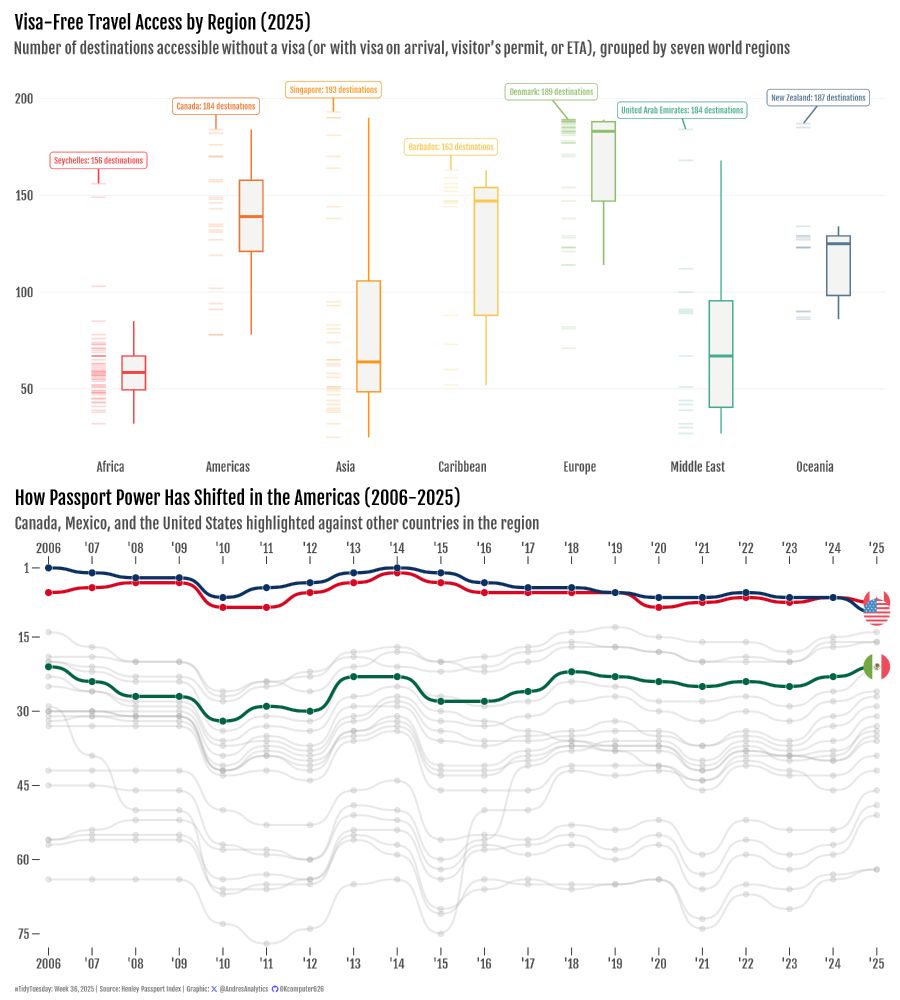
#TidyTuesday Week 36, 2025 - Henley Passport Index Data 📊
Visualizing global passport access in 2025 with boxplots by region and tracking how Canada, Mexico, and the United States have shifted in the Americas’ passport rankings since 2006.
🔗: andresgonzalezstats.com/visualizatio...
Visualizing global passport access in 2025 with boxplots by region and tracking how Canada, Mexico, and the United States have shifted in the Americas’ passport rankings since 2006.
🔗: andresgonzalezstats.com/visualizatio...
September 16, 2025 at 4:37 AM
#TidyTuesday Week 36, 2025 - Henley Passport Index Data 📊
Visualizing global passport access in 2025 with boxplots by region and tracking how Canada, Mexico, and the United States have shifted in the Americas’ passport rankings since 2006.
🔗: andresgonzalezstats.com/visualizatio...
Visualizing global passport access in 2025 with boxplots by region and tracking how Canada, Mexico, and the United States have shifted in the Americas’ passport rankings since 2006.
🔗: andresgonzalezstats.com/visualizatio...
#TidyTuesday Week 32, 2025 - Extreme Weather Attribution Studies 📊
Streamgraph of Carbon Brief’s event-focused attribution studies (2008–2024), counting studies by event year across regions for the top four event types.
🔗: andresgonzalezstats.com/visualizatio...
Streamgraph of Carbon Brief’s event-focused attribution studies (2008–2024), counting studies by event year across regions for the top four event types.
🔗: andresgonzalezstats.com/visualizatio...

August 19, 2025 at 11:51 PM
#TidyTuesday Week 32, 2025 - Extreme Weather Attribution Studies 📊
Streamgraph of Carbon Brief’s event-focused attribution studies (2008–2024), counting studies by event year across regions for the top four event types.
🔗: andresgonzalezstats.com/visualizatio...
Streamgraph of Carbon Brief’s event-focused attribution studies (2008–2024), counting studies by event year across regions for the top four event types.
🔗: andresgonzalezstats.com/visualizatio...
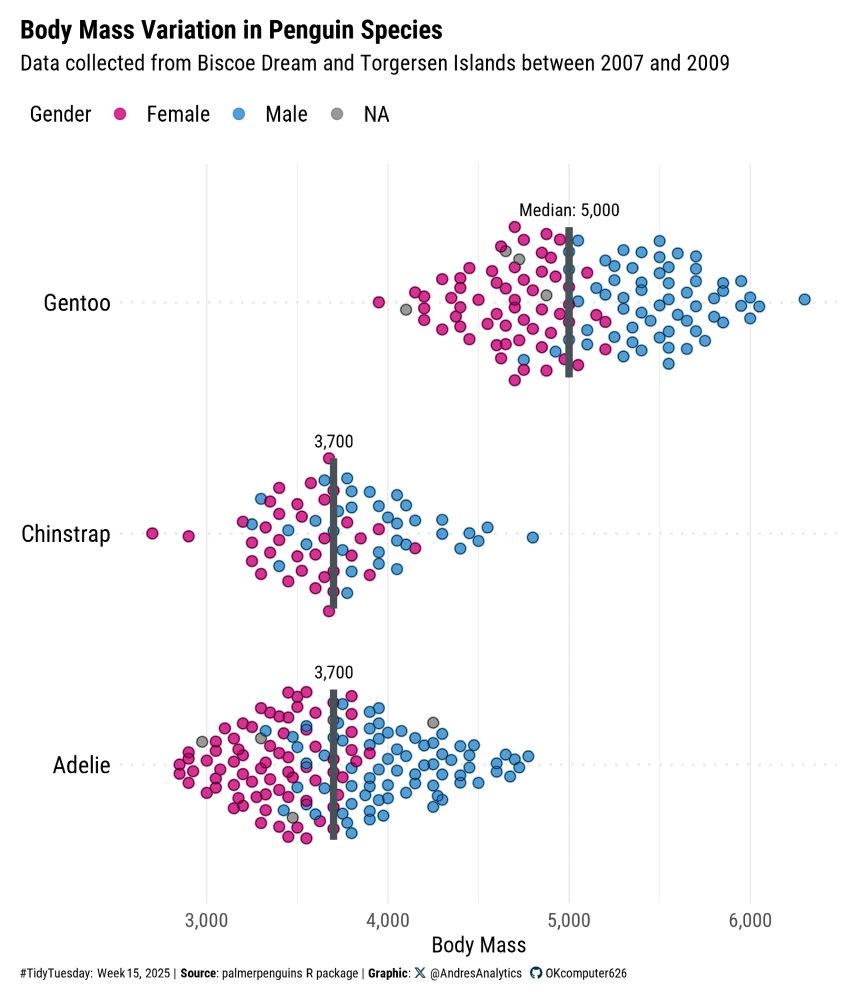
#TidyTuesday Week 15, 2025 - Base R Penguins 📊
A gender-based comparison of penguin body mass across species with median highlights, using Antarctic island data (2007–2009).
🔗: andresgonzalezstats.com/visualizatio...
#DataViz #Rstats #ggplot2
A gender-based comparison of penguin body mass across species with median highlights, using Antarctic island data (2007–2009).
🔗: andresgonzalezstats.com/visualizatio...
#DataViz #Rstats #ggplot2
April 15, 2025 at 6:30 PM
#TidyTuesday Week 15, 2025 - Base R Penguins 📊
A gender-based comparison of penguin body mass across species with median highlights, using Antarctic island data (2007–2009).
🔗: andresgonzalezstats.com/visualizatio...
#DataViz #Rstats #ggplot2
A gender-based comparison of penguin body mass across species with median highlights, using Antarctic island data (2007–2009).
🔗: andresgonzalezstats.com/visualizatio...
#DataViz #Rstats #ggplot2
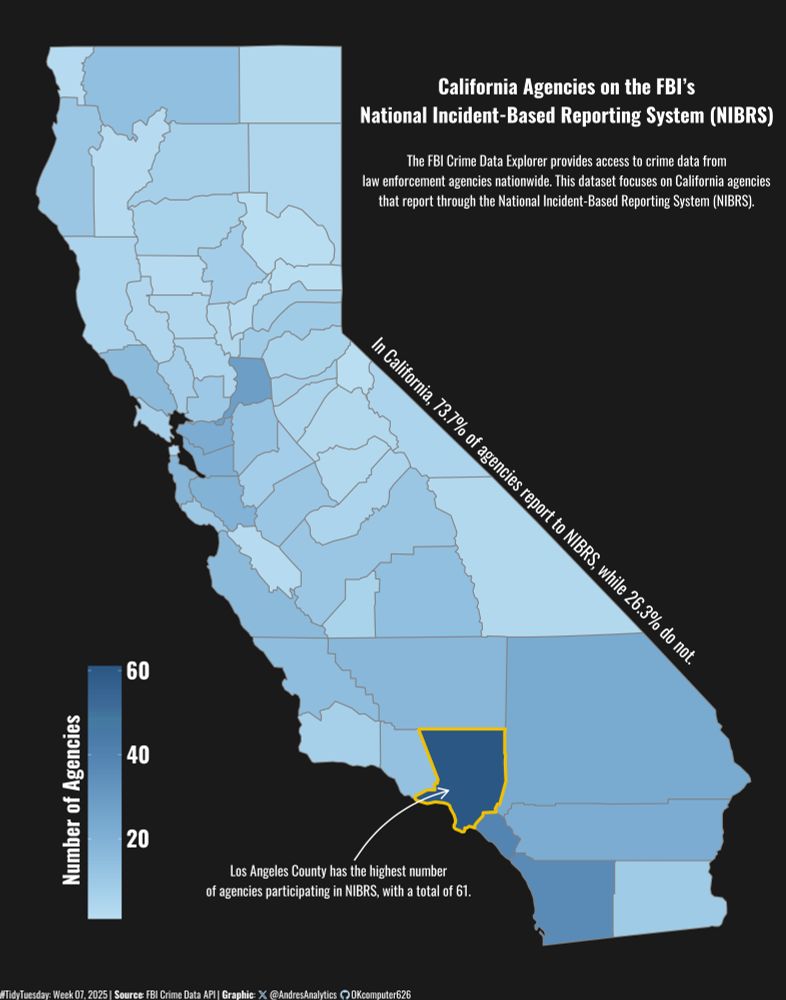
#TidyTuesday Week 07, 2025 - Agencies from the FBI Crime Data 📊
NIBRS participation in California, with 73.7% of agencies reporting and Los Angeles County having the most at 61 agencies.
🔗: andresgonzalezstats.com/visualizatio...
#DataViz #Rstats #ggplot2
NIBRS participation in California, with 73.7% of agencies reporting and Los Angeles County having the most at 61 agencies.
🔗: andresgonzalezstats.com/visualizatio...
#DataViz #Rstats #ggplot2
February 21, 2025 at 8:23 AM
#TidyTuesday Week 07, 2025 - Agencies from the FBI Crime Data 📊
NIBRS participation in California, with 73.7% of agencies reporting and Los Angeles County having the most at 61 agencies.
🔗: andresgonzalezstats.com/visualizatio...
#DataViz #Rstats #ggplot2
NIBRS participation in California, with 73.7% of agencies reporting and Los Angeles County having the most at 61 agencies.
🔗: andresgonzalezstats.com/visualizatio...
#DataViz #Rstats #ggplot2
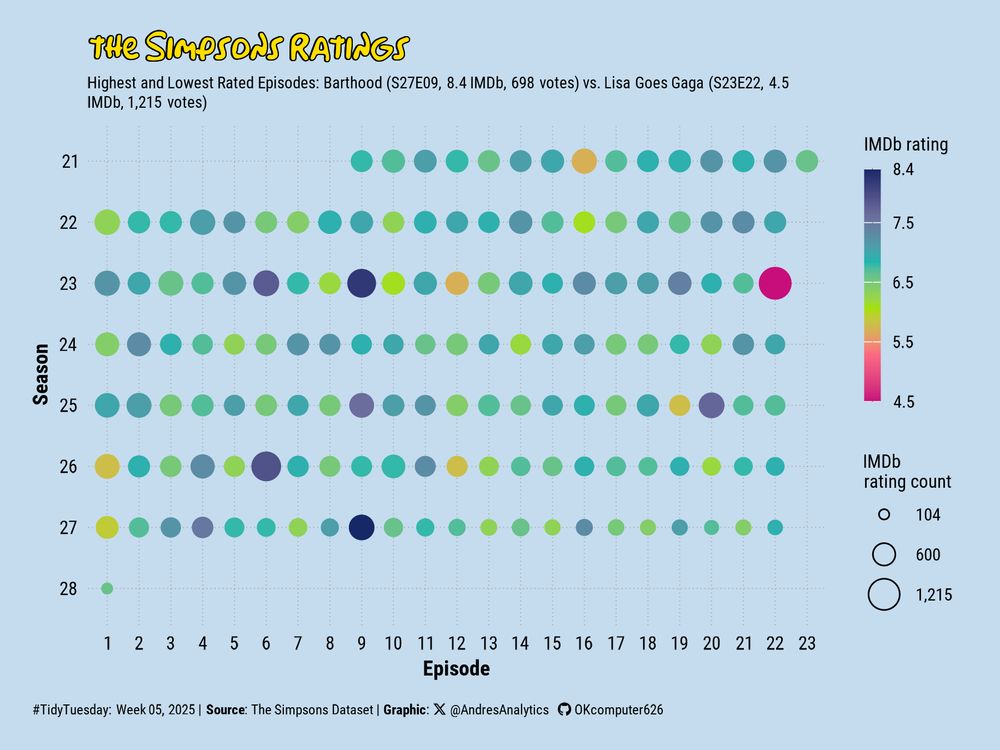
#TidyTuesday Week 05, 2025 - A Deep Dive into the Simpsons 📊
The Simpsons episode ratings using color for IMDb scores and dot size for vote count.
🔗: andresgonzalezstats.com/visualizatio...
#DataViz #Rstats #ggplot2
The Simpsons episode ratings using color for IMDb scores and dot size for vote count.
🔗: andresgonzalezstats.com/visualizatio...
#DataViz #Rstats #ggplot2
February 12, 2025 at 9:41 PM
#TidyTuesday Week 05, 2025 - A Deep Dive into the Simpsons 📊
The Simpsons episode ratings using color for IMDb scores and dot size for vote count.
🔗: andresgonzalezstats.com/visualizatio...
#DataViz #Rstats #ggplot2
The Simpsons episode ratings using color for IMDb scores and dot size for vote count.
🔗: andresgonzalezstats.com/visualizatio...
#DataViz #Rstats #ggplot2
First Post!
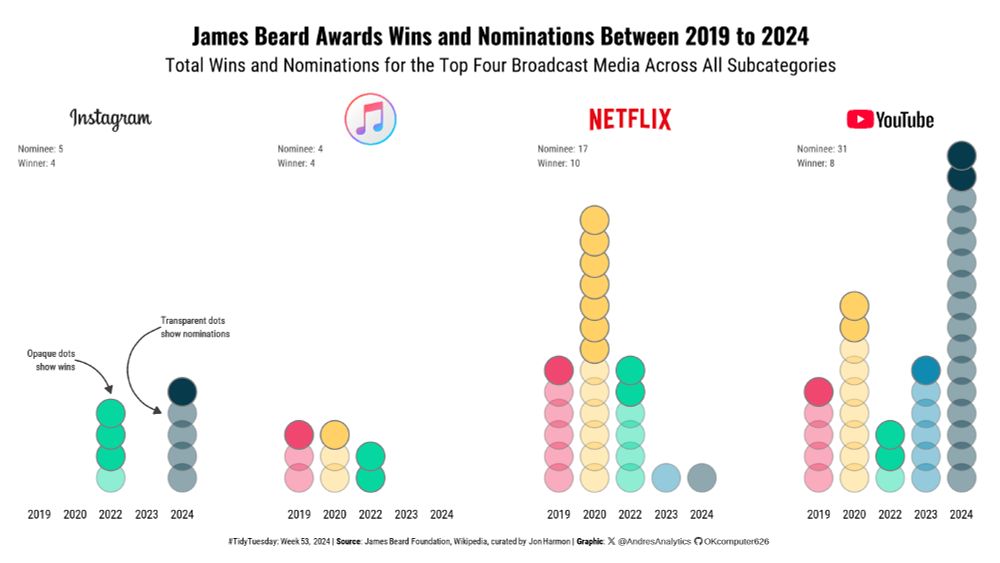
#TidyTuesday 2024 Week 53 – James Beard Awards 📊
Showing wins & nominations for top media from 2019-2024.
🔗: andresgonzalezstats.com/visualizatio...
#DataViz #Rstats #ggplot2
#TidyTuesday 2024 Week 53 – James Beard Awards 📊
Showing wins & nominations for top media from 2019-2024.
🔗: andresgonzalezstats.com/visualizatio...
#DataViz #Rstats #ggplot2
January 4, 2025 at 10:16 PM
First Post!
#TidyTuesday 2024 Week 53 – James Beard Awards 📊
Showing wins & nominations for top media from 2019-2024.
🔗: andresgonzalezstats.com/visualizatio...
#DataViz #Rstats #ggplot2
#TidyTuesday 2024 Week 53 – James Beard Awards 📊
Showing wins & nominations for top media from 2019-2024.
🔗: andresgonzalezstats.com/visualizatio...
#DataViz #Rstats #ggplot2