


Amanda J. Wright
@ajwright.bsky.social
Incoming Asst. Prof @tamu.bsky.social. Postdoc @uzh-diffpsy.bsky.social. PhD @washu.bsky.social.
I like personality development, change, & prediction. Depending on the day (or hour), I also like R & Bayesian stats
https://www.amanda-j-wright.com
I like personality development, change, & prediction. Depending on the day (or hour), I also like R & Bayesian stats
https://www.amanda-j-wright.com
What'd we find? (continued)
2) Life events were related to personality development, but almost exclusively for personality functioning
We believe this suggests that personality functioning is more susceptible to external influences than most Big Five traits
2) Life events were related to personality development, but almost exclusively for personality functioning
We believe this suggests that personality functioning is more susceptible to external influences than most Big Five traits

September 5, 2025 at 4:05 PM
What'd we find? (continued)
2) Life events were related to personality development, but almost exclusively for personality functioning
We believe this suggests that personality functioning is more susceptible to external influences than most Big Five traits
2) Life events were related to personality development, but almost exclusively for personality functioning
We believe this suggests that personality functioning is more susceptible to external influences than most Big Five traits
What'd we find?
1) Unconditional development of all constructs was generally very similar, but there were some interesting trait- & metric-specific differences
1) Unconditional development of all constructs was generally very similar, but there were some interesting trait- & metric-specific differences

September 5, 2025 at 4:05 PM
What'd we find?
1) Unconditional development of all constructs was generally very similar, but there were some interesting trait- & metric-specific differences
1) Unconditional development of all constructs was generally very similar, but there were some interesting trait- & metric-specific differences
New paper out at the Journal of Psychopathology and Clinical Science!
We examined unconditional & event-related changes in pathological vs normal-range personality using 4 metrics to compare their developmental links, how these vary with life events, and whether unique effects emerge across metrics
We examined unconditional & event-related changes in pathological vs normal-range personality using 4 metrics to compare their developmental links, how these vary with life events, and whether unique effects emerge across metrics

September 5, 2025 at 4:05 PM
New paper out at the Journal of Psychopathology and Clinical Science!
We examined unconditional & event-related changes in pathological vs normal-range personality using 4 metrics to compare their developmental links, how these vary with life events, and whether unique effects emerge across metrics
We examined unconditional & event-related changes in pathological vs normal-range personality using 4 metrics to compare their developmental links, how these vary with life events, and whether unique effects emerge across metrics
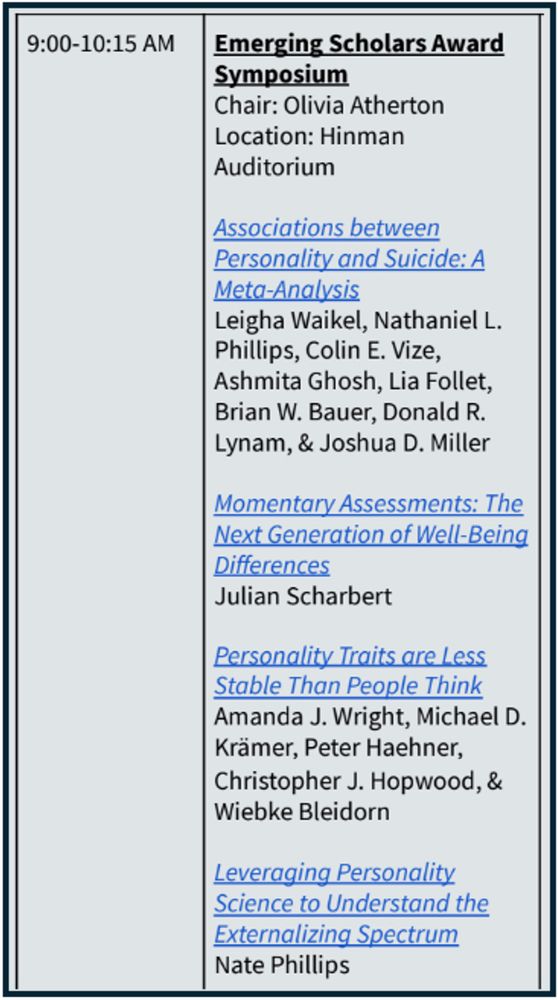
and if you’re an early bird (unlike me, RIP), stop by the Emerging Scholars symposium tomorrow at 9:15 to hear a great lineup of talks :-)
June 27, 2025 at 5:36 PM
and if you’re an early bird (unlike me, RIP), stop by the Emerging Scholars symposium tomorrow at 9:15 to hear a great lineup of talks :-)
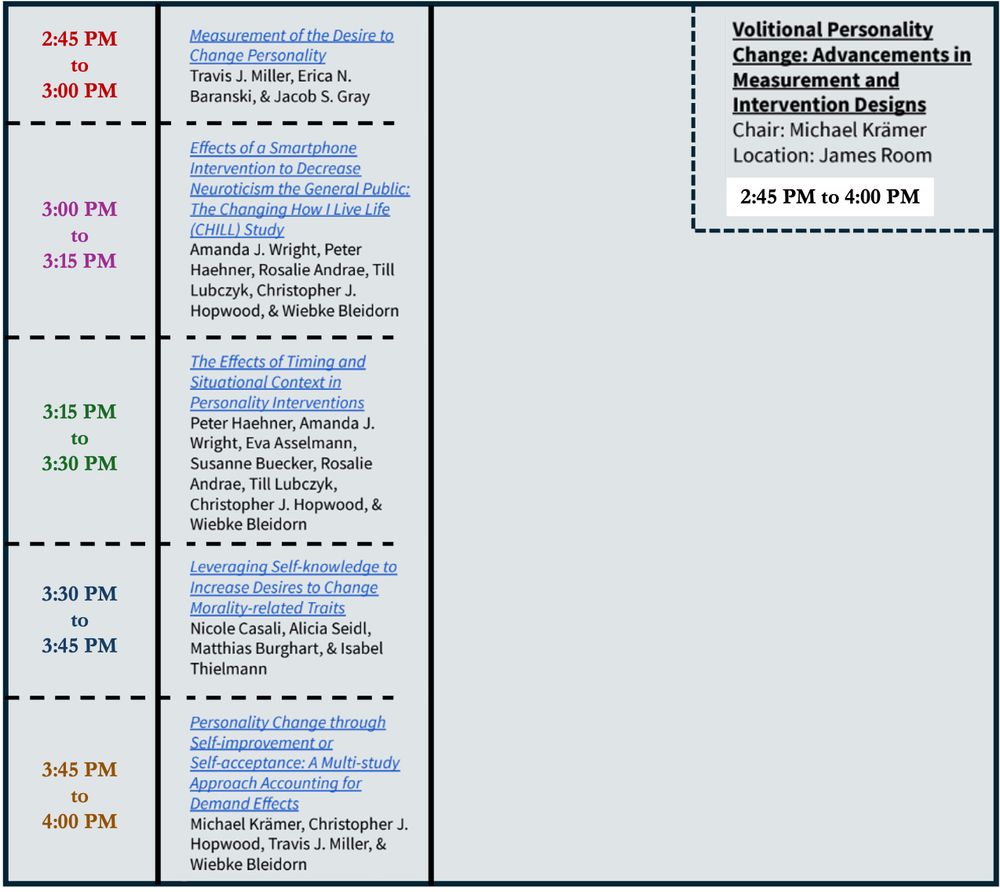
If you’re at ARP and want to hear some great talks on personality interventions, stop by our symposium at 2:45 in the James Room on the 9th floor!!!
June 27, 2025 at 5:03 PM
If you’re at ARP and want to hear some great talks on personality interventions, stop by our symposium at 2:45 in the James Room on the 9th floor!!!
Excited to share that I'll be joining the psychology department at Texas A&M as an assistant professor starting Fall 2026 🤗


March 28, 2025 at 4:23 PM
Excited to share that I'll be joining the psychology department at Texas A&M as an assistant professor starting Fall 2026 🤗
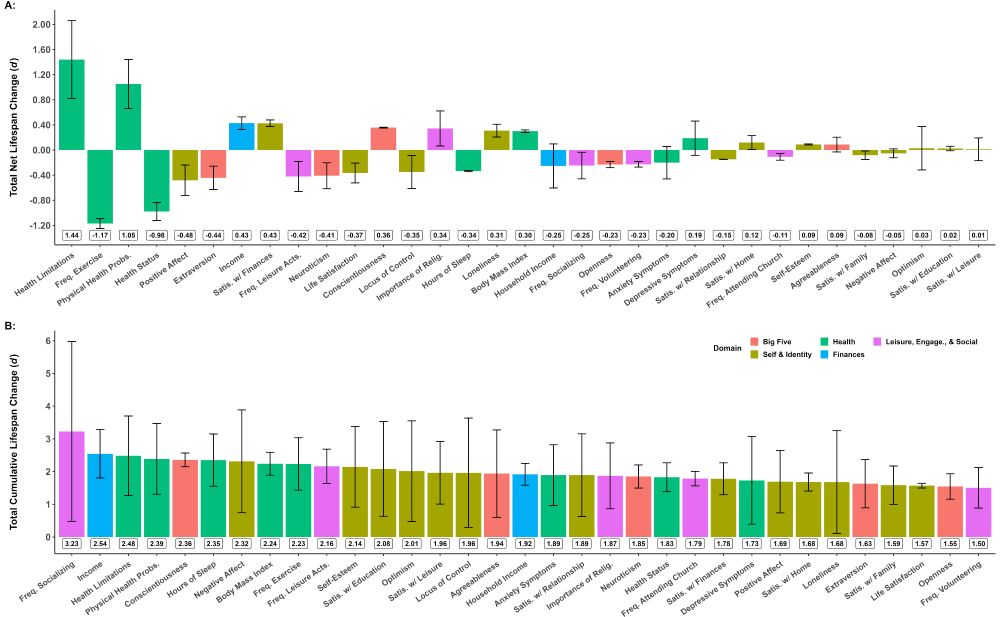
2nd: Meta-analytic lifespan trajectories showed that changes in personality were similar to other variables
Two traits had top 6 largest net decreases (E/N)
One trait (C) had top 5 largest net increases & cumulative changes. Its changes were similar to health & larger than any psych variable (5/8)
Two traits had top 6 largest net decreases (E/N)
One trait (C) had top 5 largest net increases & cumulative changes. Its changes were similar to health & larger than any psych variable (5/8)
March 13, 2025 at 9:00 PM
2nd: Meta-analytic lifespan trajectories showed that changes in personality were similar to other variables
Two traits had top 6 largest net decreases (E/N)
One trait (C) had top 5 largest net increases & cumulative changes. Its changes were similar to health & larger than any psych variable (5/8)
Two traits had top 6 largest net decreases (E/N)
One trait (C) had top 5 largest net increases & cumulative changes. Its changes were similar to health & larger than any psych variable (5/8)
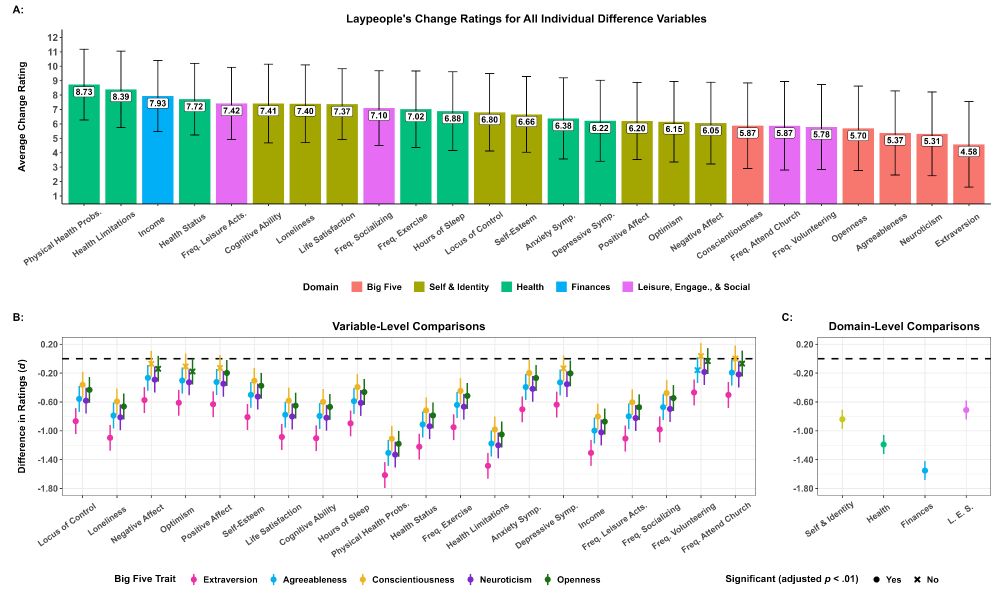
1st: 5/7 variables with the smallest perceived changes were personality traits. No variable had significantly smaller change ratings than any Big Five trait
Domain-level ratings also showed people believe personality changes less than domains like health, finances, & other psych variables (4/8)
Domain-level ratings also showed people believe personality changes less than domains like health, finances, & other psych variables (4/8)
March 13, 2025 at 9:00 PM
1st: 5/7 variables with the smallest perceived changes were personality traits. No variable had significantly smaller change ratings than any Big Five trait
Domain-level ratings also showed people believe personality changes less than domains like health, finances, & other psych variables (4/8)
Domain-level ratings also showed people believe personality changes less than domains like health, finances, & other psych variables (4/8)
Events were associated with:
- Decreased rank-order stability
- Anticipatory group differences in slopes + within-person mean-level decreases from pre- to post-event
- Less initial within-person variability for event group + increases in this metric from pre- to post-event (4/7)
- Decreased rank-order stability
- Anticipatory group differences in slopes + within-person mean-level decreases from pre- to post-event
- Less initial within-person variability for event group + increases in this metric from pre- to post-event (4/7)

September 23, 2024 at 3:49 PM
Events were associated with:
- Decreased rank-order stability
- Anticipatory group differences in slopes + within-person mean-level decreases from pre- to post-event
- Less initial within-person variability for event group + increases in this metric from pre- to post-event (4/7)
- Decreased rank-order stability
- Anticipatory group differences in slopes + within-person mean-level decreases from pre- to post-event
- Less initial within-person variability for event group + increases in this metric from pre- to post-event (4/7)
We found pers fx had little to no average normative change across one year. It was moderately rank-order stable & had some average quadratic mean-level change
However, these rather bland sample effects masked considerable heterogeneity - which was related to life events! (3/7)
However, these rather bland sample effects masked considerable heterogeneity - which was related to life events! (3/7)

September 23, 2024 at 3:48 PM
We found pers fx had little to no average normative change across one year. It was moderately rank-order stable & had some average quadratic mean-level change
However, these rather bland sample effects masked considerable heterogeneity - which was related to life events! (3/7)
However, these rather bland sample effects masked considerable heterogeneity - which was related to life events! (3/7)
We examined normative & event-related development in personality functioning (pers fx; Criterion A of the AMPD) using four metrics
Why four metrics? Because rank-order stability & mean-level changes cannot and do not tell you everything about a construct's development 🤌🏼 (2/7)
Why four metrics? Because rank-order stability & mean-level changes cannot and do not tell you everything about a construct's development 🤌🏼 (2/7)

September 23, 2024 at 3:47 PM
We examined normative & event-related development in personality functioning (pers fx; Criterion A of the AMPD) using four metrics
Why four metrics? Because rank-order stability & mean-level changes cannot and do not tell you everything about a construct's development 🤌🏼 (2/7)
Why four metrics? Because rank-order stability & mean-level changes cannot and do not tell you everything about a construct's development 🤌🏼 (2/7)
I *love* the Whova generated graphics so it seemed fitting to use one
If you’re at #DGPs2024 and want to hear 5 great talks about integrating idiographics & nomothetics in psychology, please come check out our symposium led by @niclaskuper.bsky.social on Wednesday at 11:30!
If you’re at #DGPs2024 and want to hear 5 great talks about integrating idiographics & nomothetics in psychology, please come check out our symposium led by @niclaskuper.bsky.social on Wednesday at 11:30!


September 16, 2024 at 10:56 AM
I *love* the Whova generated graphics so it seemed fitting to use one
If you’re at #DGPs2024 and want to hear 5 great talks about integrating idiographics & nomothetics in psychology, please come check out our symposium led by @niclaskuper.bsky.social on Wednesday at 11:30!
If you’re at #DGPs2024 and want to hear 5 great talks about integrating idiographics & nomothetics in psychology, please come check out our symposium led by @niclaskuper.bsky.social on Wednesday at 11:30!
Long story short, we found (part 1):
- There is a lot of heterogeneity in best-fitting forms for the Big Five
- People’s forms are directly associated with their net & total amount of change across time
- These changes are very misquantified when a worse-fitting form is used
- There is a lot of heterogeneity in best-fitting forms for the Big Five
- People’s forms are directly associated with their net & total amount of change across time
- These changes are very misquantified when a worse-fitting form is used

August 22, 2024 at 6:38 PM
Long story short, we found (part 1):
- There is a lot of heterogeneity in best-fitting forms for the Big Five
- People’s forms are directly associated with their net & total amount of change across time
- These changes are very misquantified when a worse-fitting form is used
- There is a lot of heterogeneity in best-fitting forms for the Big Five
- People’s forms are directly associated with their net & total amount of change across time
- These changes are very misquantified when a worse-fitting form is used
Excited to see this out now in JPSP :-)
It’s pretty standard to acknowledge individual differences in mean levels of traits (via intercepts) and changes in traits (often via linear slopes), but what about model forms of personality trajectories?
doi.org/10.1037/pspp...
It’s pretty standard to acknowledge individual differences in mean levels of traits (via intercepts) and changes in traits (often via linear slopes), but what about model forms of personality trajectories?
doi.org/10.1037/pspp...

August 22, 2024 at 6:36 PM
Excited to see this out now in JPSP :-)
It’s pretty standard to acknowledge individual differences in mean levels of traits (via intercepts) and changes in traits (often via linear slopes), but what about model forms of personality trajectories?
doi.org/10.1037/pspp...
It’s pretty standard to acknowledge individual differences in mean levels of traits (via intercepts) and changes in traits (often via linear slopes), but what about model forms of personality trajectories?
doi.org/10.1037/pspp...
If you’ll be at #ECP21 in Berlin and have 90 minutes to spare on Thursday, come check out our symposium on personality interventions with some *really* cool talks!


August 5, 2024 at 12:54 PM
If you’ll be at #ECP21 in Berlin and have 90 minutes to spare on Thursday, come check out our symposium on personality interventions with some *really* cool talks!
For Aim 3, it appears that within-person variability has the potential to be a metric with valuable predictive utility!
This individual difference predicted health status by itself, over & above people’s trait levels and changes, and had some notable interactions as well (5/8)
This individual difference predicted health status by itself, over & above people’s trait levels and changes, and had some notable interactions as well (5/8)

June 6, 2024 at 4:05 PM
For Aim 3, it appears that within-person variability has the potential to be a metric with valuable predictive utility!
This individual difference predicted health status by itself, over & above people’s trait levels and changes, and had some notable interactions as well (5/8)
This individual difference predicted health status by itself, over & above people’s trait levels and changes, and had some notable interactions as well (5/8)
For Aim 2, they do relate & do so in expected ways!
Individual differences in within-person variability were related to variables like age, gender, cognitive ability, & other trait levels
All effects emerged independent of effects rather due to trait levels or changes (4/8)
Individual differences in within-person variability were related to variables like age, gender, cognitive ability, & other trait levels
All effects emerged independent of effects rather due to trait levels or changes (4/8)

June 6, 2024 at 4:04 PM
For Aim 2, they do relate & do so in expected ways!
Individual differences in within-person variability were related to variables like age, gender, cognitive ability, & other trait levels
All effects emerged independent of effects rather due to trait levels or changes (4/8)
Individual differences in within-person variability were related to variables like age, gender, cognitive ability, & other trait levels
All effects emerged independent of effects rather due to trait levels or changes (4/8)
For Aim 1, the answer was a resounding YES 🫡
Substantial heterogeneity in within-person variability around Big Five trajectories emerged across all datasets & traits
Variability in sigma was comparable to - & sometimes even surpassed - variability in intercepts & slopes (3/8)
Substantial heterogeneity in within-person variability around Big Five trajectories emerged across all datasets & traits
Variability in sigma was comparable to - & sometimes even surpassed - variability in intercepts & slopes (3/8)


June 6, 2024 at 4:04 PM
For Aim 1, the answer was a resounding YES 🫡
Substantial heterogeneity in within-person variability around Big Five trajectories emerged across all datasets & traits
Variability in sigma was comparable to - & sometimes even surpassed - variability in intercepts & slopes (3/8)
Substantial heterogeneity in within-person variability around Big Five trajectories emerged across all datasets & traits
Variability in sigma was comparable to - & sometimes even surpassed - variability in intercepts & slopes (3/8)
Very happy to see this out now in JPSP!
We used 5 datasets (N = 128K) to do a deep dive into within-person variability for long-term personality development, a metric common in short-term dynamics work but (sadly!) pretty disregarded longitudinally (1/8)
psycnet.apa.org/record/2024-...
We used 5 datasets (N = 128K) to do a deep dive into within-person variability for long-term personality development, a metric common in short-term dynamics work but (sadly!) pretty disregarded longitudinally (1/8)
psycnet.apa.org/record/2024-...
June 6, 2024 at 4:03 PM
Very happy to see this out now in JPSP!
We used 5 datasets (N = 128K) to do a deep dive into within-person variability for long-term personality development, a metric common in short-term dynamics work but (sadly!) pretty disregarded longitudinally (1/8)
psycnet.apa.org/record/2024-...
We used 5 datasets (N = 128K) to do a deep dive into within-person variability for long-term personality development, a metric common in short-term dynamics work but (sadly!) pretty disregarded longitudinally (1/8)
psycnet.apa.org/record/2024-...
By far my favorite post-loaded package message in R. I personally think there is always space to acknowledge one’s grievances and as a mere third-party observer, I encourage it

December 14, 2023 at 3:30 PM
By far my favorite post-loaded package message in R. I personally think there is always space to acknowledge one’s grievances and as a mere third-party observer, I encourage it
And we're not done yet! Person-level sigma values proved to have predictive utility for a test outcome (health status), beyond any effects due to levels & changes in traits. Interactions also revealed novel insight as to how personality may relate to important outcomes (9/11)

November 1, 2023 at 3:10 PM
And we're not done yet! Person-level sigma values proved to have predictive utility for a test outcome (health status), beyond any effects due to levels & changes in traits. Interactions also revealed novel insight as to how personality may relate to important outcomes (9/11)
Further, the magnitude of heterogeneity in sigma was comparable to and on average even greater than individual differences in intercepts & slopes. The two *focal* individual differences of personality development which nearly always have estimated random effects in models (7/11)

November 1, 2023 at 3:09 PM
Further, the magnitude of heterogeneity in sigma was comparable to and on average even greater than individual differences in intercepts & slopes. The two *focal* individual differences of personality development which nearly always have estimated random effects in models (7/11)
We argue this is NOT appropriate & ignores substantial person-level variability in development.
Indeed, across all Big Five traits in each dataset, there was meaningful heterogeneity in sigma. When compared to the single sigma from a MLM, person-level sigmas varied a lot (6/11)
Indeed, across all Big Five traits in each dataset, there was meaningful heterogeneity in sigma. When compared to the single sigma from a MLM, person-level sigmas varied a lot (6/11)

November 1, 2023 at 3:09 PM
We argue this is NOT appropriate & ignores substantial person-level variability in development.
Indeed, across all Big Five traits in each dataset, there was meaningful heterogeneity in sigma. When compared to the single sigma from a MLM, person-level sigmas varied a lot (6/11)
Indeed, across all Big Five traits in each dataset, there was meaningful heterogeneity in sigma. When compared to the single sigma from a MLM, person-level sigmas varied a lot (6/11)
Other work beyond general personality development, in conjunction with research leveraging flexible models that assume no form, suggests we should expect people to differ in how well they adhere to a linear trajectory AND that we are missing important person-level variance (3/11)

November 1, 2023 at 3:07 PM
Other work beyond general personality development, in conjunction with research leveraging flexible models that assume no form, suggests we should expect people to differ in how well they adhere to a linear trajectory AND that we are missing important person-level variance (3/11)
and here is a fun picture to spice it up:
We found that there was substantial heterogeneity in best-fitting model forms - with most people actually adhering to a cubic form, on average. This figure depicts the distribution of best-fitting model forms for one dataset
We found that there was substantial heterogeneity in best-fitting model forms - with most people actually adhering to a cubic form, on average. This figure depicts the distribution of best-fitting model forms for one dataset

September 28, 2023 at 8:17 PM
and here is a fun picture to spice it up:
We found that there was substantial heterogeneity in best-fitting model forms - with most people actually adhering to a cubic form, on average. This figure depicts the distribution of best-fitting model forms for one dataset
We found that there was substantial heterogeneity in best-fitting model forms - with most people actually adhering to a cubic form, on average. This figure depicts the distribution of best-fitting model forms for one dataset