


Matt Tenan PhD ATC
@tenanatc.bsky.social
Using Statistical Analysis to Cut Through the BS.
Historically posting mostly about Sport, Physiology & Research Methods.
No idea what I'll post now. Follow and find out, I guess.
Historically posting mostly about Sport, Physiology & Research Methods.
No idea what I'll post now. Follow and find out, I guess.
Hey @apnews.com, I can fix the headline for you:
"US Carries Out Another Extra-Judicial Execution Killing 6 Unknown People, Trump Says"
"US Carries Out Another Extra-Judicial Execution Killing 6 Unknown People, Trump Says"

October 14, 2025 at 6:09 PM
Hey @apnews.com, I can fix the headline for you:
"US Carries Out Another Extra-Judicial Execution Killing 6 Unknown People, Trump Says"
"US Carries Out Another Extra-Judicial Execution Killing 6 Unknown People, Trump Says"
Reposted by Matt Tenan PhD ATC

It was bad enough when politicians were proposing bleach to treat COVID-19. But to actually change the label on acetaminophen?!? “Kennedy said that the F.D.A. would issue a note to doctors about the risk of acetaminophen during pregnancy and begin the process to make a safety change on the label.”

Update from Christina Jewett
www.nytimes.com
September 22, 2025 at 9:31 PM
It was bad enough when politicians were proposing bleach to treat COVID-19. But to actually change the label on acetaminophen?!? “Kennedy said that the F.D.A. would issue a note to doctors about the risk of acetaminophen during pregnancy and begin the process to make a safety change on the label.”
Reposted by Matt Tenan PhD ATC

References for the above, since these papers are not well known, but should be:
King et al (2017): doi.org/10.1111/ajps...
Huling & Mak (2024): doi.org/10.1515/jci-...
Cho et al (2013): doi.org/10.1111/stan...
King et al (2017): doi.org/10.1111/ajps...
Huling & Mak (2024): doi.org/10.1515/jci-...
Cho et al (2013): doi.org/10.1111/stan...
September 18, 2025 at 3:23 PM
References for the above, since these papers are not well known, but should be:
King et al (2017): doi.org/10.1111/ajps...
Huling & Mak (2024): doi.org/10.1515/jci-...
Cho et al (2013): doi.org/10.1111/stan...
King et al (2017): doi.org/10.1111/ajps...
Huling & Mak (2024): doi.org/10.1515/jci-...
Cho et al (2013): doi.org/10.1111/stan...
My pain point, the RStan viewer doesn't work 😥😥😥

I’ve been dipping my toe into using Positron for #rstats (have been using for everything else for 9 months or so and do love it!) and the biggest pain point is the limit on what I can run in the console - like even fairly tiny shiny apps require source() 😫 is this something I can fix?
August 17, 2025 at 2:35 AM
My pain point, the RStan viewer doesn't work 😥😥😥
July 30, 2025 at 11:17 PM
"Central Limit Theorem tells us that we only need to use Gaussian Models!"
Um, Maybe? I guess if you have infinite data and/or don't care about inference at all.
Those of us that want to efficiently detect differences with constrained data need to though... #statsky
Um, Maybe? I guess if you have infinite data and/or don't care about inference at all.
Those of us that want to efficiently detect differences with constrained data need to though... #statsky
July 25, 2025 at 1:31 PM
"Central Limit Theorem tells us that we only need to use Gaussian Models!"
Um, Maybe? I guess if you have infinite data and/or don't care about inference at all.
Those of us that want to efficiently detect differences with constrained data need to though... #statsky
Um, Maybe? I guess if you have infinite data and/or don't care about inference at all.
Those of us that want to efficiently detect differences with constrained data need to though... #statsky
Science is NOT self-correcting.
The arc of the moral universe does NOT bend toward justice.
The second Law of Thermodynamics states that an isolated system will only either increase randomness or stay the same, not become more orderly.
It requires us to put in energy to see defined change.
The arc of the moral universe does NOT bend toward justice.
The second Law of Thermodynamics states that an isolated system will only either increase randomness or stay the same, not become more orderly.
It requires us to put in energy to see defined change.
July 13, 2025 at 3:20 PM
Science is NOT self-correcting.
The arc of the moral universe does NOT bend toward justice.
The second Law of Thermodynamics states that an isolated system will only either increase randomness or stay the same, not become more orderly.
It requires us to put in energy to see defined change.
The arc of the moral universe does NOT bend toward justice.
The second Law of Thermodynamics states that an isolated system will only either increase randomness or stay the same, not become more orderly.
It requires us to put in energy to see defined change.
Proud to be an American...?

July 4, 2025 at 9:14 PM
Proud to be an American...?
Reposted by Matt Tenan PhD ATC

This is quite correct in the most important sense. I'll tell you a story: over ten years ago, I built an automatic p-hacker (in Matlab, I'm old).
It took some data, changed more or less every analysis parameter possible, used every outlier management schema, etc. and then subgroups.
It could...
It took some data, changed more or less every analysis parameter possible, used every outlier management schema, etc. and then subgroups.
It could...

I like this, but I think p hacking can and sometimes does rise to the level of fraud, especially 10 years into the replication crisis.
June 27, 2025 at 2:43 PM
This is quite correct in the most important sense. I'll tell you a story: over ten years ago, I built an automatic p-hacker (in Matlab, I'm old).
It took some data, changed more or less every analysis parameter possible, used every outlier management schema, etc. and then subgroups.
It could...
It took some data, changed more or less every analysis parameter possible, used every outlier management schema, etc. and then subgroups.
It could...
Should transgender athletes compete with cisgender athletes in sport? I don't know.
There are more Opinions, Position Stands, & Reviews than Original Research. The Original Research out there, is HIGHLY confounded, full of garbage, and invalid statistical analyses.
There are more Opinions, Position Stands, & Reviews than Original Research. The Original Research out there, is HIGHLY confounded, full of garbage, and invalid statistical analyses.

June 25, 2025 at 1:14 PM
Should transgender athletes compete with cisgender athletes in sport? I don't know.
There are more Opinions, Position Stands, & Reviews than Original Research. The Original Research out there, is HIGHLY confounded, full of garbage, and invalid statistical analyses.
There are more Opinions, Position Stands, & Reviews than Original Research. The Original Research out there, is HIGHLY confounded, full of garbage, and invalid statistical analyses.
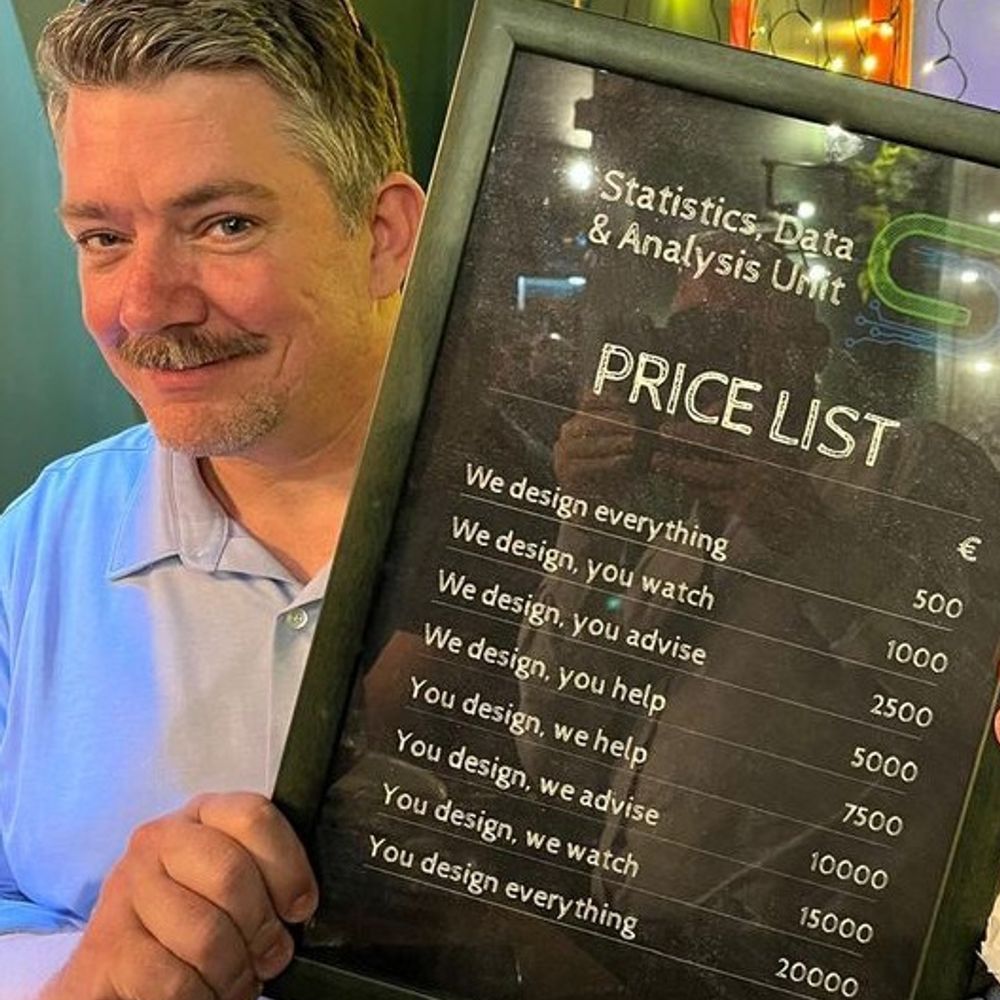
FEEDBACK REQUESTED! I've been tasked with developing a general flow chart for C-suite stakeholders on the process for planned observational causal inference work. I want the figure to be as correct as possible, fit on a Powerpoint slide, and be written for a layperson.
Thoughts #statsky #episky?
Thoughts #statsky #episky?

June 24, 2025 at 1:03 PM
Basically true for every field. Unfortunately, some fields are worse about this than others.

June 23, 2025 at 10:03 PM
Basically true for every field. Unfortunately, some fields are worse about this than others.

Reposted by Matt Tenan PhD ATC
Weird how Stanford Professor and "world's most cited epidemiologist" John Ionnidis can crank out a paper every 3 days and write bmj blog posts about science Kardashians, but is mute on all of this.

BREAKING: RFK Jr. fires ACIP, the panel responsible for advising on vaccines.
This breaks a promise to Sen. Bill Cassidy, who voted to advance Kennedy as HHS secretary on the condition that he would, among other things, keep ACIP in place.
www.statnews.com/2025/06/09/r...
This breaks a promise to Sen. Bill Cassidy, who voted to advance Kennedy as HHS secretary on the condition that he would, among other things, keep ACIP in place.
www.statnews.com/2025/06/09/r...

Health secretary RFK Jr. abruptly fires CDC vaccine advisory panel
Health secretary Robert F. Kennedy Jr. has taken the extraordinary step of firing the expert panel that advises the CDC.
www.statnews.com
June 9, 2025 at 9:24 PM
Weird how Stanford Professor and "world's most cited epidemiologist" John Ionnidis can crank out a paper every 3 days and write bmj blog posts about science Kardashians, but is mute on all of this.
Reposted by Matt Tenan PhD ATC

A senior machine learning expert at @stanforduniversity.bsky.social once interrupted a lecture of mine saying that #MachineLearning does not need a minimum sample size. I almost didn't know what to say. Almost.
June 3, 2025 at 8:56 AM
A senior machine learning expert at @stanforduniversity.bsky.social once interrupted a lecture of mine saying that #MachineLearning does not need a minimum sample size. I almost didn't know what to say. Almost.

Reposted by Matt Tenan PhD ATC

Flexible distributed lag models for count data using mgcv
@amstatnews.bsky.social www.tandfonline.com/doi/full/10....
@amstatnews.bsky.social www.tandfonline.com/doi/full/10....
Flexible distributed lag models for count data using mgcv
In this tutorial we present the use of R package mgcv to implement Distributed Lag Non-Linear Models (DLNMs) in a flexible way. Interpretation of smoothing splines as random quantities enables appr...
www.tandfonline.com
May 29, 2025 at 10:25 AM
Flexible distributed lag models for count data using mgcv
@amstatnews.bsky.social www.tandfonline.com/doi/full/10....
@amstatnews.bsky.social www.tandfonline.com/doi/full/10....
Headline: "CONSUMER CONFIDENCE SURGES!"
Actual data (see picture).
Nice to know we're all embellishing findings and it's not unique to a field.
Actual data (see picture).
Nice to know we're all embellishing findings and it's not unique to a field.

May 27, 2025 at 4:40 PM
Headline: "CONSUMER CONFIDENCE SURGES!"
Actual data (see picture).
Nice to know we're all embellishing findings and it's not unique to a field.
Actual data (see picture).
Nice to know we're all embellishing findings and it's not unique to a field.
Reposted by Matt Tenan PhD ATC
This is all VERY field specific.
I'm seeing Pharma moving away from their traditional SAS and more towards R. There are aspects of Life Sciences using Python but I'd be shocked if R weren't the predominant language in Life Sciences in 15 years.
I'm seeing Pharma moving away from their traditional SAS and more towards R. There are aspects of Life Sciences using Python but I'd be shocked if R weren't the predominant language in Life Sciences in 15 years.
May 26, 2025 at 8:12 PM
This is all VERY field specific.
I'm seeing Pharma moving away from their traditional SAS and more towards R. There are aspects of Life Sciences using Python but I'd be shocked if R weren't the predominant language in Life Sciences in 15 years.
I'm seeing Pharma moving away from their traditional SAS and more towards R. There are aspects of Life Sciences using Python but I'd be shocked if R weren't the predominant language in Life Sciences in 15 years.
Just bought a smoker. All future posts will now be about smoked meats, not statistics or sport.
Be prepared.
Be prepared.
May 25, 2025 at 11:36 PM
Just bought a smoker. All future posts will now be about smoked meats, not statistics or sport.
Be prepared.
Be prepared.
My favorite pizza restaurant now adds a 10% tariff surcharge.
May 23, 2025 at 7:11 PM
My favorite pizza restaurant now adds a 10% tariff surcharge.

Hey @noahgreifer.bsky.social
does this paper of yours have a peer-reviewed version or is there one in progress? It's great and I just want to suggest the "final version" to people as appropriate. Thanks! #Statsky
arxiv.org/abs/2106.10577
does this paper of yours have a peer-reviewed version or is there one in progress? It's great and I just want to suggest the "final version" to people as appropriate. Thanks! #Statsky
arxiv.org/abs/2106.10577

Choosing the Causal Estimand for Propensity Score Analysis of Observational Studies
Matching and weighting methods for observational studies involve the choice of an estimand, the causal effect with reference to a specific target population. Commonly used estimands include the averag...
arxiv.org
May 1, 2025 at 5:58 PM
Hey @noahgreifer.bsky.social
does this paper of yours have a peer-reviewed version or is there one in progress? It's great and I just want to suggest the "final version" to people as appropriate. Thanks! #Statsky
arxiv.org/abs/2106.10577
does this paper of yours have a peer-reviewed version or is there one in progress? It's great and I just want to suggest the "final version" to people as appropriate. Thanks! #Statsky
arxiv.org/abs/2106.10577