


The PyPy Project
@pypyproject.bsky.social
The developers of the PyPy project: a fast, compliant, open source Python interpreter.
https://pypy.org/
https://github.com/pypy/pypy
https://pypy.org/
https://github.com/pypy/pypy
Reposted by The PyPy Project

#Autobahn v25.10.2 Released: #WebSocket & #WAMP for Python with Critical Fixes and Enhanced CI/CD, #PyPy Support, Binary Wheels, and native NVX (SIMD vector acceleration)
- **📋 Full Announcement:** github.com/crossbario/a...
- **🌐 WAMP Protocol:** wamp-proto.org
- **📋 Full Announcement:** github.com/crossbario/a...
- **🌐 WAMP Protocol:** wamp-proto.org
November 7, 2025 at 10:11 AM
#Autobahn v25.10.2 Released: #WebSocket & #WAMP for Python with Critical Fixes and Enhanced CI/CD, #PyPy Support, Binary Wheels, and native NVX (SIMD vector acceleration)
- **📋 Full Announcement:** github.com/crossbario/a...
- **🌐 WAMP Protocol:** wamp-proto.org
- **📋 Full Announcement:** github.com/crossbario/a...
- **🌐 WAMP Protocol:** wamp-proto.org
New blog post by @cfbolz.bsky.social: "How fast can the RPython GC allocate?" pypy.org/posts/2025/0...
How fast can the RPython GC allocate?
While working on a paper about allocation profiling in
VMProf I got curious
about how quickly the RPython GC can allocate an object. I wrote a small
RPython benchmark program to get an idea of the ord
pypy.org
June 15, 2025 at 7:01 PM
New blog post by @cfbolz.bsky.social: "How fast can the RPython GC allocate?" pypy.org/posts/2025/0...
Reposted by The PyPy Project

This year's DLS Most Notable Paper award goes to
Compiling for Multi-language Task Migration
by Marc Feeley
The paper is motivated by the challenges of implementing continuations for an uncooperative environment, and worth a read!
Congratulations to the author! www.iro.umontreal.ca/~feeley/pape...
Compiling for Multi-language Task Migration
by Marc Feeley
The paper is motivated by the challenges of implementing continuations for an uncooperative environment, and worth a read!
Congratulations to the author! www.iro.umontreal.ca/~feeley/pape...
June 9, 2025 at 4:34 PM
This year's DLS Most Notable Paper award goes to
Compiling for Multi-language Task Migration
by Marc Feeley
The paper is motivated by the challenges of implementing continuations for an uncooperative environment, and worth a read!
Congratulations to the author! www.iro.umontreal.ca/~feeley/pape...
Compiling for Multi-language Task Migration
by Marc Feeley
The paper is motivated by the challenges of implementing continuations for an uncooperative environment, and worth a read!
Congratulations to the author! www.iro.umontreal.ca/~feeley/pape...
Reposted by The PyPy Project

"How slow is the tracing interpreter of PyPy's meta-tracing JIT?" cfbolz.de/posts/speed-...
Spoiler: for the microbenchmark I tried, the slowdown of the meta-tracing interpreter is about 900x
Spoiler: for the microbenchmark I tried, the slowdown of the meta-tracing interpreter is about 900x
How slow is the tracing interpreter of PyPy's meta-tracing JIT?
I wanted to investigate the warmup behavior of the PyPy interpreter, so I wrote
a somewhat arbitrary microbenchmark:
all_results = set()
num = int(sys.argv[1])
class A(object):
pass
def main():
cfbolz.de
June 12, 2025 at 7:04 AM
"How slow is the tracing interpreter of PyPy's meta-tracing JIT?" cfbolz.de/posts/speed-...
Spoiler: for the microbenchmark I tried, the slowdown of the meta-tracing interpreter is about 900x
Spoiler: for the microbenchmark I tried, the slowdown of the meta-tracing interpreter is about 900x
We just merged an improvement to the PyPy JIT heap optimizations: type based alias analysis for Python instances. Work was done by @cfbolz.bsky.social and their student Nico Rittinghaus.
May 21, 2025 at 8:16 AM
We just merged an improvement to the PyPy JIT heap optimizations: type based alias analysis for Python instances. Work was done by @cfbolz.bsky.social and their student Nico Rittinghaus.
Reposted by The PyPy Project

nedbatchelder.com/blog/202503/...
After nearly two years, I think this is finally ready: coverage․py
can use sys.monitoring to more efficiently measure branch
coverage.
After nearly two years, I think this is finally ready: coverage․py
can use sys.monitoring to more efficiently measure branch
coverage.
Faster branch coverage measurement
After nearly two years, I think this is finally ready: coverage.py can use <a rel="external noopener" href="https://docs.python.org/3/library/sys.monitoring.html">sys.monitoring</a> to more efficientl...
nedbatchelder.com
March 9, 2025 at 8:43 PM
nedbatchelder.com/blog/202503/...
After nearly two years, I think this is finally ready: coverage․py
can use sys.monitoring to more efficiently measure branch
coverage.
After nearly two years, I think this is finally ready: coverage․py
can use sys.monitoring to more efficiently measure branch
coverage.
Reposted by The PyPy Project

Fast on the heels of the last release, I have published a PyPy v7.3.19 bug-fix release with PyPy2.7, PyPY3.10 and a beta-quality PyPy3.11. Please try it out! The complete release note is at doc.pypy.org/en/latest/re...
PyPy v7.3.19: release of python 2.7, 3.10 and 3.11 beta, released 2025-02-26 — PyPy documentation
doc.pypy.org
February 26, 2025 at 12:26 PM
Fast on the heels of the last release, I have published a PyPy v7.3.19 bug-fix release with PyPy2.7, PyPY3.10 and a beta-quality PyPy3.11. Please try it out! The complete release note is at doc.pypy.org/en/latest/re...
Reposted by The PyPy Project
New blog post by my excellent master student Christoph Jung:
"Low Overhead Allocation Sampling with VMProf in PyPy's GC"
pypy.org/posts/2025/0...
Hopefully the first in a series about his work on a sampling allocation profiler for PyPy
"Low Overhead Allocation Sampling with VMProf in PyPy's GC"
pypy.org/posts/2025/0...
Hopefully the first in a series about his work on a sampling allocation profiler for PyPy
February 25, 2025 at 1:09 PM
New blog post by my excellent master student Christoph Jung:
"Low Overhead Allocation Sampling with VMProf in PyPy's GC"
pypy.org/posts/2025/0...
Hopefully the first in a series about his work on a sampling allocation profiler for PyPy
"Low Overhead Allocation Sampling with VMProf in PyPy's GC"
pypy.org/posts/2025/0...
Hopefully the first in a series about his work on a sampling allocation profiler for PyPy
Reposted by The PyPy Project
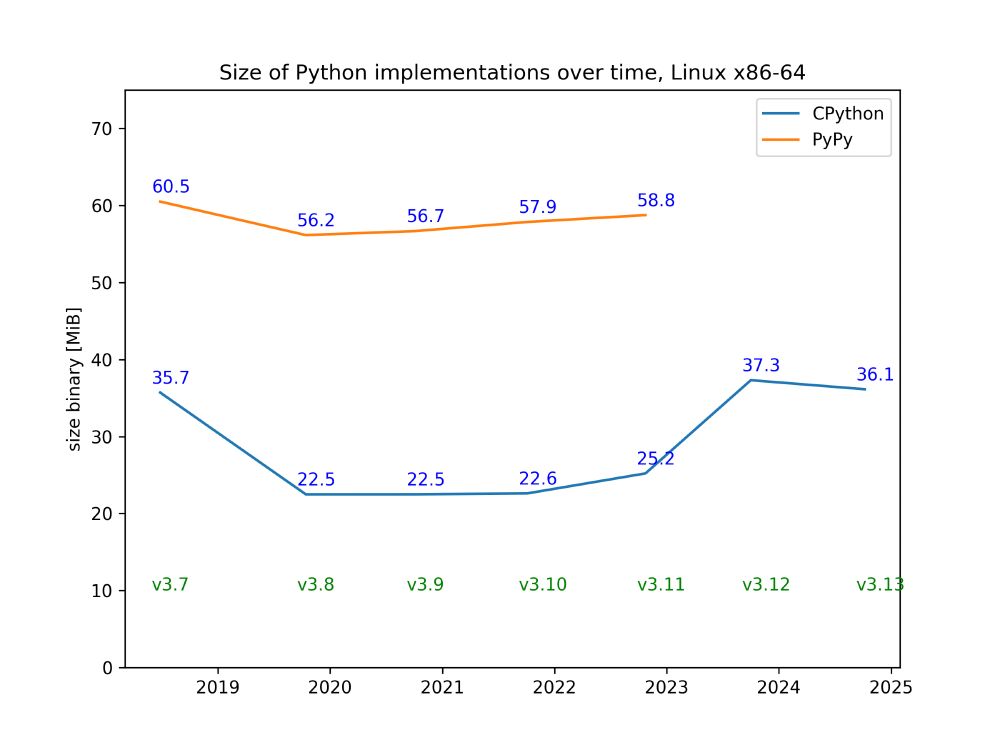
Since I was now wondering, here's PyPy VS CPython 3.x binary sizes
February 13, 2025 at 8:55 PM
Since I was now wondering, here's PyPy VS CPython 3.x binary sizes
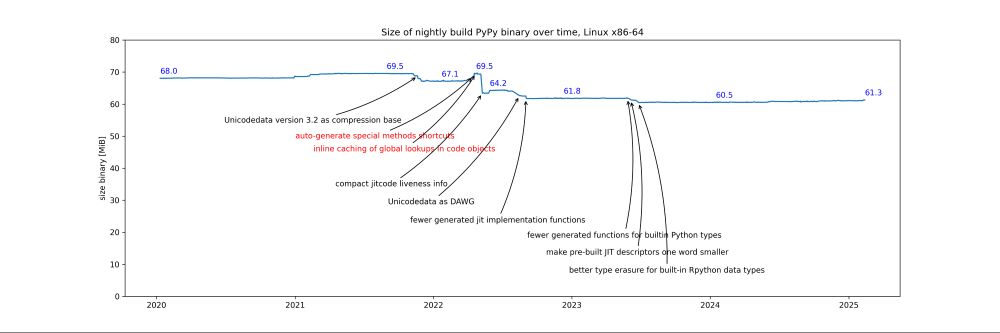
We don't do this regularly or anything, but every couple of years @cfbolz.bsky.social looks at how the PyPy binary sizes have developed. Looks like an ok balance between occasionally cleaning something up and thereby shrinking the binary; and then slow growth or explicit time/binary-size-tradeoffs.
February 13, 2025 at 8:04 PM
We don't do this regularly or anything, but every couple of years @cfbolz.bsky.social looks at how the PyPy binary sizes have developed. Looks like an ok balance between occasionally cleaning something up and thereby shrinking the binary; and then slow growth or explicit time/binary-size-tradeoffs.
As a response to these benchmarks, @cfbolz.bsky.social optimized `itertools.islice` for the common case where no step is given, and also for converting large but not very large integers to strings (basically any int that doesn't fit into 64 bits, but is also not really huge, maybe a few words).
Tim Peters benchmarking Python 3.13 vs PyPy on an OEIS sequence program he wrote: discuss.python.org/t/python-3-1...
(the results are complicated, on one version Python 3.13 wins, but on others PyPy does).
(the results are complicated, on one version Python 3.13 wins, but on others PyPy does).

Python 3.13.0 speed
This is a hearty “congratulations!” message. I often tackle a problem inspired by The On-Line Encyclopedia of Integer Sequences (OEIS). Here, sequence A378048: integers k such that k and k**2 together...
discuss.python.org
February 9, 2025 at 4:54 PM
As a response to these benchmarks, @cfbolz.bsky.social optimized `itertools.islice` for the common case where no step is given, and also for converting large but not very large integers to strings (basically any int that doesn't fit into 64 bits, but is also not really huge, maybe a few words).
Tim Peters benchmarking Python 3.13 vs PyPy on an OEIS sequence program he wrote: discuss.python.org/t/python-3-1...
(the results are complicated, on one version Python 3.13 wins, but on others PyPy does).
(the results are complicated, on one version Python 3.13 wins, but on others PyPy does).
Python 3.13.0 speed
This is a hearty “congratulations!” message. I often tackle a problem inspired by The On-Line Encyclopedia of Integer Sequences (OEIS). Here, sequence A378048: integers k such that k and k**2 together...
discuss.python.org
February 9, 2025 at 11:28 AM
Tim Peters benchmarking Python 3.13 vs PyPy on an OEIS sequence program he wrote: discuss.python.org/t/python-3-1...
(the results are complicated, on one version Python 3.13 wins, but on others PyPy does).
(the results are complicated, on one version Python 3.13 wins, but on others PyPy does).
Here's the blog post about the PyPY 7.3.18 release that came out yesterday. Thanks to @matti-p.bsky.social, our release manager! This the first version with 3.11 support (beta only so far).
Two cool other features in the thread below.
pypy.org/posts/2025/0...
Two cool other features in the thread below.
pypy.org/posts/2025/0...
PyPy v7.3.18 release
PyPy v7.3.18: release of python 2.7, 3.10 and 3.11 beta
The PyPy team is proud to release version 7.3.18 of PyPy.
This release includes a python 3.11 interpreter. We are labelling it "beta"
because it
pypy.org
February 7, 2025 at 7:47 AM
Here's the blog post about the PyPY 7.3.18 release that came out yesterday. Thanks to @matti-p.bsky.social, our release manager! This the first version with 3.11 support (beta only so far).
Two cool other features in the thread below.
pypy.org/posts/2025/0...
Two cool other features in the thread below.
pypy.org/posts/2025/0...
Reposted by The PyPy Project
PyPy 7.3.18, with Python3.11, 3.10, 2.7 is released. See the release note at doc.pypy.org/en/latest/re...
PyPy v7.3.18: release of python 2.7, 3.10 and 3.11 beta, released 2025-02-06 — PyPy documentation
doc.pypy.org
February 6, 2025 at 11:06 AM
PyPy 7.3.18, with Python3.11, 3.10, 2.7 is released. See the release note at doc.pypy.org/en/latest/re...