Publications of the Astronomical Society of Australia
@pasajournal.bsky.social
57 followers 25 following 21 posts
Official account for Publications of the Astronomical Society of Australia (PASA). We are a leading open access journal which publishes new and significant peer-reviewed research in astronomy and astrophysics. https://tinyurl.com/4n9324mj
Posts Media Videos Starter Packs
Recently published in PASA: "EMUSE: Evolutionary Map of the Universe Search Engine", Gupta, N. et al. This is Figure 1. The paper is open access, free to read at doi.org/10.1017/pasa... 🔭🧪
Caption for Figure 1: Overview of EMUSE (Evolutionary Map of the Universe Search Engine). Starting with the open-source OpenCLIP model, which is pre-trained on approximately 2.3 billion image-text pairs from the LAION dataset, we further fine-tuned it using an image-text dataset of extended radio sources in the EMU-PS1 survey. The fine-tuned model is then used to generate image embeddings of EMU sources based on PNG images from the EMU and AllWISE surveys at the positions of extended radio sources identified in the RG-CAT catalogue. The fine-tuned model, along with the generated image embeddings and catalogue metadata is integrated into the EMUSE application framework to retrieve similar sources. EMUSE facilitates the search of the embedding database and outputs a table of EMU survey radio sources that are similar to a given image or text prompt. The search engine is accessible at https://askap-emuse.streamlit.app/
Official account for PASA, the Publications of the Astronomical Society of Australia - would like to post about published research.
Recently published in PASA: "Discovery of Odd Radio Circles and Other Peculiars in the First Year of the EMU Survey using Object Detection", Gupta, N. et al. This is Figure 4. The paper is open access, free to read at doi.org/10.1017/pasa...
ORC candidates with unconfirmed host galaxies. The corresponding optical images are sourced from the DECaPS2 survey due to the absence of DESI LS DR10 coverage. In the top panel, white arrows indicate one central galaxy and two additional galaxies at the locations of radio emission peaks, making it challenging to conclusively identify the origin of the circular emission with the current data. In the bottom panel, the high density of sources in the optical image complicates the confirmation of a host galaxy. Full caption in the paper.
Recently published in PASA: "Breakthrough Listen: A Technosignature Search Around 27 Eclipsing Exoplanets Selected from the Transiting Exoplanet Survey Satellite Catalogue", Barrett, R. et al. This is Figure 2. The paper is open access, free to read at doi.org/10.1017/pasa...
An idealised example of a continuous narrowband drifting techonosignature interrupted by occultation. In this scenario, a transmitter in the vicinity of the target exoplanet emits a continuous narrowband signal until the fifth frame (second from the bottom), where the signal drops off at the predicted time of eclipse. The signal is strong, matches the predicted drift rate for the target (red dashed line), is present in all target_S frames, and absent in all target_R frames, near eliminating the possibility of an RFI source. This illustration was created in partial using SETIGEN (Brzycki et al. 2022).
Recently published in PASA: "Inferring Obscured Cosmic Black Hole Accretion History from AGN Found by JWST/MIRI CEERS Survey", Hsieh, C.-A. et al. This is Figure 2. The paper is open access, free to read at doi.org/10.1017/pasa...
Redshift evolution of BHAD. Green squares (labeled as ρ_Ldisk ) are derived from the L_disk of the composite and AGN candidates. Their vertical error bars include bootstrap and SED-fitting uncertainties. Red, yellow, and blue circles (labeled as ρLF) represent values inferred from the AGN LF (Section 3.2). These are derived using the modified Schechter function with α = 1.2 and α = 1.5 and the double power law(dpl), respectively. The x-axis value is the median redshift in the bins, ρLFa12 and ρLFDPL , shifted by 0.05 to display the error bar. Their vertical error bars indicate the 1 σ uncertainty from MCMC. The result from Yang et al. (2023) is shown in purple triangles. The horizontal error bars indicate the width of redshift bins. The black and brown
lines denote the two X-ray and one MIR BHAD as reported in previous studies. (Aird et al. 2015; Ananna et al. 2019; Kim et al. 2024), respectively. The blue line represents the star formation rate density (SFRD) from Madau and Dickinson (2014), scaled down by 10^(-5).
Recently published in PASA: "NuSTAR Observations of the Galaxy Cluster Abell 3667", Mirakhor., M. et al. This is Figure 1. To read the paper visit doi.org/10.1017/pasa...
Left: Background-subtracted and exposure-corrected NuSTAR mosaic image of the galaxy cluster Abell 3667 in the 4–24 keV energy band, combining data from both telescopes. The image was smoothed using a Gaussian kernel with a σ = 17.2 arcsec (7 pixels) to match NuSTAR’s PSF of ∼ 18 arcsec FWHM. The solid green circle (4.5 arcmin radius) indicates the region from which the source spectra were extracted, while the dashed green circles mark the regions used to extract the background spectra. The overlapping areas are excluded from the background regions. Right: Mosaicked Chandra image of Abell 3667, showing the locations of the point sources. The cyan box outlines the extent of our NuSTAR observations.
PASA is looking for two new Associate Editors. We encourage qualified applicants from all areas of astronomy. The due date for applications is July 15, and see the full ad at aas.org/jobregister/... . Any questions can be directed to Editor-in-Chief @astrominh.bsky.social
Recently published in PASA: "Efficient Summation of Arbitrary Masks – ESAM", Gupta, V. et al. This is Figure 5. To read the paper visit doi.org/10.1017/pasa...
The output of ESAM tree evaluation for an example pulse dispersed at a DM delay of 500 samples. When loaded with dedipsersion masks, the ESAM produces the bow-tie pattern in its dispersion transform.
Recently published in PASA: "The First Large Absorption Survey in H I (FLASH): II. Pilot Survey data release and first results", Yoon, H. et al. This is Figure 2. To read the paper visit doi.org/10.1017/pasa...
FLASH Pilot Survey Sky Coverage. Orange squares show the Pilot Survey 1 fields, and green squares the Pilot Survey 2 fields. Fields observed in both Pilot 1 and 2 are marked with star symbols. The coordinates are equatorial, with right ascension versus declination. The footprints of multi-wavelength surveys, such as BOSS, DES, MRC 1Jy, Stripe 82, WiggleZ, VIKING, and SPT-SZ, are included.
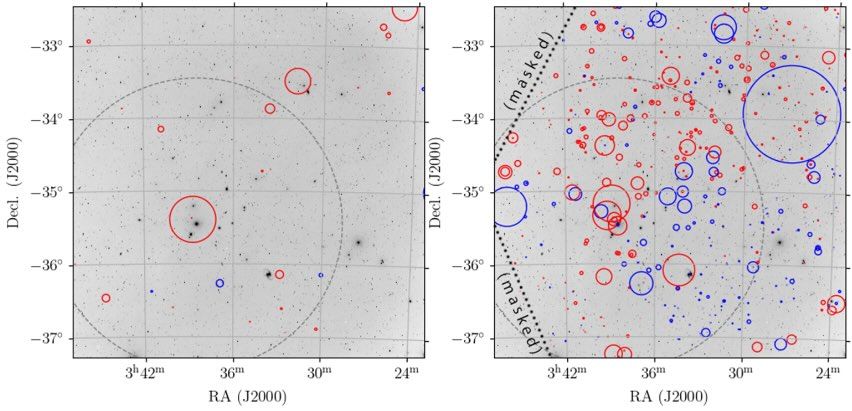
Recently published in PASA: "The Polarisation Sky Survey of the Universe’s Magnetism (POSSUM): Science Goals and Survey Description", Gaensler, B.M. et al. This is Figure 1. To read the paper visit doi.org/10.1017/pasa...
Comparison of NVSS (left; Taylor et al., 2009) and POSSUM (right) Band 1 RMs within the Fornax cluster’s virial radius (grey dashed circle), showcasing POSSUM’s transformative capability to probe magnetised gas in clusters, groups, and many other ∼degree-scale extragalactic objects. The background is a Digitized Sky Survey optical image (greyscale). Solid circles indicate the position, magnitude, and sign of RMs measured by each survey, with diameters proportional to (RM)^2 and colours indicating RM sign (red for positive, blue for negative). While only a few clusters or groups contain >∼ 10 NVSS RMs at sub-virial radii, POSSUM’s RM grid will sample thousands of these systems, including over a dozen with 100 or more RMs.
Recently published in PASA: "The GALAH survey: Data release 4", Buder, S. et al. This is Figure 2. To read the paper visit doi.org/10.1017/pasa...
Overview of the distribution of stars included in this fourth GALAH data release in Galactic coordinates with the centre of the Galaxy at the origin and the Gaia DR3 all-sky colour view as background. Shown are the targets of GALAH Phase 1 (dark blue) and Phase 2 (medium blue), the targets of the K2-HERMES follow-up along the ecliptic and TESS-HERMES in the TESS Southern Continuous Viewing Zone as well as CoRoT fields (pink). Both open and globular cluster points are shown in purple and orange, respectively. All other targets are shown in in light blue across the Southern sky
Recently published in PASA: "WALLABY pilot survey: properties of H I-selected dark sources and low surface brightness galaxies", O’Beirne, T. et al. This is Figure 7. To read the paper visit doi.org/10.1017/pasa...
Co-added g, r, i and z-band image convolved with a boxcar kernel of WALLABY J131244-155218. H I contours are overlaid. Although this appears to be a dark source from the g-band image, a faint optical counterpart is visible in the co-added image. For the full caption see the paper.
Recently published in PASA: "The Evolutionary Map of the Universe: A new radio atlas for the southern hemisphere sky
", Hopkins, A. et al. This is Figure 1. To read the paper visit doi.org/10.1017/pasa...
The EMU sky coverage to be delivered in 2028. The background image is the “Mellinger coloured” image. Each blue outline represents the footprint of a single ASKAP tile, and there are 853 such footprints comprising the full EMU survey. There is a small overlap between each adjacent tile. For the full caption please see the paper.
Recently published in PASA: "Three-dimensional simulations of accretion disks in pre-CE systems", Juarez-Garcia, A. et al. This is Figure 4. To read the paper visit doi.org/10.1017/S132...
Volumetric density rendering showing the accretion disk at four
times (t = 0.3 yr, 1.5 yr, 10.5 yr, and 21 yrs). For the full caption please view the paper.
Recently published in PASA: "WALLABY pilot survey: Spatially resolved gas scaling relations within the stellar discs of nearby galaxies", Lee, S. et al. This is Figure 4. To read the paper visit doi.org/10.1017/pasa...
Scaling relations of the global Hi mass fraction (top row) and Hi mass fraction within R25 (middle row) and R24 (bottom row) as a function of stellar mass, stellar mass surface density, and g25−i25 colour. For full caption please see the paper.
Recently published in PASA: "A main sequence CH-star in the globular cluster M55 (NGC 6809)", da Costa, G et al. This is Figure 4. To read the paper visit doi.org/10.1017/pasa...
Comparison of the observed spectrum of M55 star 307649, plotted in black, with those of M55 stars 305079 and 202495 plotted in red and blue, respectively. Full caption in paper.
PASA is now accepting Letters, for the publication of high impact and timely astronomical research that requires a quick turnaround. www.cambridge.org/core/journal...
PASA Letters
Welcome to Cambridge Core
www.cambridge.org
Recently published in PASA: "Brown dwarf number density in the JWST COSMOS-Web field", Chen, A. et al. This is Figure 2. To read the paper visit doi.org/10.1017/pasa...
F277W-F444W vs F115W-F277W colour-colour plot, Figure 2 from Chen et al. For the full caption see the paper.
Recently published in PASA: "Spectral-line performance of low-frequency radio telescope arrays: SKA-Low stations", Staveley-Smith. This is Figure 12. To read the paper please visit doi.org/10.1017/pasa...
The result of common analysis techniques to arrive at a ‘reduced’ track spectrum by continuum subtraction, flattening, and inverse reddening of the AAVS2, AAVS3, S8-1 and S8-6 waterfall plots in Fig. 11. The spectrum labelled ‘SVD’ has been subject to treatment by Singular Value Decomposition with n=2 singular values removed. The spectrum labelled ‘Fourier’ is the time-average of all spectra, followed by removal of the 2 strongest Fourier components. The spectrum labelled ‘imcontsub’ is also the time-average of all spectra, but followed by removal of a polynomial of degree 10. The spectrum labelled ‘HIPASS’ is the mean of the middle 50% (in time) of spectra, bandpass calibrated by the mean of the remaining spectra and subtraction of a polynomial of degree 3. None of the spectra is able to recover the artificial Cosmic Dawn signal (labelled ‘21CMFAST’) shown by the green dashed line, whose width is indicated by the light red shaded area.