


William Poirier
@olsisblue.bsky.social
PhD. candidate (ABD) @westernupolisci.bsky.social
MA from NYU and @universitelaval.bsky.social
Check my work here https://williampo1.github.io/
MA from NYU and @universitelaval.bsky.social
Check my work here https://williampo1.github.io/
Grateful to be this year’s recipient of the Dr. Harold D. Clarke Graduate Quantitative Research Methodology Fellowship. Many thanks to the awesome professors who continue to guide me through the wonders of research methods, and to the department for its ongoing support of my work! 🎉


November 10, 2025 at 6:49 PM
Grateful to be this year’s recipient of the Dr. Harold D. Clarke Graduate Quantitative Research Methodology Fellowship. Many thanks to the awesome professors who continue to guide me through the wonders of research methods, and to the department for its ongoing support of my work! 🎉
Reposted by William Poirier

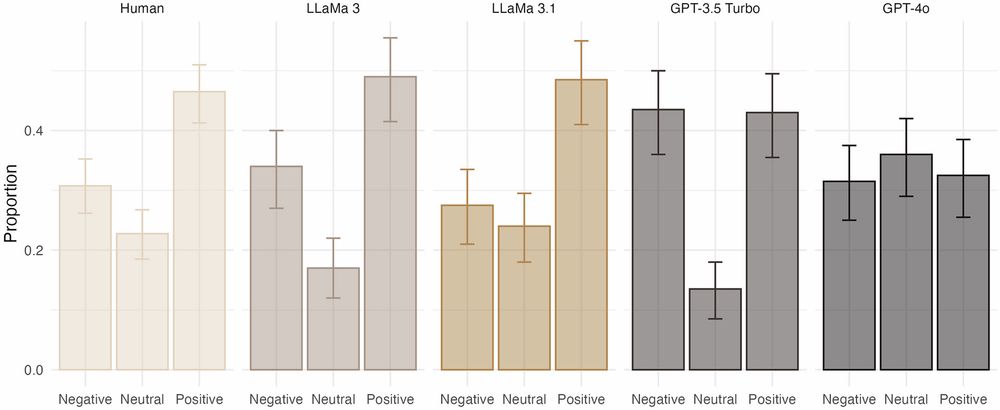
Just *published* our paper with @westernupolisci.bsky.social PhD student, Hunter Driggers, on LLM bias from party cues in annotation tasks. We extend a previous study showing annotation bias from human coders in the presence of party cues… LLM show similar bias 🧵:
rdcu.be/eIKCj
rdcu.be/eIKCj
LLMs as annotators: the effect of party cues on labelling decisions by large language models
Humanities and Social Sciences Communications - LLMs as annotators: the effect of party cues on labelling decisions by large language models
rdcu.be
September 29, 2025 at 9:04 PM
Just *published* our paper with @westernupolisci.bsky.social PhD student, Hunter Driggers, on LLM bias from party cues in annotation tasks. We extend a previous study showing annotation bias from human coders in the presence of party cues… LLM show similar bias 🧵:
rdcu.be/eIKCj
rdcu.be/eIKCj
Nous nous sommes ainsi assuré de rendre le tout digeste par l'utilisation d'exemples, en limitant le jargon, et en répétant les concepts importants. 4/4
August 19, 2025 at 1:52 PM
Nous nous sommes ainsi assuré de rendre le tout digeste par l'utilisation d'exemples, en limitant le jargon, et en répétant les concepts importants. 4/4
ainsi que les analyses de sensibilités en contexte descriptif. Le lecteur est ainsi amené à parfaire sa compréhension de la logique statistique derrière l'un des outils de recherche les plus courants en science politique qui est trop souvent omis de la formation méthodologique. ... 3/4
August 19, 2025 at 1:52 PM
ainsi que les analyses de sensibilités en contexte descriptif. Le lecteur est ainsi amené à parfaire sa compréhension de la logique statistique derrière l'un des outils de recherche les plus courants en science politique qui est trop souvent omis de la formation méthodologique. ... 3/4
Nous abordons le concept d'ignorabilité des processus générateurs de données des sondages probabilistes et non probabilistes. Ceci nous permet d'illustrer les conditions permettant à la calibration de fonctionner; le lien entre la taille de l'échantillon, le PGD, et le biais de sélection; ... 2/4
August 19, 2025 at 1:52 PM
Nous abordons le concept d'ignorabilité des processus générateurs de données des sondages probabilistes et non probabilistes. Ceci nous permet d'illustrer les conditions permettant à la calibration de fonctionner; le lien entre la taille de l'échantillon, le PGD, et le biais de sélection; ... 2/4
🚨 Nouvel article en libre accès @cjps-rcsp.bsky.social! En mise à jour d'un syllabus en méthodes? Avec @yannickdufresne.bsky.social, Anne-Sophie Charest, @skelalex.bsky.social, et @nadjim10.bsky.social, nous offrons une introduction aux enjeux de la calibration des sondages — en français! 1/4
August 19, 2025 at 1:51 PM
🚨 Nouvel article en libre accès @cjps-rcsp.bsky.social! En mise à jour d'un syllabus en méthodes? Avec @yannickdufresne.bsky.social, Anne-Sophie Charest, @skelalex.bsky.social, et @nadjim10.bsky.social, nous offrons une introduction aux enjeux de la calibration des sondages — en français! 1/4
Reposted by William Poirier

Political Science at Western University, Canada is searching for three tenure track assistant professors. There are two ads, one in International Politics (IR or comparative) and one in Comparative or Canadian. Ads are here: www.uwo.ca/facultyrelat...

Faculty (UWOFA)
Western University, in vibrant London, Ontario, delivers an academic and student experience second to none.
www.uwo.ca
July 28, 2025 at 9:16 PM
Political Science at Western University, Canada is searching for three tenure track assistant professors. There are two ads, one in International Politics (IR or comparative) and one in Comparative or Canadian. Ads are here: www.uwo.ca/facultyrelat...
Reposted by William Poirier

🚨 I'm really happy to see my new paper "Can riots represent? A democratic theory" now out in @ajpseditor.bsky.social
onlinelibrary.wiley.com/doi/10.1111/...
onlinelibrary.wiley.com/doi/10.1111/...

American Journal of Political Science | MPSA Journal | Wiley Online Library
Political theory has been perennially concerned with interrogating, identifying, and clarifying the political functions of riots. Yet, political theorists have mostly fallen short of explaining the r...
onlinelibrary.wiley.com
May 27, 2025 at 3:40 PM
🚨 I'm really happy to see my new paper "Can riots represent? A democratic theory" now out in @ajpseditor.bsky.social
onlinelibrary.wiley.com/doi/10.1111/...
onlinelibrary.wiley.com/doi/10.1111/...
There are times though where plots are superior to tables such as in multiple comparisons. Not to toot my own horn, but that is exactly what we tried to accomplish here:
www.cambridge.org/core/journal...
www.cambridge.org/core/journal...
Decoupling Visualization and Testing when Presenting Confidence Intervals | Political Analysis | Cambridge Core
Decoupling Visualization and Testing when Presenting Confidence Intervals
www.cambridge.org
April 24, 2025 at 2:27 PM
There are times though where plots are superior to tables such as in multiple comparisons. Not to toot my own horn, but that is exactly what we tried to accomplish here:
www.cambridge.org/core/journal...
www.cambridge.org/core/journal...
So, trying to add extra information contained in the table into the plot risk obscuring the message the plot was created for.
April 24, 2025 at 2:23 PM
So, trying to add extra information contained in the table into the plot risk obscuring the message the plot was created for.
My reservation here is that to me, the goal of visualization exercises is to render immediately apparent to a lay person what is hidden away in regression tables. A visualization will never fully satisfy quantitatively inclined scholars the way a table would. It's not their point.
April 24, 2025 at 2:22 PM
My reservation here is that to me, the goal of visualization exercises is to render immediately apparent to a lay person what is hidden away in regression tables. A visualization will never fully satisfy quantitatively inclined scholars the way a table would. It's not their point.
I'm with @dandekadt.bsky.social and @andrew.heiss.phd in that these looked like distributions of something at a first glance, but it's actually an ad hoc shading. Hence pairing them to posterior distributions would get the point across while being meaningful.
April 24, 2025 at 2:18 PM
I'm with @dandekadt.bsky.social and @andrew.heiss.phd in that these looked like distributions of something at a first glance, but it's actually an ad hoc shading. Hence pairing them to posterior distributions would get the point across while being meaningful.
Reposted by William Poirier
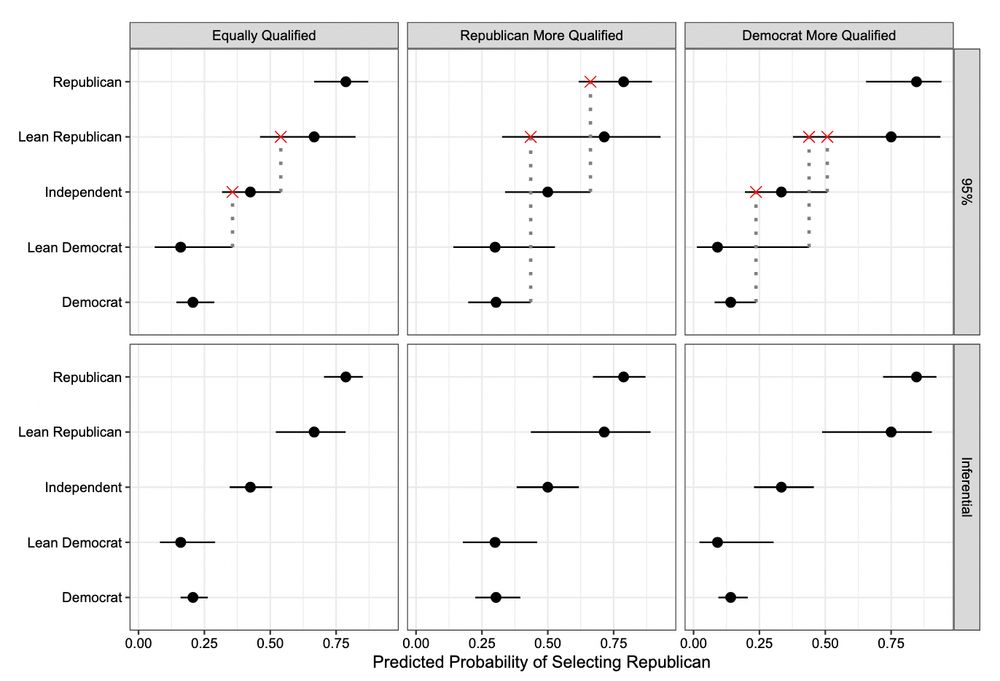
Currently in FirstView: “Decoupling Visualization and Testing when Presenting Confidence Intervals” by David Armstrong and @olsisblue.bsky.social. They develop a way to present estimates and confidence intervals to accurately visualize the underlying pairwise tests.
March 28, 2025 at 7:18 PM
Currently in FirstView: “Decoupling Visualization and Testing when Presenting Confidence Intervals” by David Armstrong and @olsisblue.bsky.social. They develop a way to present estimates and confidence intervals to accurately visualize the underlying pairwise tests.
Forgot to mention, Prof. Armstrong also prepared open access seminars on the topic where he dives a bit more into the weeds of the issue and its implementation and usage in R and Stata. Links below!
instats.org/seminar/usin...
instats.org/seminar/usin...
instats.org/seminar/usin...
instats.org/seminar/usin...

Using Confidence Intervals for Visual Testing in R (Free Seminar) - On-Demand
This Instats seminar on Using Confidence Intervals for Visual Testing in R (Free Seminar) taught by Dave Armstrong will help you take your research to the next level. Sign up today!
instats.org
January 17, 2025 at 6:38 PM
Forgot to mention, Prof. Armstrong also prepared open access seminars on the topic where he dives a bit more into the weeds of the issue and its implementation and usage in R and Stata. Links below!
instats.org/seminar/usin...
instats.org/seminar/usin...
instats.org/seminar/usin...
instats.org/seminar/usin...
This is all implemented our VizTest package. You can install the R version from here: github.com/davidaarmstr...
And the Stata version here: github.com/davidaarmstr...
And the Stata version here: github.com/davidaarmstr...

GitHub - davidaarmstrong/VizTest
Contribute to davidaarmstrong/VizTest development by creating an account on GitHub.
github.com
January 17, 2025 at 2:41 PM
This is all implemented our VizTest package. You can install the R version from here: github.com/davidaarmstr...
And the Stata version here: github.com/davidaarmstr...
And the Stata version here: github.com/davidaarmstr...
Our procedure figures out what the visualized confidence level should be such that all pairwise tests are visually correct WHILE maintaining accurate comparison with 0 (the null hypothesis).
January 17, 2025 at 2:39 PM
Our procedure figures out what the visualized confidence level should be such that all pairwise tests are visually correct WHILE maintaining accurate comparison with 0 (the null hypothesis).
You might want to visually test whether the estimates for July 2020 and July 2022 are statistically different from each other by looking at the overlap of their CI. You might know that it's wrong, but it's so tempting!

January 17, 2025 at 2:39 PM
You might want to visually test whether the estimates for July 2020 and July 2022 are statistically different from each other by looking at the overlap of their CI. You might know that it's wrong, but it's so tempting!
It's out in @polanalysis.bsky.social! David Armstrong and I develop a way to present estimates and their CI that accurately visualizes the underlying pairwise tests. We provide packages in R and Stata, check it out!
doi.org/10.1017/pan....
doi.org/10.1017/pan....
doi.org
January 17, 2025 at 2:18 PM
It's out in @polanalysis.bsky.social! David Armstrong and I develop a way to present estimates and their CI that accurately visualizes the underlying pairwise tests. We provide packages in R and Stata, check it out!
doi.org/10.1017/pan....
doi.org/10.1017/pan....
Reposted by William Poirier

There are new #OpenAccess articles from @polanalysis.bsky.social available on the journal's #FirstView page -
cup.org/40mppbd
Inc. papers by @tara-slough.bsky.social, @devincaughey.bsky.social, @mehrl.bsky.social, @olsisblue.bsky.social, @corneliusfritz.bsky.social, @pkoc.bsky.social & and more
cup.org/40mppbd
Inc. papers by @tara-slough.bsky.social, @devincaughey.bsky.social, @mehrl.bsky.social, @olsisblue.bsky.social, @corneliusfritz.bsky.social, @pkoc.bsky.social & and more

January 17, 2025 at 1:45 PM
There are new #OpenAccess articles from @polanalysis.bsky.social available on the journal's #FirstView page -
cup.org/40mppbd
Inc. papers by @tara-slough.bsky.social, @devincaughey.bsky.social, @mehrl.bsky.social, @olsisblue.bsky.social, @corneliusfritz.bsky.social, @pkoc.bsky.social & and more
cup.org/40mppbd
Inc. papers by @tara-slough.bsky.social, @devincaughey.bsky.social, @mehrl.bsky.social, @olsisblue.bsky.social, @corneliusfritz.bsky.social, @pkoc.bsky.social & and more
First full reversed rainbow! Hope @hankgreen.bsky.social is proud!
Connections
Puzzle #551
🟪🟪🟪🟪
🟦🟦🟦🟦
🟩🟩🟩🟩
🟨🟨🟨🟨
Connections
Puzzle #551
🟪🟪🟪🟪
🟦🟦🟦🟦
🟩🟩🟩🟩
🟨🟨🟨🟨
December 13, 2024 at 7:38 PM
First full reversed rainbow! Hope @hankgreen.bsky.social is proud!
Connections
Puzzle #551
🟪🟪🟪🟪
🟦🟦🟦🟦
🟩🟩🟩🟩
🟨🟨🟨🟨
Connections
Puzzle #551
🟪🟪🟪🟪
🟦🟦🟦🟦
🟩🟩🟩🟩
🟨🟨🟨🟨