

NCAA DataSauce
@ncaadatasauce.bsky.social
51 followers
32 following
36 posts
Visualizing NCAA Division 1 Hockey
As seen on: Princeton Tiger Hockey
Posts
Media
Videos
Starter Packs
NCAA DataSauce
@ncaadatasauce.bsky.social
· Mar 20
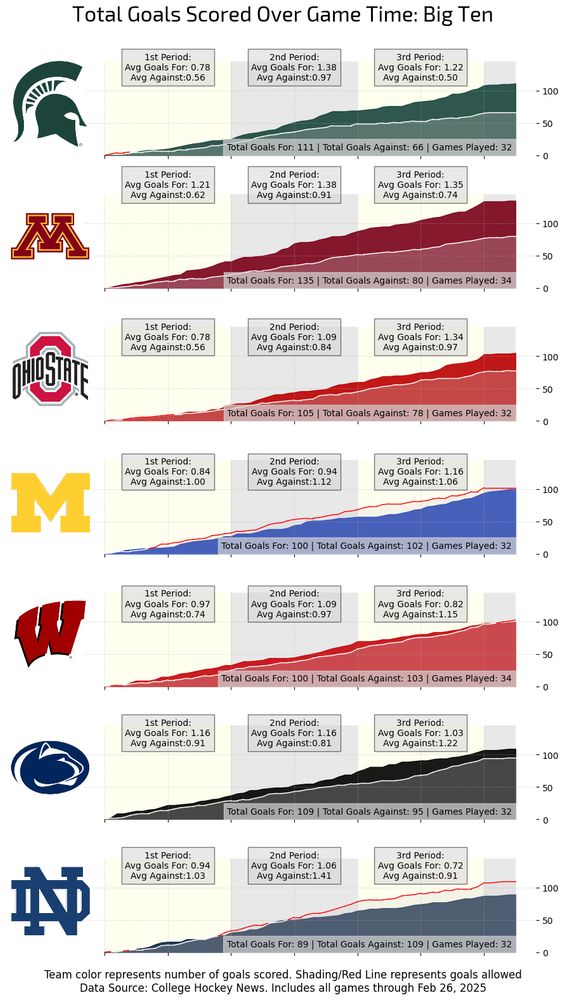
ECAC Final Four: Statistical Breakdown (Part 1)📊🏒
The final four teams in ECAC face off in Lake Placid for the title. Here’s how they compare in:
🔥 Goals scored vs. allowed over time
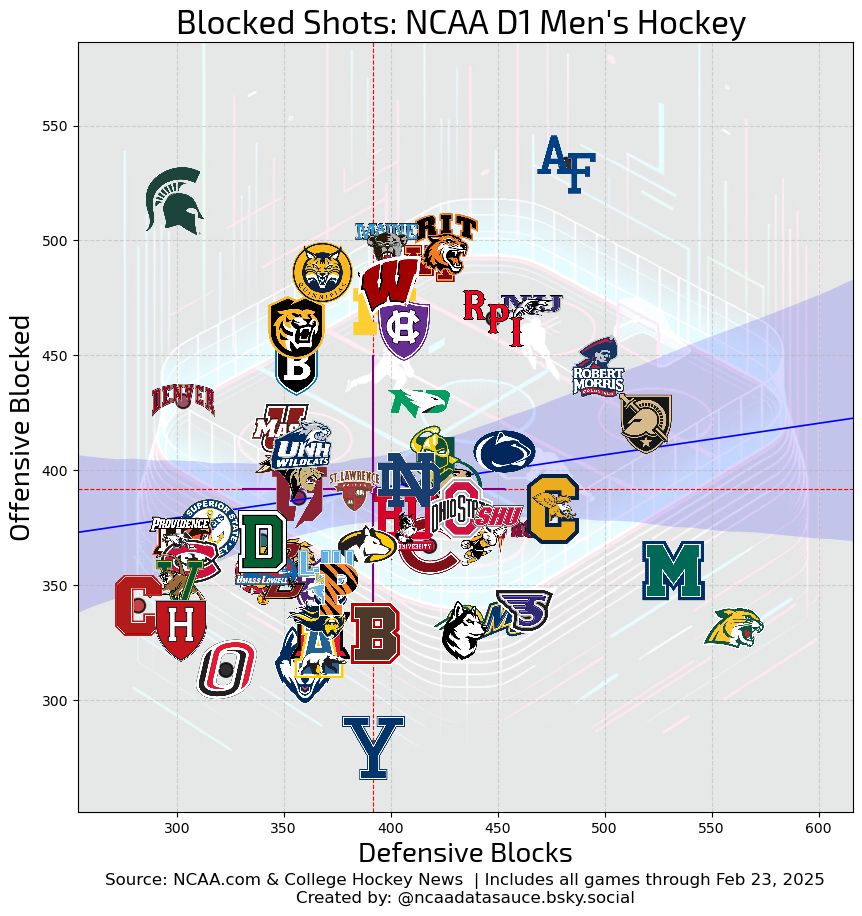
🎯 Shot generation & suppression
📈 Per-game trends in scoring & shots
#ECAC #CollegeHockey #DataViz
The final four teams in ECAC face off in Lake Placid for the title. Here’s how they compare in:
🔥 Goals scored vs. allowed over time
🎯 Shot generation & suppression
📈 Per-game trends in scoring & shots
#ECAC #CollegeHockey #DataViz


NCAA DataSauce
@ncaadatasauce.bsky.social
· Mar 19
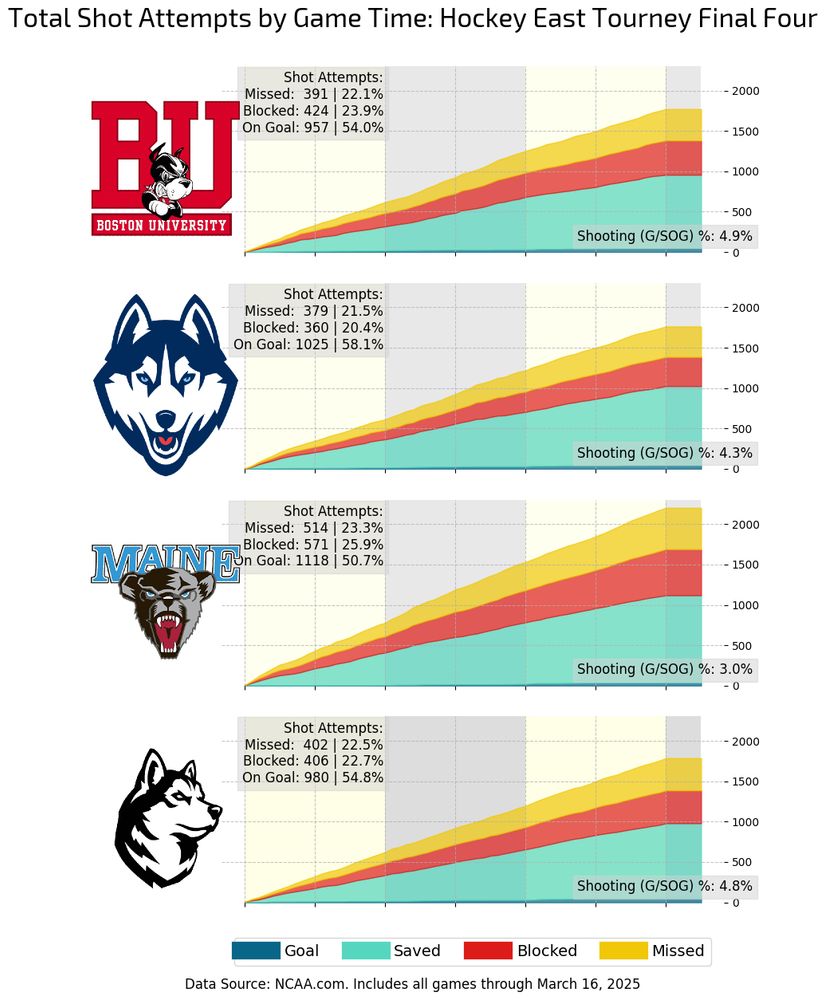
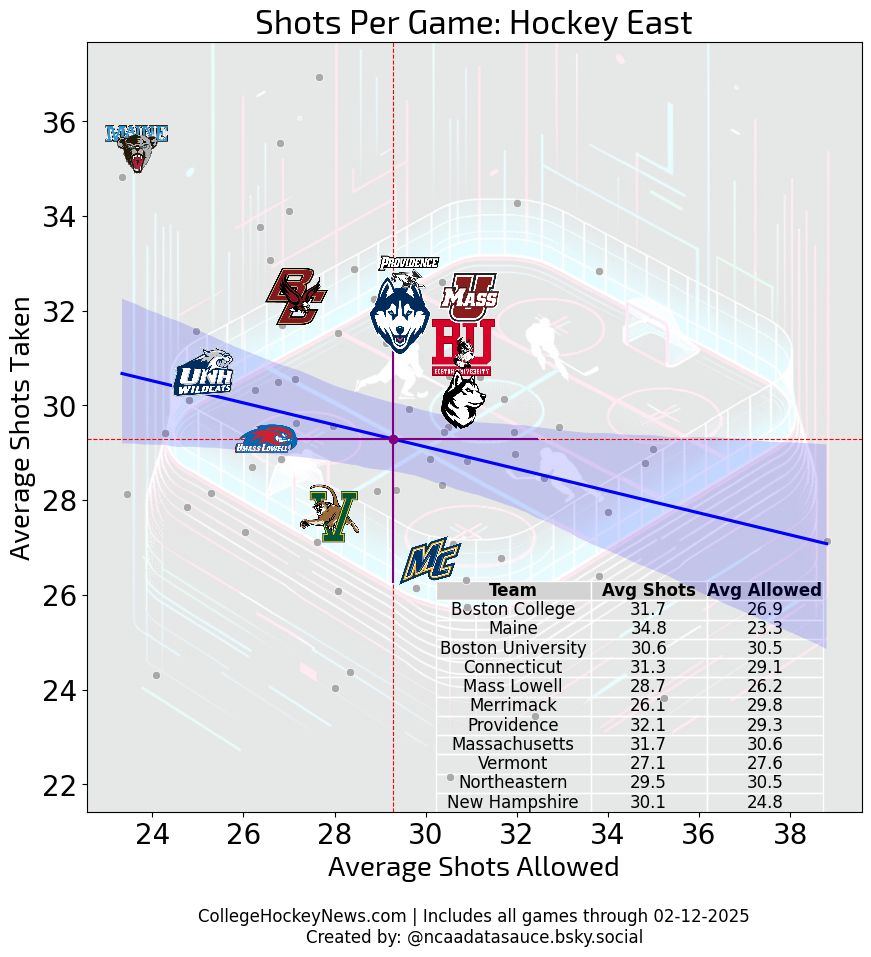
Hockey East Final Four: Statistical Breakdown (Part 1 of 3)📊🏒
The final four teams in Hockey East—BU, UConn, Maine, and Northeastern—face off for the title. Here’s how they compare in:
📈 Per-game trends in scoring & shots
Which team’s numbers stand out?
#HockeyEast #CollegeHockey #DataViz
The final four teams in Hockey East—BU, UConn, Maine, and Northeastern—face off for the title. Here’s how they compare in:
📈 Per-game trends in scoring & shots
Which team’s numbers stand out?
#HockeyEast #CollegeHockey #DataViz


Reposted by NCAA DataSauce

Sean
@sean6on5.bsky.social
· Feb 14


