


Lucas Stich
@lucasstich.bsky.social
Assistant Professor of Marketing Analytics at Julius-Maximilians-Universität Würzburg
Reposted by Lucas Stich

🚨Free data alert!! 🚨 Please share.
Large new dataset of Amazon product reviews, including full text and photos and product characteristics, with individual *reviews labeled as fake reviews*.
I believe this is the first publicly available data of this kind.
github.com/bretthollenb...
Large new dataset of Amazon product reviews, including full text and photos and product characteristics, with individual *reviews labeled as fake reviews*.
I believe this is the first publicly available data of this kind.
github.com/bretthollenb...
July 11, 2025 at 9:18 PM
🚨Free data alert!! 🚨 Please share.
Large new dataset of Amazon product reviews, including full text and photos and product characteristics, with individual *reviews labeled as fake reviews*.
I believe this is the first publicly available data of this kind.
github.com/bretthollenb...
Large new dataset of Amazon product reviews, including full text and photos and product characteristics, with individual *reviews labeled as fake reviews*.
I believe this is the first publicly available data of this kind.
github.com/bretthollenb...
Reposted by Lucas Stich

Histograms are incredibly useful, interpretable, and common in BI. But building histograms that work well out of the box — no matter the data — is trickier than it sounds. We share some of the challenges faced, and decisions made, when designing histograms for Observable Canvases:
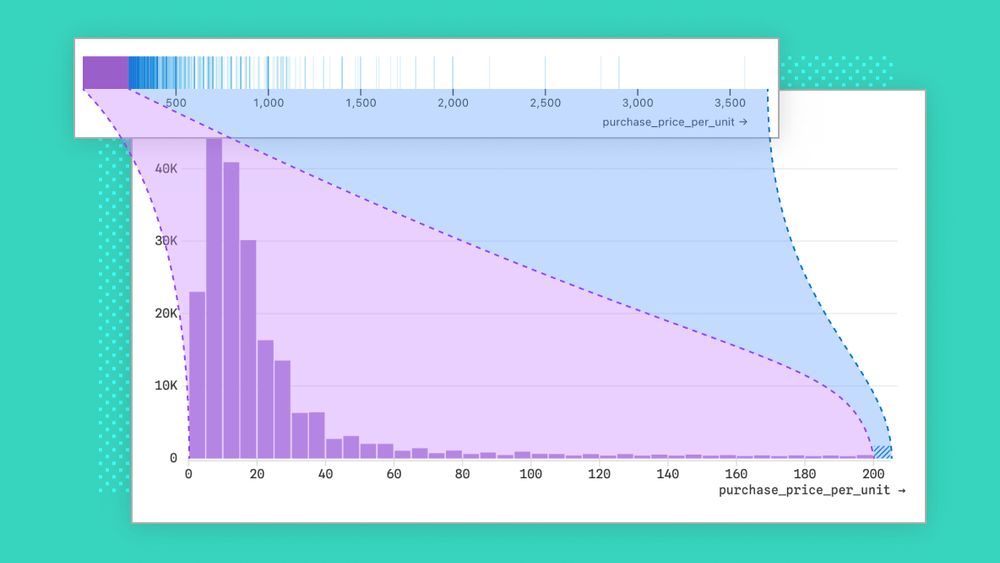
Designing better out-of-the-box histograms
Given how common histograms are in BI tools, you might think they’re easy to design. Think again. We share challenges we encountered, and how we handled them, while designing better out-of-the-box…
buff.ly
June 5, 2025 at 7:30 PM
Histograms are incredibly useful, interpretable, and common in BI. But building histograms that work well out of the box — no matter the data — is trickier than it sounds. We share some of the challenges faced, and decisions made, when designing histograms for Observable Canvases:
Reposted by Lucas Stich

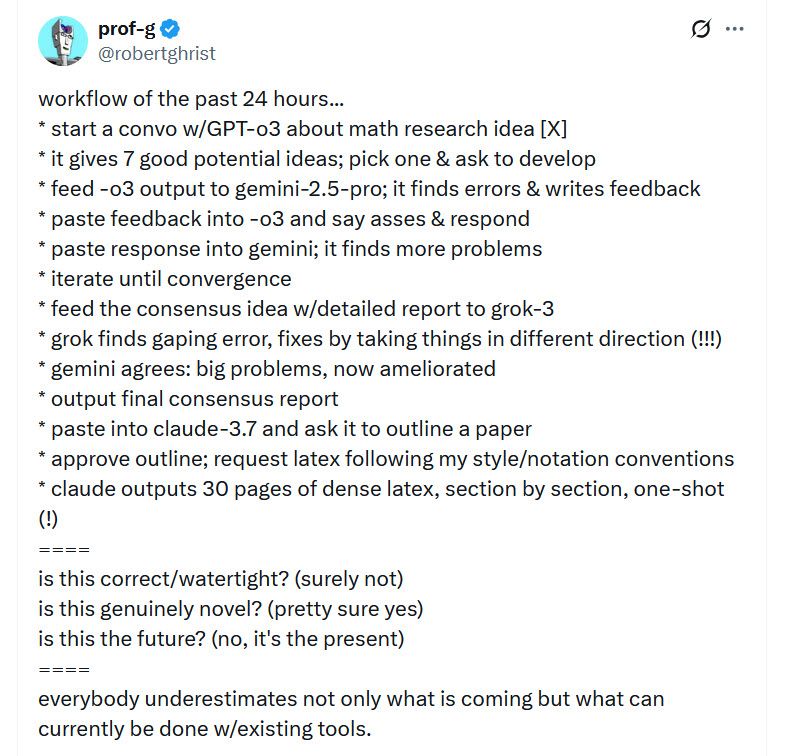
What cyborg work looks like as an academic, by Robert Ghrist, a mathematician and associate dean of undergraduate education at the University of Pennsylvania.
May 1, 2025 at 3:36 PM
What cyborg work looks like as an academic, by Robert Ghrist, a mathematician and associate dean of undergraduate education at the University of Pennsylvania.
Reposted by Lucas Stich

📚😅🎉
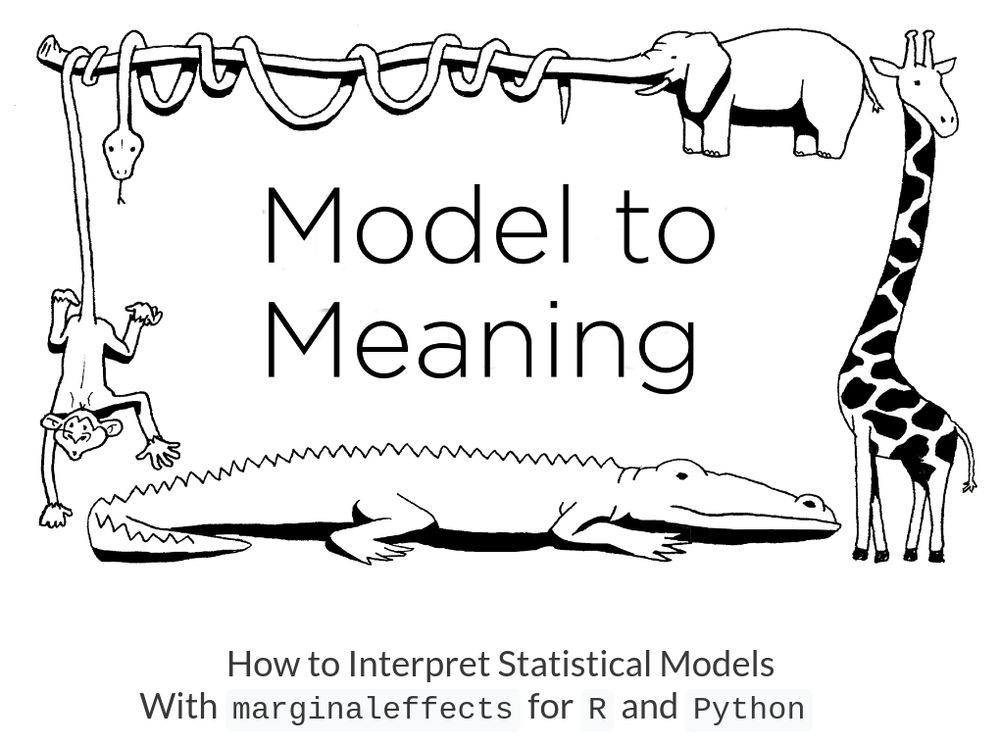
Yay!! I just submitted the complete manuscript of my upcoming book to the publisher!
Learn to easily and clearly interpret (almost) any stats model w/ R or Python. Simple ideas, consistent workflow, powerful tools, detailed case studies.
Read it for free @ marginaleffects.com
#RStats #PyData
Yay!! I just submitted the complete manuscript of my upcoming book to the publisher!
Learn to easily and clearly interpret (almost) any stats model w/ R or Python. Simple ideas, consistent workflow, powerful tools, detailed case studies.
Read it for free @ marginaleffects.com
#RStats #PyData
April 10, 2025 at 7:06 PM
📚😅🎉
Yay!! I just submitted the complete manuscript of my upcoming book to the publisher!
Learn to easily and clearly interpret (almost) any stats model w/ R or Python. Simple ideas, consistent workflow, powerful tools, detailed case studies.
Read it for free @ marginaleffects.com
#RStats #PyData
Yay!! I just submitted the complete manuscript of my upcoming book to the publisher!
Learn to easily and clearly interpret (almost) any stats model w/ R or Python. Simple ideas, consistent workflow, powerful tools, detailed case studies.
Read it for free @ marginaleffects.com
#RStats #PyData
Reposted by Lucas Stich

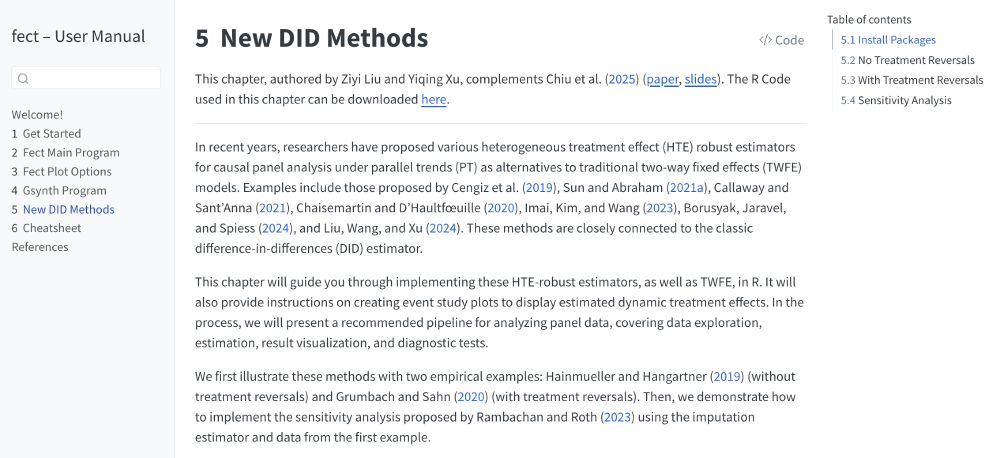
We streamlined six new DID-like estimators and created this tutorial for implementation in R.
yiqingxu.org/packages/fec...
Hope you no longer need to spend months figuring out what these estimators are and how to use them.
yiqingxu.org/packages/fec...
Hope you no longer need to spend months figuring out what these estimators are and how to use them.
February 21, 2025 at 4:41 AM
We streamlined six new DID-like estimators and created this tutorial for implementation in R.
yiqingxu.org/packages/fec...
Hope you no longer need to spend months figuring out what these estimators are and how to use them.
yiqingxu.org/packages/fec...
Hope you no longer need to spend months figuring out what these estimators are and how to use them.
People Pay for the Right to Bid — and Then Overbid anderson-review.ucla.edu/people-pay-f...

People Pay for the Right to Bid — and Then Overbid - UCLA Anderson Review
Bidders sacrifice a better price to avoid ending up with nothing
anderson-review.ucla.edu
February 5, 2025 at 6:11 PM
People Pay for the Right to Bid — and Then Overbid anderson-review.ucla.edu/people-pay-f...
Reposted by Lucas Stich

🚨 New blog post! 🚨
If you want to learn about:
🎨 Monochrome colour palettes
📊 Designing better black & white visualisations
🛠️ Rethinking single-colour chart design
Read this ➡️ nrennie.rbind.io/blog/monochr...
#RStats #DataViz #ggplot2 #RLadies
If you want to learn about:
🎨 Monochrome colour palettes
📊 Designing better black & white visualisations
🛠️ Rethinking single-colour chart design
Read this ➡️ nrennie.rbind.io/blog/monochr...
#RStats #DataViz #ggplot2 #RLadies
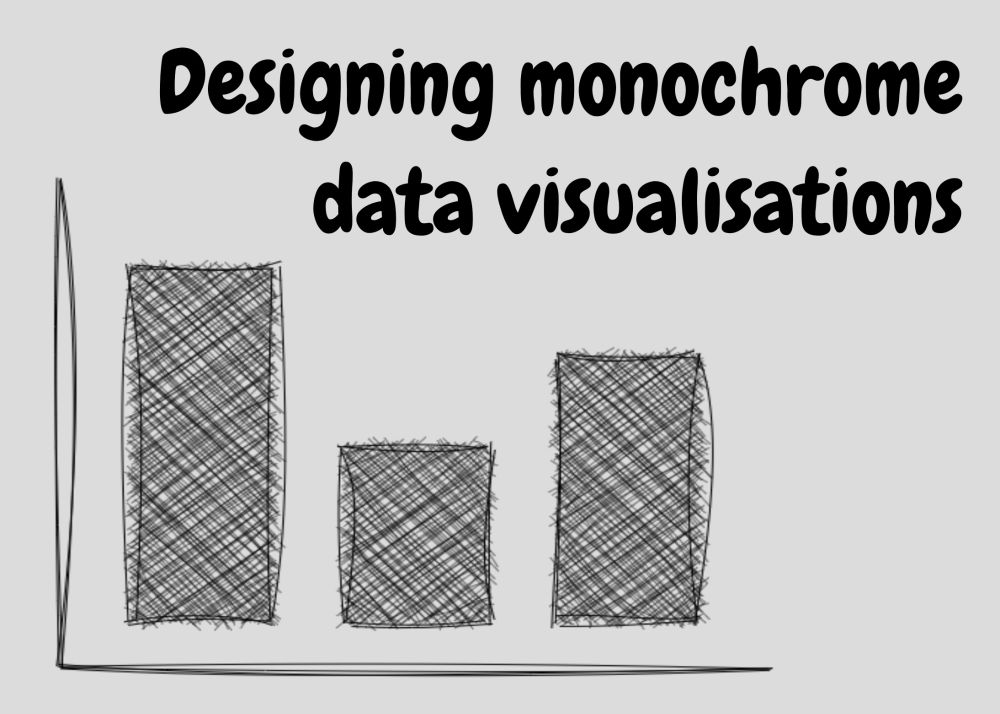
Designing monochrome data visualisations | Nicola Rennie
In data visualisations, colours are often used to show values or categories of data. However, sometimes you might not be able to or want to use colour. This blog post discusses some tips for designing...
nrennie.rbind.io
February 5, 2025 at 9:45 AM
🚨 New blog post! 🚨
If you want to learn about:
🎨 Monochrome colour palettes
📊 Designing better black & white visualisations
🛠️ Rethinking single-colour chart design
Read this ➡️ nrennie.rbind.io/blog/monochr...
#RStats #DataViz #ggplot2 #RLadies
If you want to learn about:
🎨 Monochrome colour palettes
📊 Designing better black & white visualisations
🛠️ Rethinking single-colour chart design
Read this ➡️ nrennie.rbind.io/blog/monochr...
#RStats #DataViz #ggplot2 #RLadies
Reposted by Lucas Stich

We've added an article about RStudio's Rproj files and how to adapt related workflows, if you're starting to kick the tires on Positron. If this interests you, check it out 👀
positron.posit.co/rstudio-rpro...
#rstats #rstudio #positron
positron.posit.co/rstudio-rpro...
#rstats #rstudio #positron
The Rproj File – Positron
positron.posit.co
January 22, 2025 at 5:43 PM
We've added an article about RStudio's Rproj files and how to adapt related workflows, if you're starting to kick the tires on Positron. If this interests you, check it out 👀
positron.posit.co/rstudio-rpro...
#rstats #rstudio #positron
positron.posit.co/rstudio-rpro...
#rstats #rstudio #positron
Reposted by Lucas Stich

📊 vs. 🥧
I made a tiny teaching tool to help me interactively demo + share differences between 📊 and 🥧
Play: I find that tinkering with data + visuals in class reinforces understanding far more than slides or readings
Save + share: Copy the url to link the current data
👉 barvpie.netlify.app
I made a tiny teaching tool to help me interactively demo + share differences between 📊 and 🥧
Play: I find that tinkering with data + visuals in class reinforces understanding far more than slides or readings
Save + share: Copy the url to link the current data
👉 barvpie.netlify.app
November 25, 2024 at 4:28 PM
📊 vs. 🥧
I made a tiny teaching tool to help me interactively demo + share differences between 📊 and 🥧
Play: I find that tinkering with data + visuals in class reinforces understanding far more than slides or readings
Save + share: Copy the url to link the current data
👉 barvpie.netlify.app
I made a tiny teaching tool to help me interactively demo + share differences between 📊 and 🥧
Play: I find that tinkering with data + visuals in class reinforces understanding far more than slides or readings
Save + share: Copy the url to link the current data
👉 barvpie.netlify.app
Reposted by Lucas Stich

My PhD syllabus for Introduction to Quantitative Marketing @rotmanschool. Updated for 2025. Comments welcome.
Feel free to suggest additional papers. Self promotion encouraged! All University of Toronto PhD students welcome to audit. Please get in touch.
Feel free to suggest additional papers. Self promotion encouraged! All University of Toronto PhD students welcome to audit. Please get in touch.
avigoldfarb.com
December 15, 2024 at 2:22 PM
My PhD syllabus for Introduction to Quantitative Marketing @rotmanschool. Updated for 2025. Comments welcome.
Feel free to suggest additional papers. Self promotion encouraged! All University of Toronto PhD students welcome to audit. Please get in touch.
Feel free to suggest additional papers. Self promotion encouraged! All University of Toronto PhD students welcome to audit. Please get in touch.
Reposted by Lucas Stich

In 24,678 people in 176 rural Honduras villages, we found that villagers have an average of 6.89 (SD 3.79) friends, and these friends have 8.40 (SD 2.52) friends.
Villagers have an average of 1.26 (SD 1.70) enemies, and these enemies have 3.40 (SD 2.11) enemies.
www.nature.com/articles/s41... 7/
Villagers have an average of 1.26 (SD 1.70) enemies, and these enemies have 3.40 (SD 2.11) enemies.
www.nature.com/articles/s41... 7/
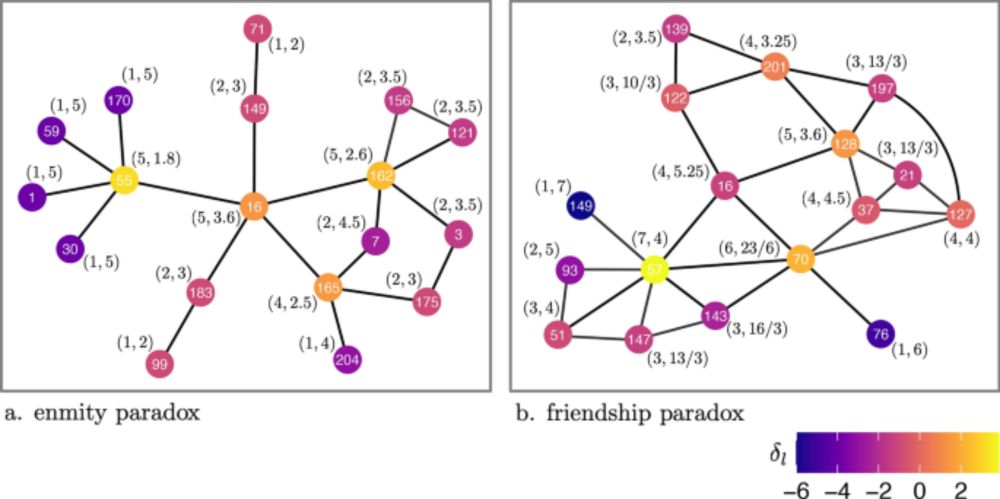
The enmity paradox - Scientific Reports
Scientific Reports - The enmity paradox
www.nature.com
November 23, 2024 at 3:21 PM
In 24,678 people in 176 rural Honduras villages, we found that villagers have an average of 6.89 (SD 3.79) friends, and these friends have 8.40 (SD 2.52) friends.
Villagers have an average of 1.26 (SD 1.70) enemies, and these enemies have 3.40 (SD 2.11) enemies.
www.nature.com/articles/s41... 7/
Villagers have an average of 1.26 (SD 1.70) enemies, and these enemies have 3.40 (SD 2.11) enemies.
www.nature.com/articles/s41... 7/
Reposted by Lucas Stich

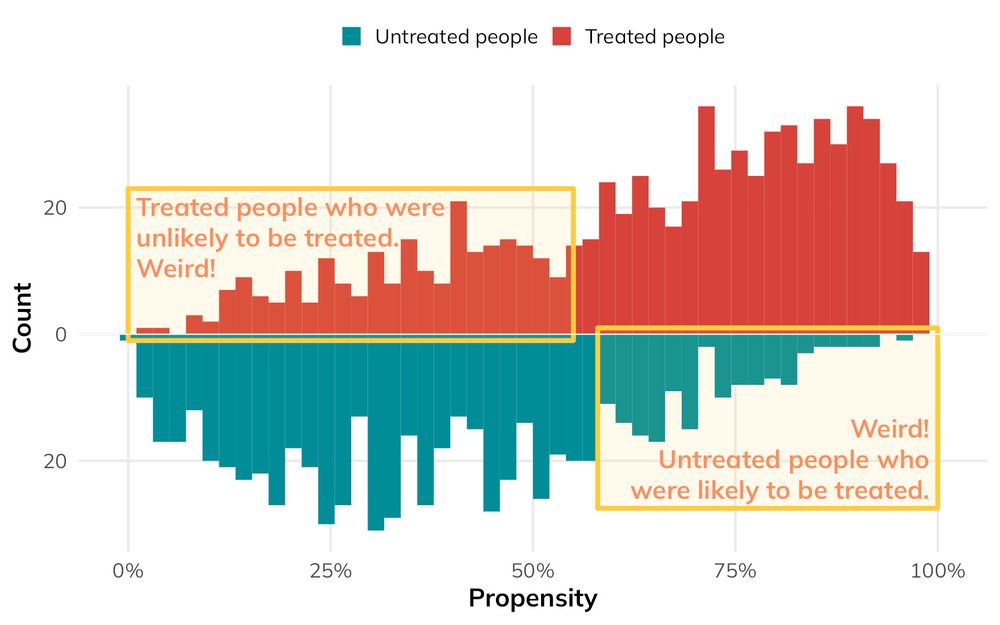
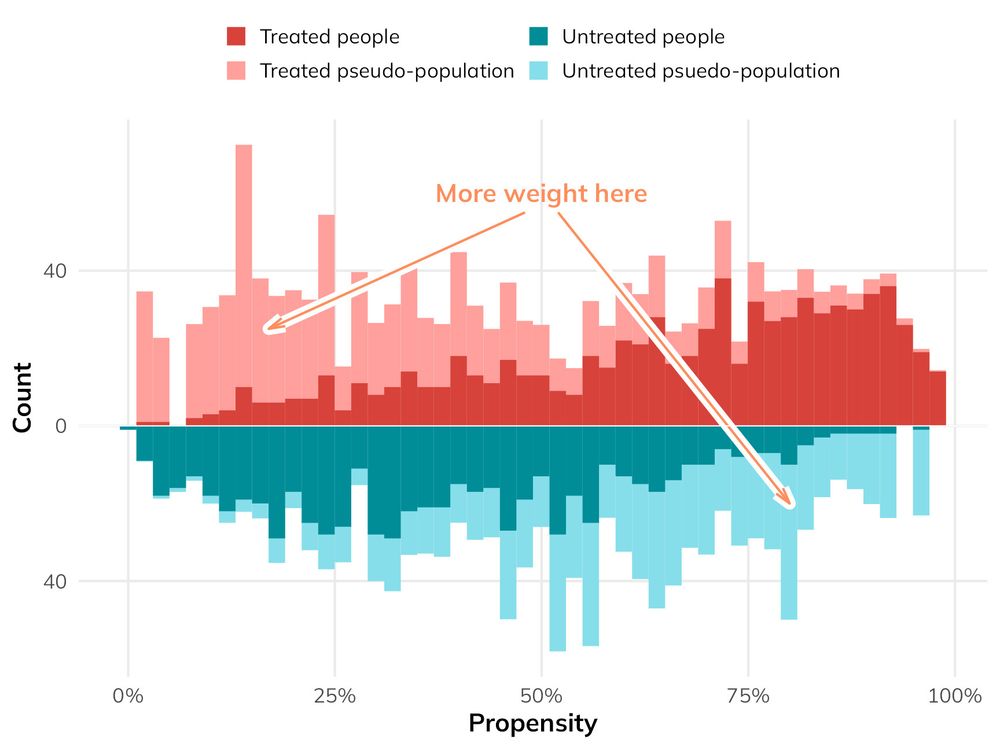
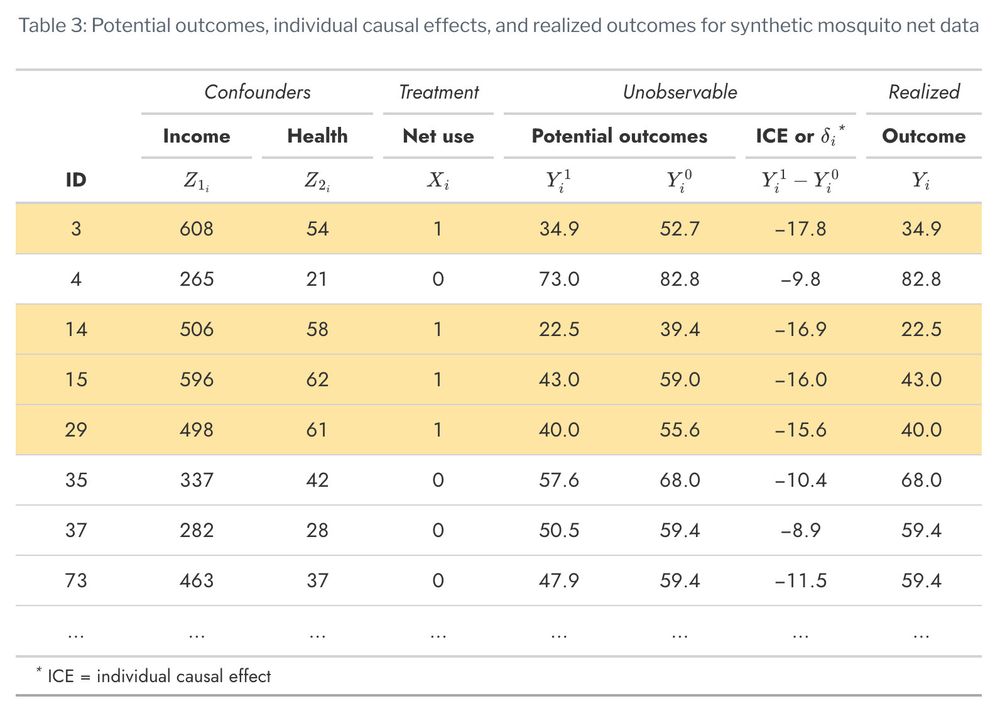
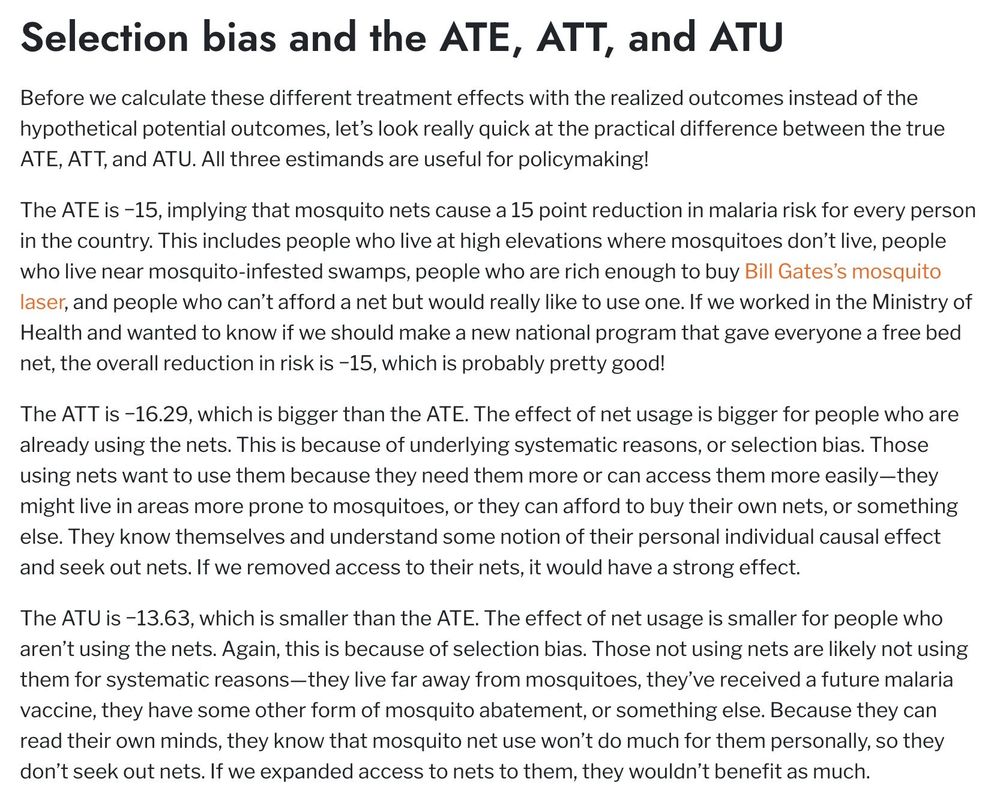
From the archives: Have you (like me!) wondered what the ATT means and how it's different from average treatment effects? I use #rstats to explore why we care about (and how to calculate) the ATE, ATT, and ATU #polisky #episky #econsky www.andrewheiss.com/blog/2024/03...
November 22, 2024 at 2:51 PM
From the archives: Have you (like me!) wondered what the ATT means and how it's different from average treatment effects? I use #rstats to explore why we care about (and how to calculate) the ATE, ATT, and ATU #polisky #episky #econsky www.andrewheiss.com/blog/2024/03...
Reposted by Lucas Stich

Foursquare just open sourced their 100 million place point of interest dataset! Some notes on poking around with it using DuckDB (it's Parquet files on S3) simonwillison.net/2024/Nov/20/...
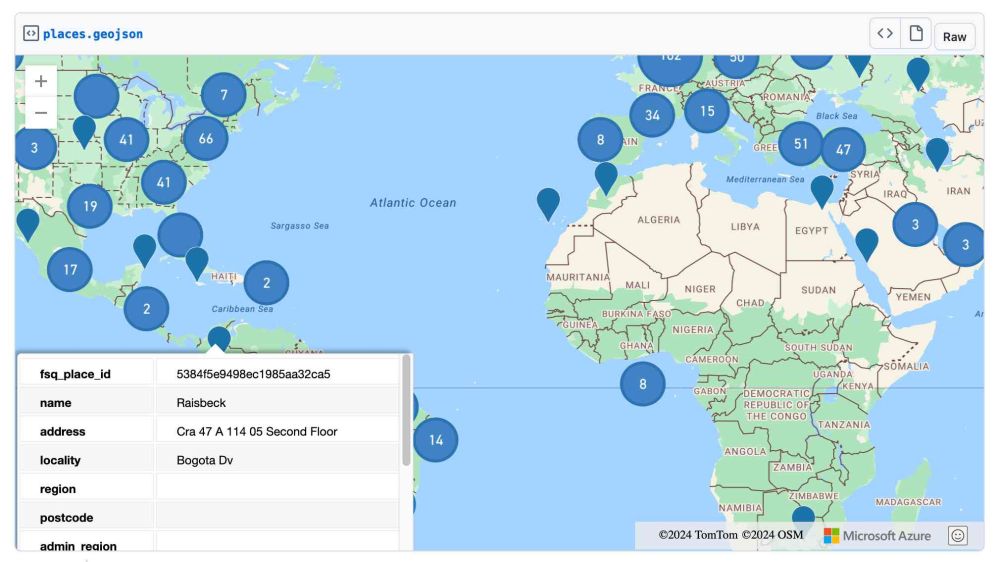
Foursquare Open Source Places: A new foundational dataset for the geospatial community
I did not expect this! > [...] we are announcing today the general availability of a foundational open data set, Foursquare Open Source Places ("FSQ OS Places"). This base layer …
simonwillison.net
November 20, 2024 at 6:08 AM
Foursquare just open sourced their 100 million place point of interest dataset! Some notes on poking around with it using DuckDB (it's Parquet files on S3) simonwillison.net/2024/Nov/20/...
Reposted by Lucas Stich

A few things I've been working on lately:
elmer, elmer.tidyverse.org, is a new package to make it easier to work with LLMs (hosted and local) from #rstats. It includes helps for structured data extraction and tool calling, and an easy way to upload a plot. Joint work with Joe Cheng.
elmer, elmer.tidyverse.org, is a new package to make it easier to work with LLMs (hosted and local) from #rstats. It includes helps for structured data extraction and tool calling, and an easy way to upload a plot. Joint work with Joe Cheng.
October 29, 2024 at 10:13 PM
A few things I've been working on lately:
elmer, elmer.tidyverse.org, is a new package to make it easier to work with LLMs (hosted and local) from #rstats. It includes helps for structured data extraction and tool calling, and an easy way to upload a plot. Joint work with Joe Cheng.
elmer, elmer.tidyverse.org, is a new package to make it easier to work with LLMs (hosted and local) from #rstats. It includes helps for structured data extraction and tool calling, and an easy way to upload a plot. Joint work with Joe Cheng.