Josh Bleiberg
@joshbleiberg.bsky.social
2.1K followers 1.4K following 49 posts
Assistant Professor of Ed Policy and Quantitative Methods at the University of Pittsburgh. I study accountability, education politics, teacher labor markets, and Philly sports. www.JoshBleiberg.com
Posts Media Videos Starter Packs
Reposted by Josh Bleiberg
Thread in the am but if you want the main takeaway: The 2024 Digest of Education Statistics (under the current administration) includes just 27 tables by the (Congressionally mandated) deadline—far fewer than the nearly 270, on average, published in prior years

www.brookings.edu/articles/the...
The U.S. Department of Education is far behind on producing key statistics | Brookings
Federal education data releases have slowed dramatically, with major gaps in the 2024 Digest and Condition of Education report.
www.brookings.edu
Very cool paper! Looking forward to giving it a close read.
1/ A new working paper from me and my amazing collaborators, Alberto Ortega, Matthew Patrick Shaw, and Vandy undergrad extraordinaire Daniel Yoo:

"Politics of the professoriate: Longitudinal evidence from a state public university system's universe of faculty"

Link: github.com/MemeMedianMo...
What do you call the hurricane of emotions that occurs when you are enjoying Andor, super annoyed by the monopoly go ads, but also aren't willing to upgrade your Disney+ subscription?
Reposted by Josh Bleiberg
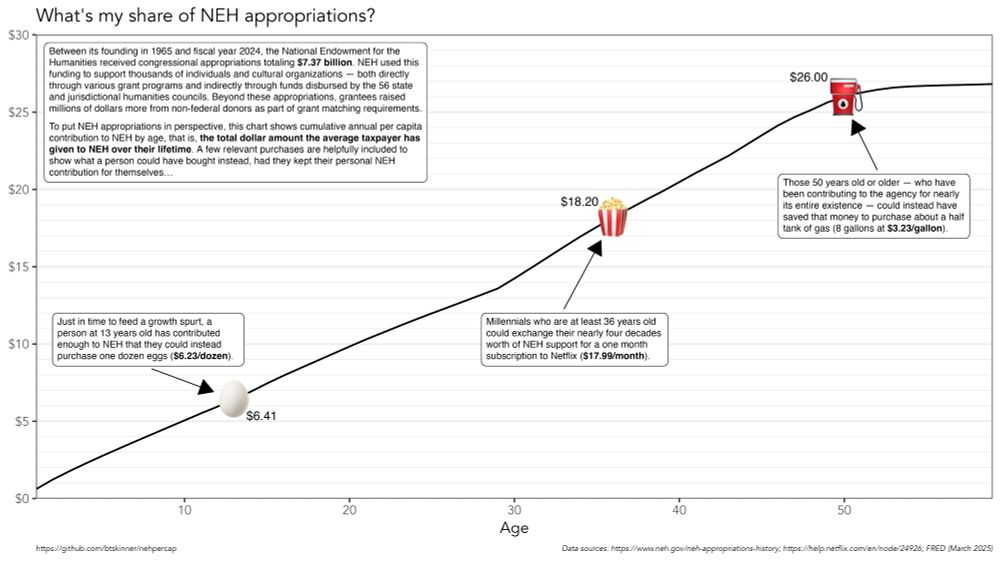
Here's one of my best friends (who, before being illegally fired, was the data scientist at NEH) showing just how much money NEH could distribute back out to US taxpayers based on their lifetime contributions. Get ready to make it rain with thousands of pennies y'all!
ben @btskinner.io · Apr 29
As an elder millennial, I could trade my lifetime of tax contributions to the NEH for one month of Netflix and have just enough left over to get some avocado toast if I split it with two other people
Line graph titled "What's my share of NEH appropriations" with a caption: "Between its founding in 1965 and fiscal year 2024, the National Endowment for the Humanities received congressional appropriations totaling $7.37 billion. NEH used this funding to support thousands of individuals and cultural organizations - both directly through various grant programs and indirectly through funds disbursed by the 56 state and jurisdictional humanities councils. Beyond these appropriations, grantees raised millions of dollars more from non-federal donors as part of grant matching requirements. To put NEH appropriations in perspective, this chart shows cumulative annual per capita contribution to NEH by age, that is, the total dollar amount the average taxpayer has given to NEH over their lifetime. A few relevant purchases are helpfully included to show what a person could have bought instead, had they kept their personal NEH contribution for themselves..." The x-axis ranges from 0 to 59 years old. The y-axis ranges from $0 to $30. At three ages, items that could have instead been purchased with an individual's lifetime NEH contribution are shown. At 13 years, an egg is plotted on the line with a dollar amount of $6.41 and the caption reads, "Just in time to feed a growth spurt, a person at 13 years old has contributed enough to NEH that they could instead purchase one dozen eggs ($6.23/dozen)." At 36 years, a popcorn bucket is plotted with a dollar amount of $18.20 and the caption reads, "Millennials who are at least 36 years old could exchange their nearly four decades worth of NEH support for a one month subscription to Netflix ($17.99/month)." At 50 years, a gasoline pump is plotted with the dollar amount of $26.00 and the caption reads, "Those 50 years old or older - who have been contributing to the agency for nearly its entire existence - could instead have saved that money to purchase about a half tank of gas (8 gallons at $3.23/gallon)."
Reposted by Josh Bleiberg
Just Education Policy is coming back! We’re excited to announce that we are planning for an *in-person* Just Education Policy Institute this Fall 2025. Applications & more details will be released in early May. For more info. about the Just Education Policy Institute, visit justeducationpolicy.org.
Just Education Policy
justeducationpolicy.org
Congrats Matt! Beyond well-deserved!
Reposted by Josh Bleiberg
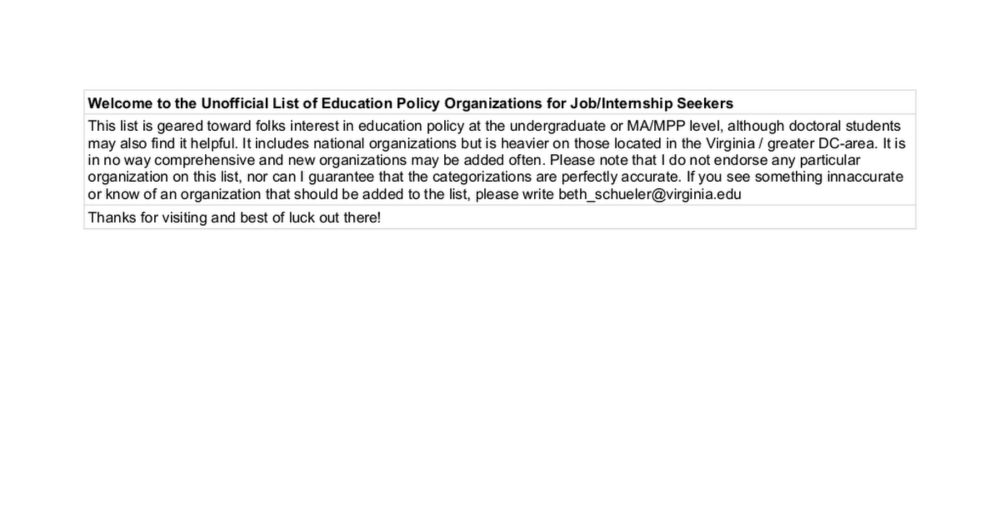
It's that time of year to circulate this list of orgs for those seeking ed policy jobs/internships. Please let me know if there are opportunities/orgs I should add. Good luck out there! docs.google.com/spreadsheets...
The Unofficial List of Ed Policy Orgs for Job/Internship Seekers
docs.google.com
We're hiring an Assistant Professor of Practice and Undergraduate Program Coordinator. I'm on the search committee and am more than happy to answer questions. cfopitt.taleo.net/careersectio...
COOPER DEJEAN IS NOT A SAFETY!!
It's an amazing dataset. Thanks for your work on it!
We hope this paper opens the door to other researchers who want to explore related research questions! Instructions for accessing the API are here (www.census.gov/data/develop...) and there’s a R package for accessing the API as well (tidyqwi). 7/7
Quarterly Workforce Indicators (QWI) (Time Series: 1990 - present)
The QWI are a set of 32 economic indicators including employment, job creation/destruction, wages, hires, and other measures of employment flows.
www.census.gov
We also explore labor market trends by educator characteristics (e.g., race, ethnicity, educational attainment) and show that the education labor market is weaker for educators who are non-White and did not graduate college. Finally, we briefly explore variation in pandemic local labor markets. 6/7
Of course, education labor market measures typically compare a specific school year to the prior school year. We show that our procedure using QWI data produces labor market measures of turnover and net-negative job loss that are strongly correlated with state data (R>0.73). 5/7
BTW please send me related papers so that I can cite them. QWI measures are created using changes in quarter-to-quarter counts. For example, job leavers are the number of employees who worked at a specific school district in 2024 Q1 and then did not in 2024 Q2. 4/7
Our objectives with this paper are to (1) hype up the QWI dataset to everyone studying teacher/education labor markets and (2) to develop school year level measures that we create using the quarter level QWI data. There are shockingly few examples of K12 labor market research that uses the QWI. 3/7
In my view the QWI is a highly under used tool created by Census Bureau using worker level unemployment insurance data. I suspect this is because the most useful data is available only through the API and the QWI’s website obscures the depth/breadth of the publicly available data. 2/7
I hope we can agree that everyone is a winner when Dan Snyder is upset.
I actually used the complementary access provided to me by a publisher in exchange for reviewing to find an article that was not accessible through my university. Achievement unlocked?