


James Sinclair
@jamesinclair.bsky.social
Floorplan guys: single stair apartments will allow for the removal of corridors resulting in cross ventilation
Developers: let's build a detached home with one (1) window
Developers: let's build a detached home with one (1) window

December 3, 2025 at 12:50 AM
Floorplan guys: single stair apartments will allow for the removal of corridors resulting in cross ventilation
Developers: let's build a detached home with one (1) window
Developers: let's build a detached home with one (1) window
Reposted by James Sinclair

It's too damn expensive to ride a Citi Bike. buff.ly/cZCvWJq


November 29, 2025 at 7:48 PM
It's too damn expensive to ride a Citi Bike. buff.ly/cZCvWJq
Finally found one in the wild

November 28, 2025 at 10:56 PM
Finally found one in the wild
Standing in line at 4am for black friday was less painful than getting 7 "is this you?" 6 digit codes from websites
November 28, 2025 at 6:20 PM
Standing in line at 4am for black friday was less painful than getting 7 "is this you?" 6 digit codes from websites
If the economy was good, this would be in every kitchen in America

November 27, 2025 at 12:27 AM
If the economy was good, this would be in every kitchen in America
Trump to charge foreigners $100 per person plus entrance fees to visit national parks.
This is going to decimate the economy of a lot of small towns
www.ctvnews.ca/world/articl...
This is going to decimate the economy of a lot of small towns
www.ctvnews.ca/world/articl...
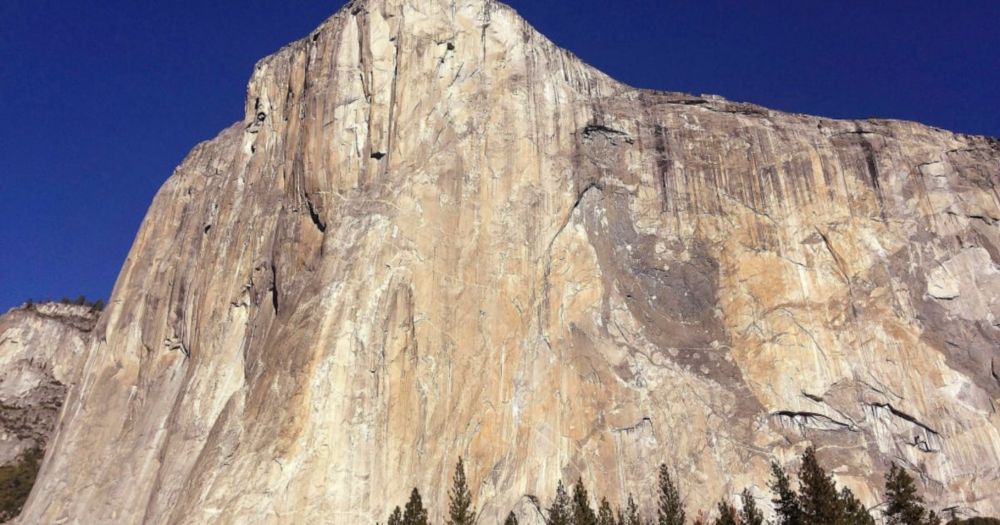
U.S. to slap big surcharge on foreign visitors to national parks
Foreign tourists visiting U.S. national parks including the Grand Canyon and Yellowstone will now pay a hefty surcharge, the Trump administration announced Tuesday.
www.ctvnews.ca
November 26, 2025 at 1:04 AM
Trump to charge foreigners $100 per person plus entrance fees to visit national parks.
This is going to decimate the economy of a lot of small towns
www.ctvnews.ca/world/articl...
This is going to decimate the economy of a lot of small towns
www.ctvnews.ca/world/articl...
Is there a better value proposition, in terms of calories per dollar?

November 26, 2025 at 12:27 AM
Is there a better value proposition, in terms of calories per dollar?
If you own a desktop tower, you might be sitting on a sizeable nest egg. RAM prices up 400% this year

November 25, 2025 at 9:32 PM
If you own a desktop tower, you might be sitting on a sizeable nest egg. RAM prices up 400% this year
Sorry guys I tried but the schedule and station location didn't make sense

November 25, 2025 at 3:58 PM
Sorry guys I tried but the schedule and station location didn't make sense
The train stations around Dallas make no sense. There's huge gaps between stations and the environment isn't exactly walk friendly. So if the train doesn't exactly match your origin and destination it's useless
November 25, 2025 at 2:47 AM
The train stations around Dallas make no sense. There's huge gaps between stations and the environment isn't exactly walk friendly. So if the train doesn't exactly match your origin and destination it's useless
Yes we're delayed by 90 minutes but at least we will be entertained

November 24, 2025 at 9:20 PM
Yes we're delayed by 90 minutes but at least we will be entertained
Reposted by James Sinclair

PATH's proposed 'significant' service increase is actually just a restoration and reshuffling of the service levels they were operating pre-pandemic.
Even playing out all of the proposed service boosts through 2027, PATH will still be operating 2.6% less service hours than they were in 2019.
Even playing out all of the proposed service boosts through 2027, PATH will still be operating 2.6% less service hours than they were in 2019.

November 24, 2025 at 1:08 AM
PATH's proposed 'significant' service increase is actually just a restoration and reshuffling of the service levels they were operating pre-pandemic.
Even playing out all of the proposed service boosts through 2027, PATH will still be operating 2.6% less service hours than they were in 2019.
Even playing out all of the proposed service boosts through 2027, PATH will still be operating 2.6% less service hours than they were in 2019.
"waymo will mean the end of flights under 3 hours"
Yeah man that's why these things are a billion dollar business
Yeah man that's why these things are a billion dollar business

November 23, 2025 at 5:52 PM
"waymo will mean the end of flights under 3 hours"
Yeah man that's why these things are a billion dollar business
Yeah man that's why these things are a billion dollar business
Lots of chatter this weekend about Waymos expanded service area but I haven't seen one person mention price.
Do people really think a 7 hour private car will be affordable?
Do people really think a 7 hour private car will be affordable?
November 22, 2025 at 9:02 PM
Lots of chatter this weekend about Waymos expanded service area but I haven't seen one person mention price.
Do people really think a 7 hour private car will be affordable?
Do people really think a 7 hour private car will be affordable?
Why do chains like target and Walgreens continue to open brand new stores, with the same layout and design as they did 20 years ago, and immediately lock half the store up?
They really can't think of a better plan?
No one I know goes to either anymore
They really can't think of a better plan?
No one I know goes to either anymore
November 19, 2025 at 11:21 PM
Why do chains like target and Walgreens continue to open brand new stores, with the same layout and design as they did 20 years ago, and immediately lock half the store up?
They really can't think of a better plan?
No one I know goes to either anymore
They really can't think of a better plan?
No one I know goes to either anymore
Reposted by James Sinclair
"In my opinion, I don’t see it as stealing from the riders. To me, the railroad is the biggest crook." -- www.newsday.com/long-island/...

Inside the LIRR 'culture of fraud'
An MTA inspector general investigation lays out how Long Island Rail Road workers allegedly gamed the system in a variety of creative ways.
www.newsday.com
November 19, 2025 at 2:06 AM
"In my opinion, I don’t see it as stealing from the riders. To me, the railroad is the biggest crook." -- www.newsday.com/long-island/...
Another company is about to learn how hard it is to get back the customers you've already lost
www.wsj.com/business/pan...
www.wsj.com/business/pan...

Exclusive | Panera Plans to Spend Millions on Better Sandwiches and Nicer Stores
A turnaround strategy for the sandwich-and-salad chain includes improving service and food. “No one likes iceberg,” said Paul Carbone, CEO of Panera Brands.
www.wsj.com
November 18, 2025 at 4:57 PM
Another company is about to learn how hard it is to get back the customers you've already lost
www.wsj.com/business/pan...
www.wsj.com/business/pan...
What goes on here

November 18, 2025 at 4:24 AM
What goes on here
Growing up in Latin America...
This was the problem 20+ years ago. Residential compounds. Bulletproof cars. Bribes ensuring they never stand in line.
Sad to see the US just following along.
www.wsj.com/lifestyle/tr...
This was the problem 20+ years ago. Residential compounds. Bulletproof cars. Bribes ensuring they never stand in line.
Sad to see the US just following along.
www.wsj.com/lifestyle/tr...

The Ultrarich Are Spending a Fortune to Live in Extreme Privacy
In Miami and elsewhere, the wealthy are moving in increasingly private spheres, shelling out big money to bypass the indignities of public life.
www.wsj.com
November 17, 2025 at 8:20 PM
Growing up in Latin America...
This was the problem 20+ years ago. Residential compounds. Bulletproof cars. Bribes ensuring they never stand in line.
Sad to see the US just following along.
www.wsj.com/lifestyle/tr...
This was the problem 20+ years ago. Residential compounds. Bulletproof cars. Bribes ensuring they never stand in line.
Sad to see the US just following along.
www.wsj.com/lifestyle/tr...
Reposted by James Sinclair

Lots of folks captioning aurora photos like "for a few minutes we didn't think about politics"
guess I'm built different, every time I'm out trying to see night sky stuff I frequently think about how much light pollution is entirely preventable with just a tiny bit of regulation
guess I'm built different, every time I'm out trying to see night sky stuff I frequently think about how much light pollution is entirely preventable with just a tiny bit of regulation

November 13, 2025 at 10:03 PM
Lots of folks captioning aurora photos like "for a few minutes we didn't think about politics"
guess I'm built different, every time I'm out trying to see night sky stuff I frequently think about how much light pollution is entirely preventable with just a tiny bit of regulation
guess I'm built different, every time I'm out trying to see night sky stuff I frequently think about how much light pollution is entirely preventable with just a tiny bit of regulation
Reposted by James Sinclair

Here's the actual PATH improvement phase in timing

November 13, 2025 at 9:09 PM
Here's the actual PATH improvement phase in timing
Reposted by James Sinclair

Meanwhile, on X

November 13, 2025 at 1:13 PM
Meanwhile, on X
Please sit down before looking at this screenshot.
Better things might be possible!
@2avesag.as @thelirrtoday.com @airlineflyer.net @mdasilva.bsky.social
Better things might be possible!
@2avesag.as @thelirrtoday.com @airlineflyer.net @mdasilva.bsky.social

November 13, 2025 at 6:07 PM
Please sit down before looking at this screenshot.
Better things might be possible!
@2avesag.as @thelirrtoday.com @airlineflyer.net @mdasilva.bsky.social
Better things might be possible!
@2avesag.as @thelirrtoday.com @airlineflyer.net @mdasilva.bsky.social
Trump take common cents
November 13, 2025 at 3:15 AM
Trump take common cents