Andy Bunn
@fakeandybunn.bsky.social
130 followers
86 following
39 posts
Dendrochronologist and data enthusiast. dplR, dplPy, xDater, openDendro
Posts
Media
Videos
Starter Packs


Andy Bunn
@fakeandybunn.bsky.social
· May 12

Andy Bunn
@fakeandybunn.bsky.social
· Apr 2
Andy Bunn
@fakeandybunn.bsky.social
· Apr 2
Andy Bunn
@fakeandybunn.bsky.social
· Apr 2
Andy Bunn
@fakeandybunn.bsky.social
· Apr 2
Andy Bunn
@fakeandybunn.bsky.social
· Apr 2
Andy Bunn
@fakeandybunn.bsky.social
· Apr 2
Andy Bunn
@fakeandybunn.bsky.social
· Apr 2
Andy Bunn
@fakeandybunn.bsky.social
· Apr 2
Andy Bunn
@fakeandybunn.bsky.social
· Apr 2
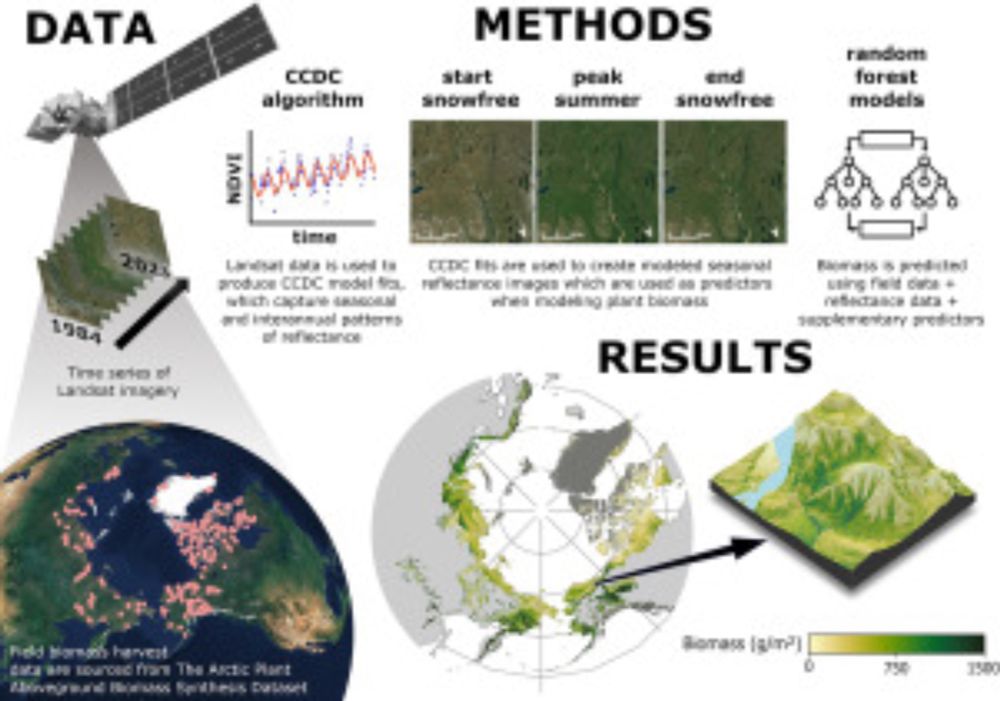
Next generation Arctic vegetation maps: Aboveground plant biomass and woody dominance mapped at 30 m resolution across the tundra biome
The Arctic is warming faster than anywhere else on Earth, placing tundra ecosystems at the forefront of global climate change. Plant biomass is a fund…
www.sciencedirect.com

Andy Bunn
@fakeandybunn.bsky.social
· Mar 5

Low-frequency patterns in Late-Holocene tree-ring records from northern Fennoscandia - Samuli Helama, 2025
Northern Fennoscandia is a cradle of tree-ring based climate reconstructions. These Late-Holocene data come from several types of tree-ring proxies and are typi...
journals.sagepub.com
Andy Bunn
@fakeandybunn.bsky.social
· Feb 13