


AstroArxiv
@astroarxiv.bsky.social
String Decomposition and Gravitational Waves in High-quality Axion Gauge Theories. Camilla Mupo et. al. https://arxiv.org/abs/2510.23738


November 27, 2025 at 4:30 AM
String Decomposition and Gravitational Waves in High-quality Axion Gauge Theories. Camilla Mupo et. al. https://arxiv.org/abs/2510.23738
Symmetry principles of gravitational perturbations in thermal environments. Atsuhisa Ota https://arxiv.org/abs/2510.22346


November 27, 2025 at 4:30 AM
Symmetry principles of gravitational perturbations in thermal environments. Atsuhisa Ota https://arxiv.org/abs/2510.22346
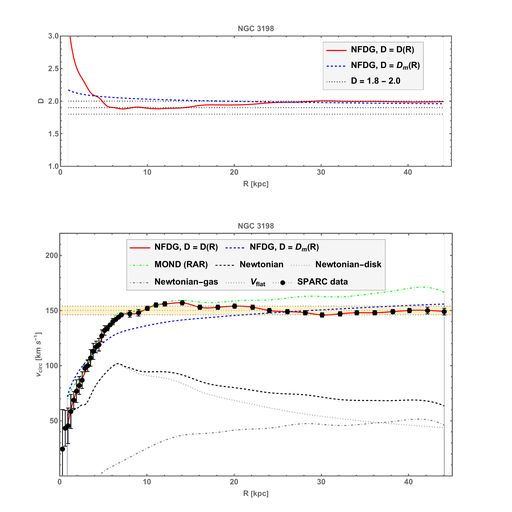
Newtonian Fractional-Dimension Gravity and the Mass-Dimension Field Equation. Gabriele U. Varieschi https://arxiv.org/abs/2507.20012


November 27, 2025 at 4:30 AM
Newtonian Fractional-Dimension Gravity and the Mass-Dimension Field Equation. Gabriele U. Varieschi https://arxiv.org/abs/2507.20012
Insights in $f(Q)$ cosmology: the relevance of the connection. Ismael Ayuso et. al. https://arxiv.org/abs/2506.03506


November 27, 2025 at 4:29 AM
Insights in $f(Q)$ cosmology: the relevance of the connection. Ismael Ayuso et. al. https://arxiv.org/abs/2506.03506
Thermal Evolution of Magnetars under f(R, T) Gravity. Charul Rathod et. al. https://arxiv.org/abs/2412.04520


November 27, 2025 at 4:28 AM
Thermal Evolution of Magnetars under f(R, T) Gravity. Charul Rathod et. al. https://arxiv.org/abs/2412.04520
The first AKRA mass map reconstruction from HSC Y1 data. Yuan Shi et. al. https://arxiv.org/abs/2511.12488


November 27, 2025 at 4:27 AM
The first AKRA mass map reconstruction from HSC Y1 data. Yuan Shi et. al. https://arxiv.org/abs/2511.12488
The Spatial Evolution of Star Clusters in NGC 628 with JWST. Anne S. M. Buckner et. al. https://arxiv.org/abs/2511.11115
November 27, 2025 at 4:27 AM
The Spatial Evolution of Star Clusters in NGC 628 with JWST. Anne S. M. Buckner et. al. https://arxiv.org/abs/2511.11115
Constraint on the Physical Origin of Gamma-Ray Burst Prompt Emission via Its Nondetected Diffuse Neutrino Emission. Yang-Dong-Jun Ou et. al. https://arxiv.org/abs/2510.22914


November 27, 2025 at 4:26 AM
Constraint on the Physical Origin of Gamma-Ray Burst Prompt Emission via Its Nondetected Diffuse Neutrino Emission. Yang-Dong-Jun Ou et. al. https://arxiv.org/abs/2510.22914
Reconstructing the local density field with combined convolutional and point cloud architecture. Baptiste Barthe-Gold et. al. https://arxiv.org/abs/2510.08573


November 27, 2025 at 4:25 AM
Reconstructing the local density field with combined convolutional and point cloud architecture. Baptiste Barthe-Gold et. al. https://arxiv.org/abs/2510.08573
Eclipse Mapping with Ariel: Future Prospects for a Population-Level Mapping Survey. Daniel Valentine et. al. https://arxiv.org/abs/2510.03147


November 27, 2025 at 4:24 AM
Eclipse Mapping with Ariel: Future Prospects for a Population-Level Mapping Survey. Daniel Valentine et. al. https://arxiv.org/abs/2510.03147
The velocity field of the Scorpius-Centaurus OB association. S. Hutschenreuter (1) et. al. https://arxiv.org/abs/2509.13607


November 27, 2025 at 4:24 AM
The velocity field of the Scorpius-Centaurus OB association. S. Hutschenreuter (1) et. al. https://arxiv.org/abs/2509.13607
Bar Evolution in Edge-on Galaxies: A Demographic Study of Boxy/Peanut Bulges. Atul A. Samanta et. al. https://arxiv.org/abs/2509.13278


November 27, 2025 at 4:23 AM
Bar Evolution in Edge-on Galaxies: A Demographic Study of Boxy/Peanut Bulges. Atul A. Samanta et. al. https://arxiv.org/abs/2509.13278
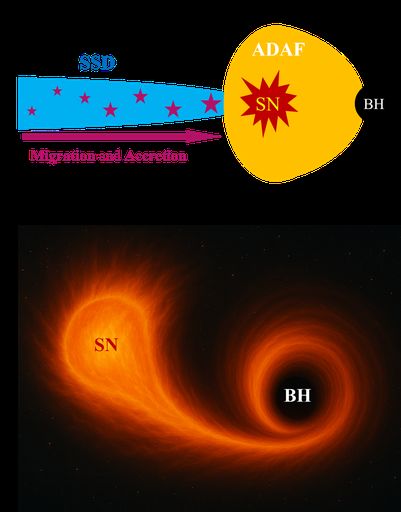
Simulations of Tidal Disruption of Supernova in Galaxy Nuclear Region: A Novel Model for Ambiguous Nuclear Transients. Xiangli Lei et. al. https://arxiv.org/abs/2509.11186


November 27, 2025 at 4:22 AM
Simulations of Tidal Disruption of Supernova in Galaxy Nuclear Region: A Novel Model for Ambiguous Nuclear Transients. Xiangli Lei et. al. https://arxiv.org/abs/2509.11186
Deciphering galaxy images using machine vision -- Combining variational autoencoder and principal component analysis for feature extraction. Samuel Howie et. al. https://arxiv.org/abs/2509.03640


November 27, 2025 at 4:22 AM
Deciphering galaxy images using machine vision -- Combining variational autoencoder and principal component analysis for feature extraction. Samuel Howie et. al. https://arxiv.org/abs/2509.03640
Enriched volatiles and refractories but deficient titanium on the dayside atmosphere of WASP-121b revealed by JWST/NIRISS. Stefan Pelletier et. al. https://arxiv.org/abs/2508.18341


November 27, 2025 at 4:20 AM
Enriched volatiles and refractories but deficient titanium on the dayside atmosphere of WASP-121b revealed by JWST/NIRISS. Stefan Pelletier et. al. https://arxiv.org/abs/2508.18341
The Prime Focus Infrared Microlensing Experiment (PRIME): First Results. Takahiro Sumi et. al. https://arxiv.org/abs/2508.14474


November 27, 2025 at 4:20 AM
The Prime Focus Infrared Microlensing Experiment (PRIME): First Results. Takahiro Sumi et. al. https://arxiv.org/abs/2508.14474
Segmenting proto-halos with vision transformers. Toka Alokda et. al. https://arxiv.org/abs/2508.00049


November 27, 2025 at 4:19 AM
Segmenting proto-halos with vision transformers. Toka Alokda et. al. https://arxiv.org/abs/2508.00049
Gamma rays as leptonic portals to energetic neutrinos: a new Monte Carlo approach. Gaetano Di Marco et. al. https://arxiv.org/abs/2507.21867


November 27, 2025 at 4:18 AM
Gamma rays as leptonic portals to energetic neutrinos: a new Monte Carlo approach. Gaetano Di Marco et. al. https://arxiv.org/abs/2507.21867
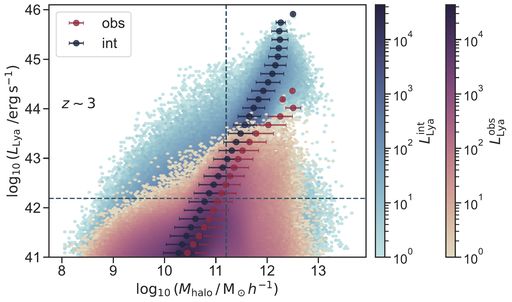
Simulating realistic Lyman-$α$ emitting galaxies including the effect of radiative transfer. Hasti Khoraminezhad et. al. https://arxiv.org/abs/2507.16707


November 27, 2025 at 4:17 AM
Simulating realistic Lyman-$α$ emitting galaxies including the effect of radiative transfer. Hasti Khoraminezhad et. al. https://arxiv.org/abs/2507.16707
Testing the cosmic distance duality relation with baryon acoustic oscillations and supernovae data. Tian-Nuo Li et. al. https://arxiv.org/abs/2507.13811


November 27, 2025 at 4:16 AM
Testing the cosmic distance duality relation with baryon acoustic oscillations and supernovae data. Tian-Nuo Li et. al. https://arxiv.org/abs/2507.13811
Spectral synthesis of 3D unified model atmospheres with winds for O stars. L. Delbroek et. al. https://arxiv.org/abs/2507.12057


November 27, 2025 at 4:16 AM
Spectral synthesis of 3D unified model atmospheres with winds for O stars. L. Delbroek et. al. https://arxiv.org/abs/2507.12057
Effects of Lorentz invariance violation on charged particles and photon production in astrophysical sources. Matheus Duarte et. al. https://arxiv.org/abs/2507.06766


November 27, 2025 at 4:15 AM
Effects of Lorentz invariance violation on charged particles and photon production in astrophysical sources. Matheus Duarte et. al. https://arxiv.org/abs/2507.06766
Introducing NewCluster: the first half of the history of a high-resolution cluster simulation. San Han et. al. https://arxiv.org/abs/2507.06301


November 27, 2025 at 4:15 AM
Introducing NewCluster: the first half of the history of a high-resolution cluster simulation. San Han et. al. https://arxiv.org/abs/2507.06301
The Impact of $Ω_{m0}$ Prior Bias on Cosmological Parameter Estimation: Reconciling DESI DR2 BAO and Pantheon+ SNe Data Combination Results. Seokcheon Lee https://arxiv.org/abs/2506.16022


November 27, 2025 at 4:13 AM
The Impact of $Ω_{m0}$ Prior Bias on Cosmological Parameter Estimation: Reconciling DESI DR2 BAO and Pantheon+ SNe Data Combination Results. Seokcheon Lee https://arxiv.org/abs/2506.16022
Dust Budget Crisis in Little Red Dots. Kejian Chen et. al. https://arxiv.org/abs/2505.22600


November 27, 2025 at 4:13 AM
Dust Budget Crisis in Little Red Dots. Kejian Chen et. al. https://arxiv.org/abs/2505.22600