


Arshi Saleh
@arshisaleh.bsky.social
Tableau Ambassador | Data Visual Designer | 2x #VOTDs | #DataFamRisingStars 2025
#dataviz #datavisualization #tableau #datafam
#dataviz #datavisualization #tableau #datafam
My #dataviz, "APT :Voices For Human Dignity" has won the second place in the 2025 #DataViz Competition🎉 🥈
Thank you @DataConnect Conference, @womeninanalytics, @womenindata and @Apexon
for organizing the event.
#WomenInAnalytics #DataConnectConf #DataStorytelling #DCC2025
Thank you @DataConnect Conference, @womeninanalytics, @womenindata and @Apexon
for organizing the event.
#WomenInAnalytics #DataConnectConf #DataStorytelling #DCC2025


October 8, 2025 at 2:37 PM
My #dataviz, "APT :Voices For Human Dignity" has won the second place in the 2025 #DataViz Competition🎉 🥈
Thank you @DataConnect Conference, @womeninanalytics, @womenindata and @Apexon
for organizing the event.
#WomenInAnalytics #DataConnectConf #DataStorytelling #DCC2025
Thank you @DataConnect Conference, @womeninanalytics, @womenindata and @Apexon
for organizing the event.
#WomenInAnalytics #DataConnectConf #DataStorytelling #DCC2025
Hello #DataFam,
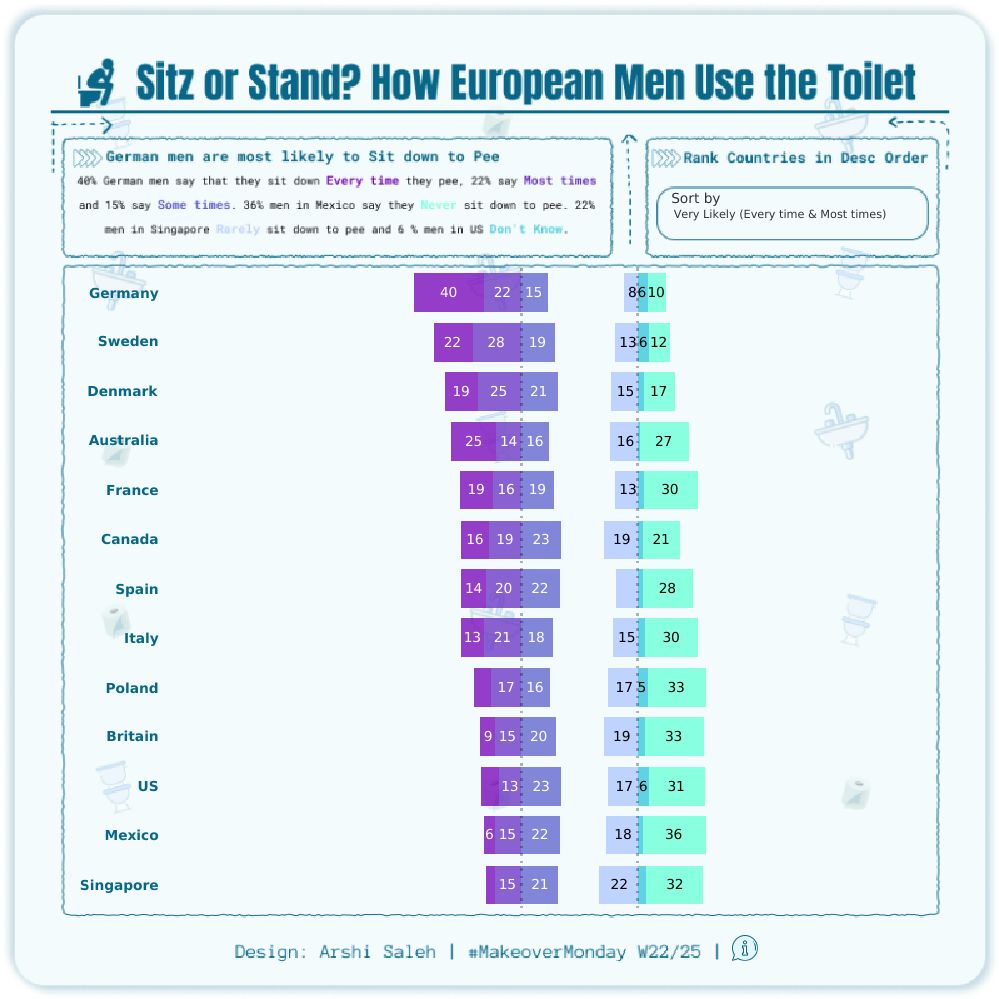
Sharing my submission for W22/25 #makeovermonday.
📊 Tableau Link: public.tableau.com/views/Sitzor...
Hope you enjoy the viz and feel free to share feedback! 😊
Thank you Chimdi Nwosu, Harry Beardon, and Irene Diomi for the challenge!
#tableau #dataviz #datavisualization
Sharing my submission for W22/25 #makeovermonday.
📊 Tableau Link: public.tableau.com/views/Sitzor...
Hope you enjoy the viz and feel free to share feedback! 😊
Thank you Chimdi Nwosu, Harry Beardon, and Irene Diomi for the challenge!
#tableau #dataviz #datavisualization
May 30, 2025 at 6:34 PM
Hello #DataFam,
Sharing my submission for W22/25 #makeovermonday.
📊 Tableau Link: public.tableau.com/views/Sitzor...
Hope you enjoy the viz and feel free to share feedback! 😊
Thank you Chimdi Nwosu, Harry Beardon, and Irene Diomi for the challenge!
#tableau #dataviz #datavisualization
Sharing my submission for W22/25 #makeovermonday.
📊 Tableau Link: public.tableau.com/views/Sitzor...
Hope you enjoy the viz and feel free to share feedback! 😊
Thank you Chimdi Nwosu, Harry Beardon, and Irene Diomi for the challenge!
#tableau #dataviz #datavisualization
Thank you for sharing Team Datafam!
To follow along the walkthrough for the use cases you can download the Tableau workbook.
Sharing the link: public.tableau.com/views/Dynami...
#tableau #dataviz #datafam
To follow along the walkthrough for the use cases you can download the Tableau workbook.
Sharing the link: public.tableau.com/views/Dynami...
#tableau #dataviz #datafam
Latest TUG is youtu.be/8jSaO2BFsL8
@arshisaleh.bsky.social -unique Dynamic Zone Visibility use cases beyond typical toggles & filters
Surya Kant Mani -the power of a design-first approach combined with effective templatization
LOTS of awesome content @ youtube.com/@TeamDataFam #DataFam
@arshisaleh.bsky.social -unique Dynamic Zone Visibility use cases beyond typical toggles & filters
Surya Kant Mani -the power of a design-first approach combined with effective templatization
LOTS of awesome content @ youtube.com/@TeamDataFam #DataFam

May 12, 2025 at 12:00 PM
Thank you for sharing Team Datafam!
To follow along the walkthrough for the use cases you can download the Tableau workbook.
Sharing the link: public.tableau.com/views/Dynami...
#tableau #dataviz #datafam
To follow along the walkthrough for the use cases you can download the Tableau workbook.
Sharing the link: public.tableau.com/views/Dynami...
#tableau #dataviz #datafam
Hello #datafam!
My viz "APT: Voices for Human Dignity" is one of the Top 10 Finalists for the Women In Analytics Dataviz Competition!
I now need your support to make it to Top 5. If you like my viz please vote for it.
Voting Link: www.dataconnectconf.com/data-viz-fin...
#dataviz
My viz "APT: Voices for Human Dignity" is one of the Top 10 Finalists for the Women In Analytics Dataviz Competition!
I now need your support to make it to Top 5. If you like my viz please vote for it.
Voting Link: www.dataconnectconf.com/data-viz-fin...
#dataviz
May 10, 2025 at 4:12 PM
Hello #datafam!
My viz "APT: Voices for Human Dignity" is one of the Top 10 Finalists for the Women In Analytics Dataviz Competition!
I now need your support to make it to Top 5. If you like my viz please vote for it.
Voting Link: www.dataconnectconf.com/data-viz-fin...
#dataviz
My viz "APT: Voices for Human Dignity" is one of the Top 10 Finalists for the Women In Analytics Dataviz Competition!
I now need your support to make it to Top 5. If you like my viz please vote for it.
Voting Link: www.dataconnectconf.com/data-viz-fin...
#dataviz
Hello #DataFam,
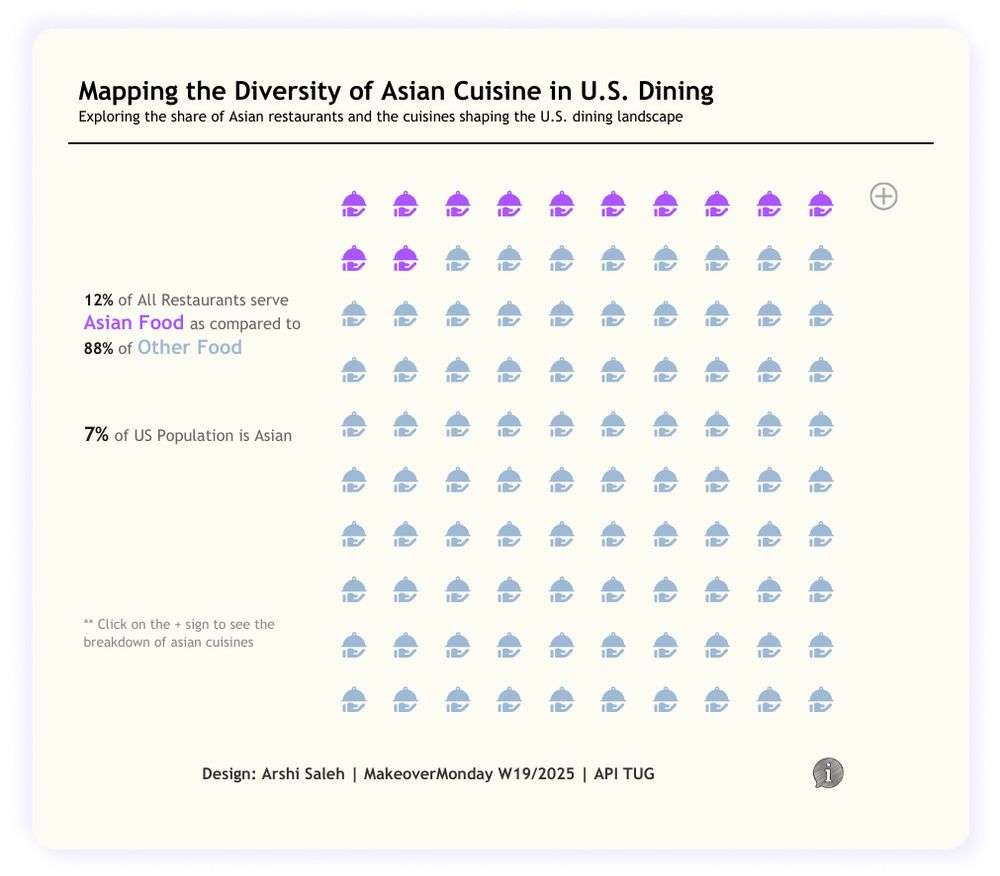
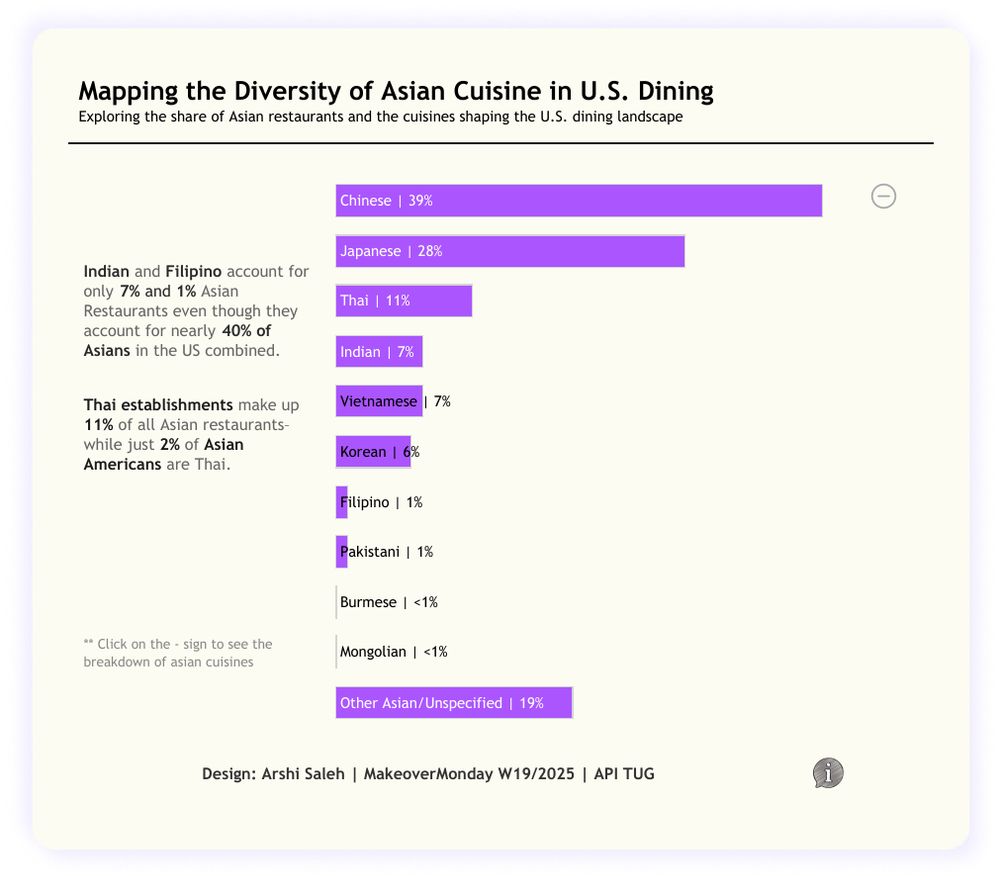
I am excited to share my submission for Week 19/2025 #MakeoverMonday in partnership with API TUG!
📊 Tableau Link: public.tableau.com/views/AsianR...
Hope you enjoy the viz and feel free to share feedback! 😊
Thank you #MakoverMonday team & the API TUG team!
#dataviz #data
I am excited to share my submission for Week 19/2025 #MakeoverMonday in partnership with API TUG!
📊 Tableau Link: public.tableau.com/views/AsianR...
Hope you enjoy the viz and feel free to share feedback! 😊
Thank you #MakoverMonday team & the API TUG team!
#dataviz #data
May 6, 2025 at 7:47 PM
Hello #DataFam,
I am excited to share my submission for Week 19/2025 #MakeoverMonday in partnership with API TUG!
📊 Tableau Link: public.tableau.com/views/AsianR...
Hope you enjoy the viz and feel free to share feedback! 😊
Thank you #MakoverMonday team & the API TUG team!
#dataviz #data
I am excited to share my submission for Week 19/2025 #MakeoverMonday in partnership with API TUG!
📊 Tableau Link: public.tableau.com/views/AsianR...
Hope you enjoy the viz and feel free to share feedback! 😊
Thank you #MakoverMonday team & the API TUG team!
#dataviz #data
Hey #DataFam!
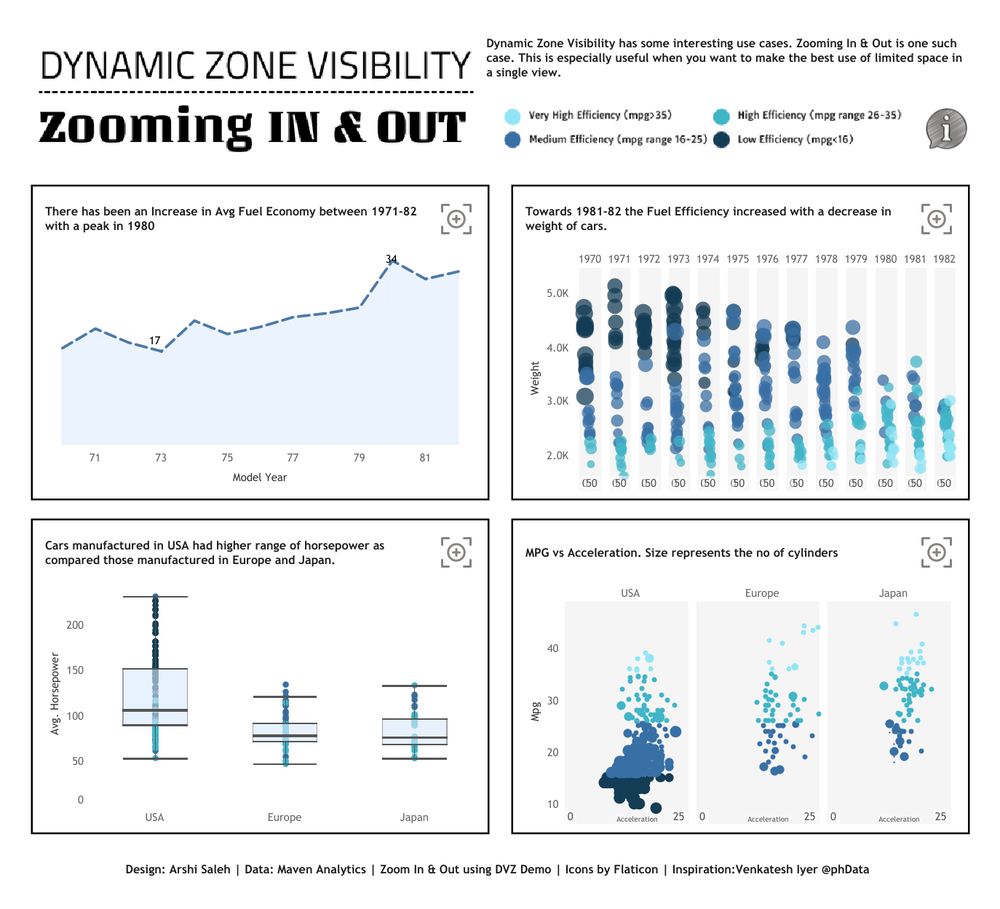
I am excited to share a hands-on demo I created for adding dynamic view to your dashboard using Zoom In & Out buttons. Download the dashboard to learn how.
🔗 Tableau Link: public.tableau.com/views/Dynami...
#tableau #dashboard #dashboarddesign #zoom #DynamicZoneVisibility
I am excited to share a hands-on demo I created for adding dynamic view to your dashboard using Zoom In & Out buttons. Download the dashboard to learn how.
🔗 Tableau Link: public.tableau.com/views/Dynami...
#tableau #dashboard #dashboarddesign #zoom #DynamicZoneVisibility
May 2, 2025 at 5:39 PM
Hey #DataFam!
I am excited to share a hands-on demo I created for adding dynamic view to your dashboard using Zoom In & Out buttons. Download the dashboard to learn how.
🔗 Tableau Link: public.tableau.com/views/Dynami...
#tableau #dashboard #dashboarddesign #zoom #DynamicZoneVisibility
I am excited to share a hands-on demo I created for adding dynamic view to your dashboard using Zoom In & Out buttons. Download the dashboard to learn how.
🔗 Tableau Link: public.tableau.com/views/Dynami...
#tableau #dashboard #dashboarddesign #zoom #DynamicZoneVisibility
Reposted by Arshi Saleh

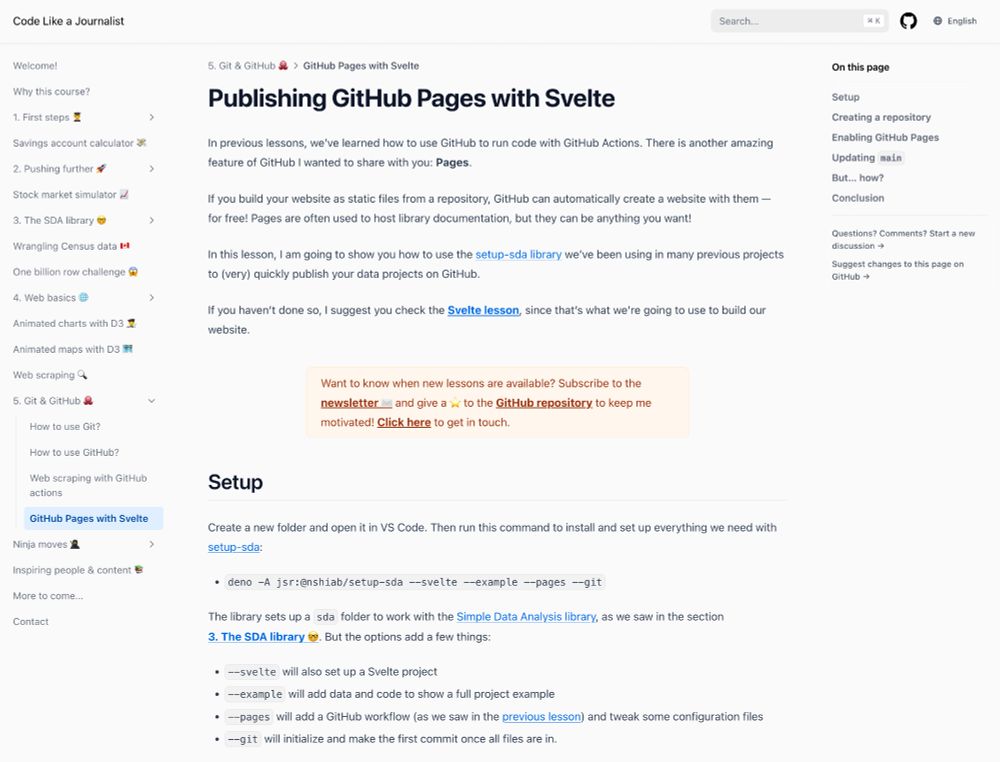
You cracked the data. You uncovered the findings. Now let’s publish your own website for free with GitHub Pages! 🌍📊
Trust me, it’s easier than you think.
Check out the new lesson on Code Like a Journalist 👇
Trust me, it’s easier than you think.
Check out the new lesson on Code Like a Journalist 👇
April 22, 2025 at 12:58 PM
You cracked the data. You uncovered the findings. Now let’s publish your own website for free with GitHub Pages! 🌍📊
Trust me, it’s easier than you think.
Check out the new lesson on Code Like a Journalist 👇
Trust me, it’s easier than you think.
Check out the new lesson on Code Like a Journalist 👇
Hello #DataFam,
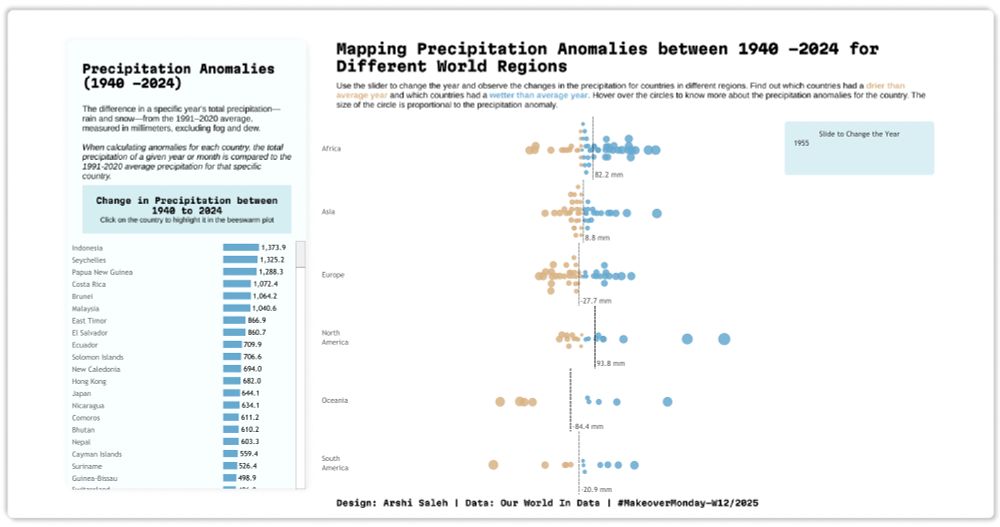
Sharing my submission for Week 12/2025 #MakeoverMonday!
Dive into this #viz to discover Precipitation Anomalies from year 1940 -2024
📊 Tableau Link: public.tableau.com/views/AWorld...
Feel free to share feedback!
#tableau #datavisualization #makeovermonday #dataviz
Sharing my submission for Week 12/2025 #MakeoverMonday!
Dive into this #viz to discover Precipitation Anomalies from year 1940 -2024
📊 Tableau Link: public.tableau.com/views/AWorld...
Feel free to share feedback!
#tableau #datavisualization #makeovermonday #dataviz
March 24, 2025 at 6:12 AM
Hello #DataFam,
Sharing my submission for Week 12/2025 #MakeoverMonday!
Dive into this #viz to discover Precipitation Anomalies from year 1940 -2024
📊 Tableau Link: public.tableau.com/views/AWorld...
Feel free to share feedback!
#tableau #datavisualization #makeovermonday #dataviz
Sharing my submission for Week 12/2025 #MakeoverMonday!
Dive into this #viz to discover Precipitation Anomalies from year 1940 -2024
📊 Tableau Link: public.tableau.com/views/AWorld...
Feel free to share feedback!
#tableau #datavisualization #makeovermonday #dataviz
Reposted by Arshi Saleh

The #30DayChartChallenge will be back in April!
Follow @30daychartchall.bsky.social for updates and prompts.
#dataviz 📊
Follow @30daychartchall.bsky.social for updates and prompts.
#dataviz 📊
Are you ready for the next #30DayChartChallenge? 🚀
April is approaching fast, and we’re gearing up for the 5th edition of our visualization challenge! 📊 New look and creative prompts to spark inspiration, experimentation, learning.
We’ll reveal topics very soon, stay tuned! 🎉 Who’s in?
April is approaching fast, and we’re gearing up for the 5th edition of our visualization challenge! 📊 New look and creative prompts to spark inspiration, experimentation, learning.
We’ll reveal topics very soon, stay tuned! 🎉 Who’s in?

March 6, 2025 at 9:30 AM
The #30DayChartChallenge will be back in April!
Follow @30daychartchall.bsky.social for updates and prompts.
#dataviz 📊
Follow @30daychartchall.bsky.social for updates and prompts.
#dataviz 📊
Reposted by Arshi Saleh

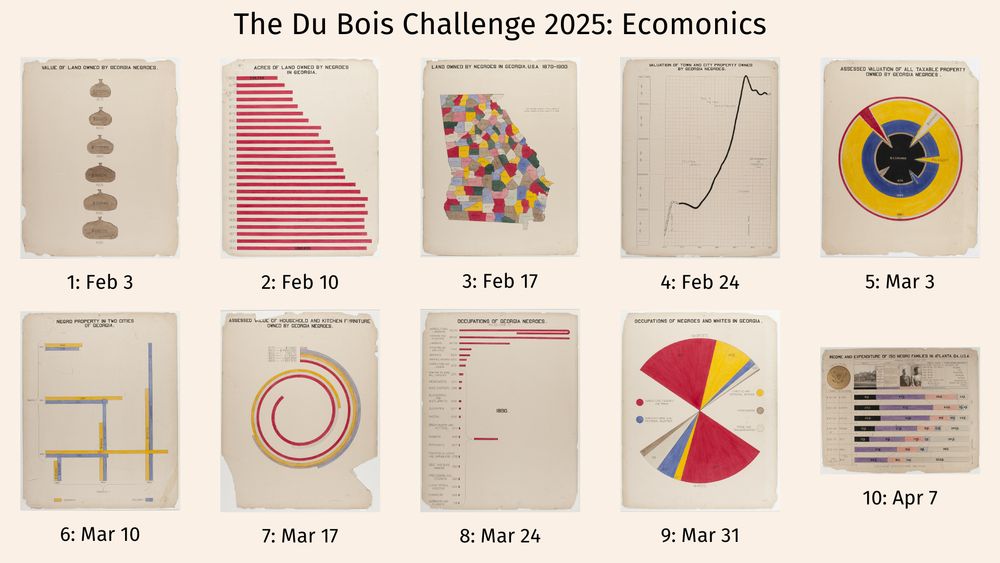
Advance your #dataviz skills by joining the weekly 2025 Du Bois Visualization Challenge. Starting on Feb 3rd, re-create visualizations from the 1900 Paris Exposition using modern tools. More details: https://buff.ly/3QjOsaF.
January 31, 2025 at 7:00 PM
Advance your #dataviz skills by joining the weekly 2025 Du Bois Visualization Challenge. Starting on Feb 3rd, re-create visualizations from the 1900 Paris Exposition using modern tools. More details: https://buff.ly/3QjOsaF.

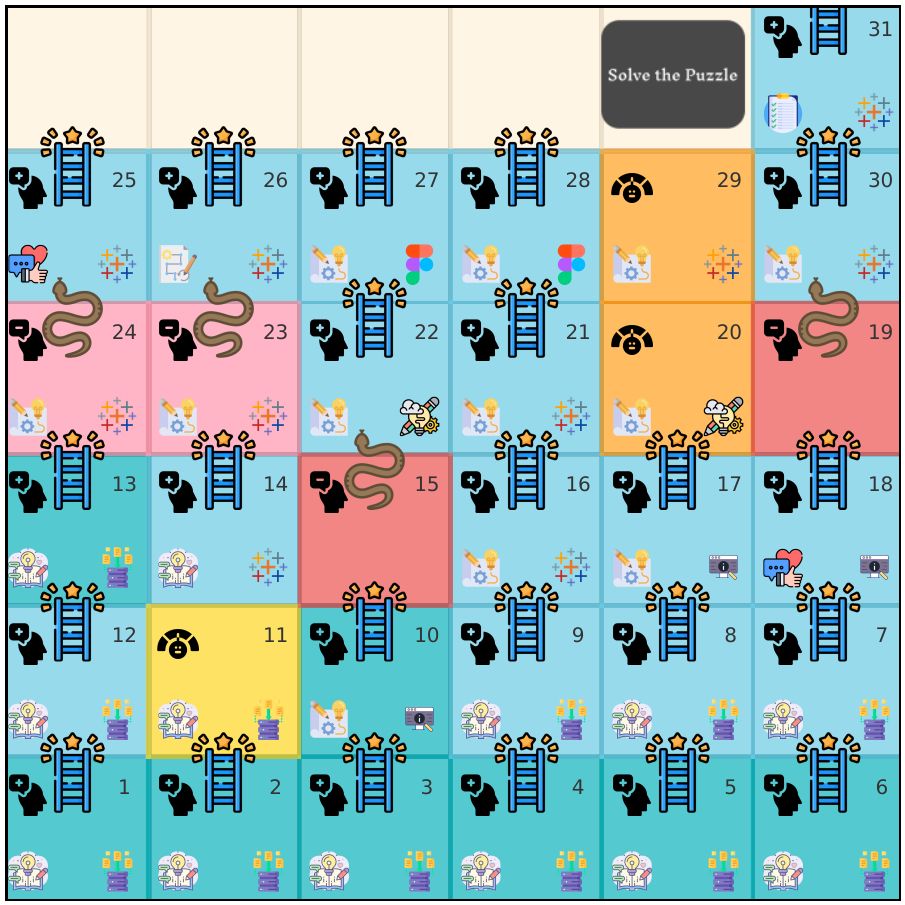
Hello #datafam,
Creating my first #IronViz entry felt like a snakes & ladder game and I want to share the BTS with you through my latest viz. Do dive in to discover the process. 🙂
📊 Tableau Link: public.tableau.com/views/MyIron...
#dataart #ironviz #design #informationdesign #tableau #dataviz
Creating my first #IronViz entry felt like a snakes & ladder game and I want to share the BTS with you through my latest viz. Do dive in to discover the process. 🙂
📊 Tableau Link: public.tableau.com/views/MyIron...
#dataart #ironviz #design #informationdesign #tableau #dataviz
January 14, 2025 at 2:28 PM
Hello #datafam,
Creating my first #IronViz entry felt like a snakes & ladder game and I want to share the BTS with you through my latest viz. Do dive in to discover the process. 🙂
📊 Tableau Link: public.tableau.com/views/MyIron...
#dataart #ironviz #design #informationdesign #tableau #dataviz
Creating my first #IronViz entry felt like a snakes & ladder game and I want to share the BTS with you through my latest viz. Do dive in to discover the process. 🙂
📊 Tableau Link: public.tableau.com/views/MyIron...
#dataart #ironviz #design #informationdesign #tableau #dataviz
Hello #DataFam,
Sharing the process behind the #makeovermonday w48/24 submission!
You can find the blog here: medium.com/@arshisaleh/...
You can also download the 📊 Tableau viz here: public.tableau.com/views/Christ...
#tableau #MOM #dynamiczonevisibility #informationdesign #storytelling
Sharing the process behind the #makeovermonday w48/24 submission!
You can find the blog here: medium.com/@arshisaleh/...
You can also download the 📊 Tableau viz here: public.tableau.com/views/Christ...
#tableau #MOM #dynamiczonevisibility #informationdesign #storytelling

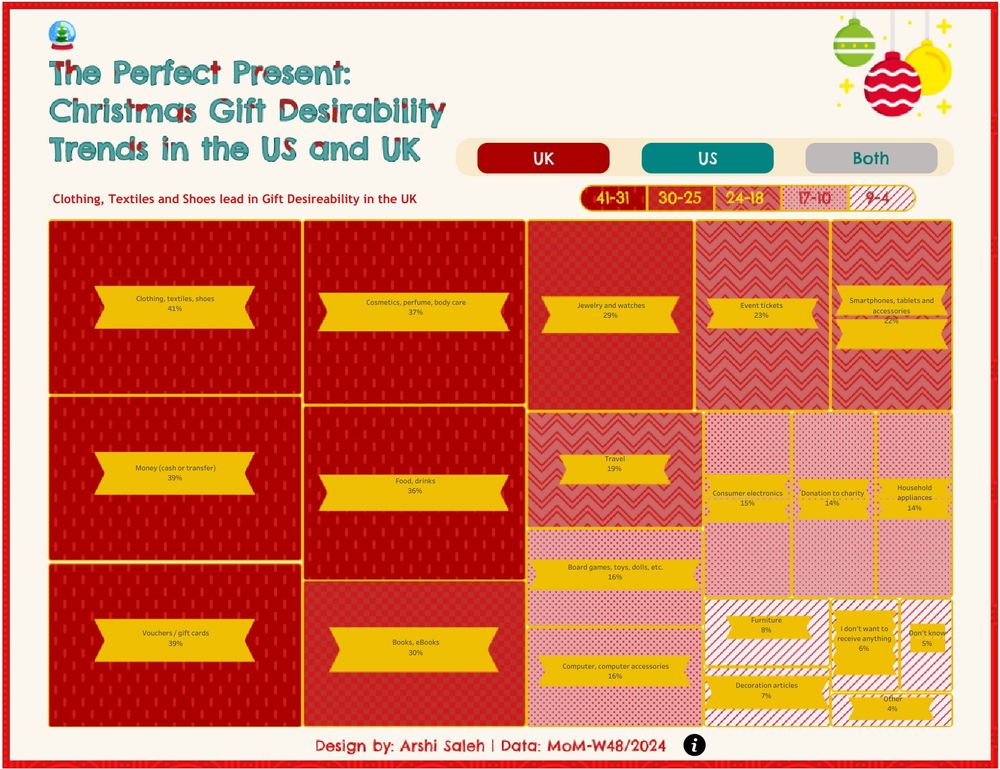
How to add texture/pattern to your tableau chart using Dynamic Zone visibility?
The #MakeoverMonday dataset for week 48, 2024 was Christmas gift desirability in the US and UK and when I saw the dataset I knew that I…
medium.com
December 23, 2024 at 1:20 PM
Hello #DataFam,
Sharing the process behind the #makeovermonday w48/24 submission!
You can find the blog here: medium.com/@arshisaleh/...
You can also download the 📊 Tableau viz here: public.tableau.com/views/Christ...
#tableau #MOM #dynamiczonevisibility #informationdesign #storytelling
Sharing the process behind the #makeovermonday w48/24 submission!
You can find the blog here: medium.com/@arshisaleh/...
You can also download the 📊 Tableau viz here: public.tableau.com/views/Christ...
#tableau #MOM #dynamiczonevisibility #informationdesign #storytelling
Reposted by Arshi Saleh

We are hiring a Data Analyst!
Join our international team to uncover insights, collaborate on impactful projects, and create solutions that matter.
Ready to take your skills to the next level? Apply now: cleverfranke.com/careers
#datavisualization #datadesign #design #vacancies #dataanalyst
Join our international team to uncover insights, collaborate on impactful projects, and create solutions that matter.
Ready to take your skills to the next level? Apply now: cleverfranke.com/careers
#datavisualization #datadesign #design #vacancies #dataanalyst
December 18, 2024 at 2:10 PM
We are hiring a Data Analyst!
Join our international team to uncover insights, collaborate on impactful projects, and create solutions that matter.
Ready to take your skills to the next level? Apply now: cleverfranke.com/careers
#datavisualization #datadesign #design #vacancies #dataanalyst
Join our international team to uncover insights, collaborate on impactful projects, and create solutions that matter.
Ready to take your skills to the next level? Apply now: cleverfranke.com/careers
#datavisualization #datadesign #design #vacancies #dataanalyst
Hello #DataFam,
Sharing my submission for this week's #MakeoverMonday. If you are based in UK or US and are looking for the perfect gift for family & friends then this is the viz for you.
📊 #Tableau Link: public.tableau.com/views/Christ...
#dataviz 📊 #datavisualization #art 📊 #Data&Viz
Sharing my submission for this week's #MakeoverMonday. If you are based in UK or US and are looking for the perfect gift for family & friends then this is the viz for you.
📊 #Tableau Link: public.tableau.com/views/Christ...
#dataviz 📊 #datavisualization #art 📊 #Data&Viz
December 16, 2024 at 9:27 AM
Hello #DataFam,
Sharing my submission for this week's #MakeoverMonday. If you are based in UK or US and are looking for the perfect gift for family & friends then this is the viz for you.
📊 #Tableau Link: public.tableau.com/views/Christ...
#dataviz 📊 #datavisualization #art 📊 #Data&Viz
Sharing my submission for this week's #MakeoverMonday. If you are based in UK or US and are looking for the perfect gift for family & friends then this is the viz for you.
📊 #Tableau Link: public.tableau.com/views/Christ...
#dataviz 📊 #datavisualization #art 📊 #Data&Viz
Reposted by Arshi Saleh
📊 Manual reporting can drain time and energy, leaving teams scrambling to piece together insights from outdated data.
Daria Voronova explores how automated business health decks in Tableau bring clarity and collaboration, transforming decision-making.
nightingaledvs.com/the-business...
Daria Voronova explores how automated business health decks in Tableau bring clarity and collaboration, transforming decision-making.
nightingaledvs.com/the-business...
The Business MRI: A Smarter Way to Track Performance and Collaborate - Nightingale
Discover how an automated business health deck in Tableau transforms weekly reporting, streamlining decision-making.
nightingaledvs.com
November 30, 2024 at 9:04 PM
📊 Manual reporting can drain time and energy, leaving teams scrambling to piece together insights from outdated data.
Daria Voronova explores how automated business health decks in Tableau bring clarity and collaboration, transforming decision-making.
nightingaledvs.com/the-business...
Daria Voronova explores how automated business health decks in Tableau bring clarity and collaboration, transforming decision-making.
nightingaledvs.com/the-business...
Reposted by Arshi Saleh

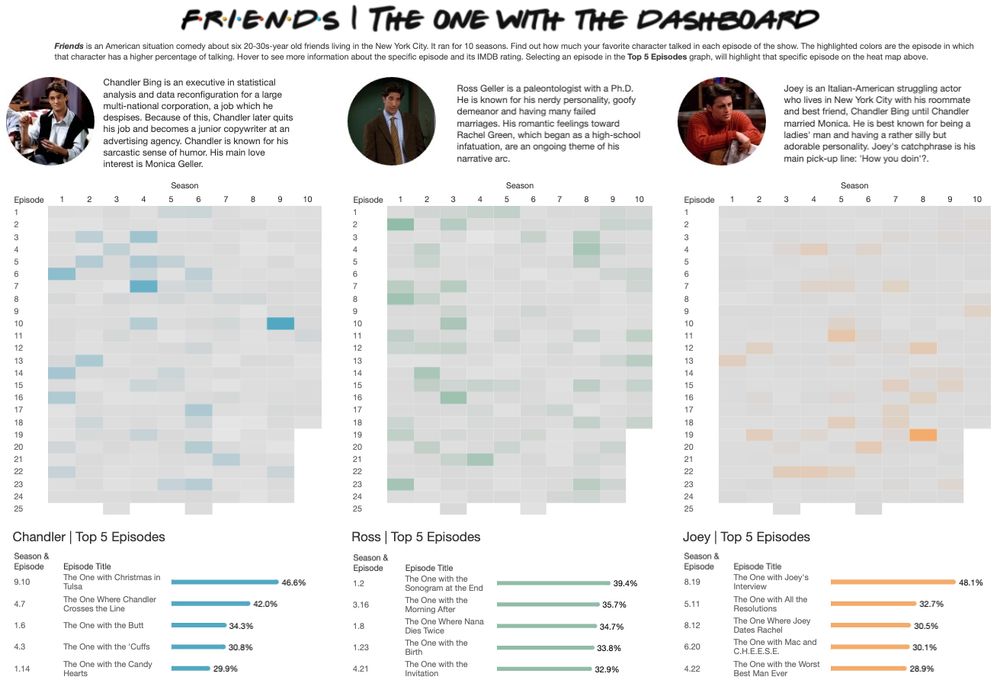
🚨 Hi Data Fam! Feel like I haven't vizzed in forever, so I'm excited to share a new dashboard about the speaking time of the 6 main characters on the TV show Friends!
📊 Check out the viz on Tableau Public: public.tableau.com/app/profile/...
📊 Check out the viz on Tableau Public: public.tableau.com/app/profile/...
November 26, 2024 at 12:08 PM
🚨 Hi Data Fam! Feel like I haven't vizzed in forever, so I'm excited to share a new dashboard about the speaking time of the 6 main characters on the TV show Friends!
📊 Check out the viz on Tableau Public: public.tableau.com/app/profile/...
📊 Check out the viz on Tableau Public: public.tableau.com/app/profile/...
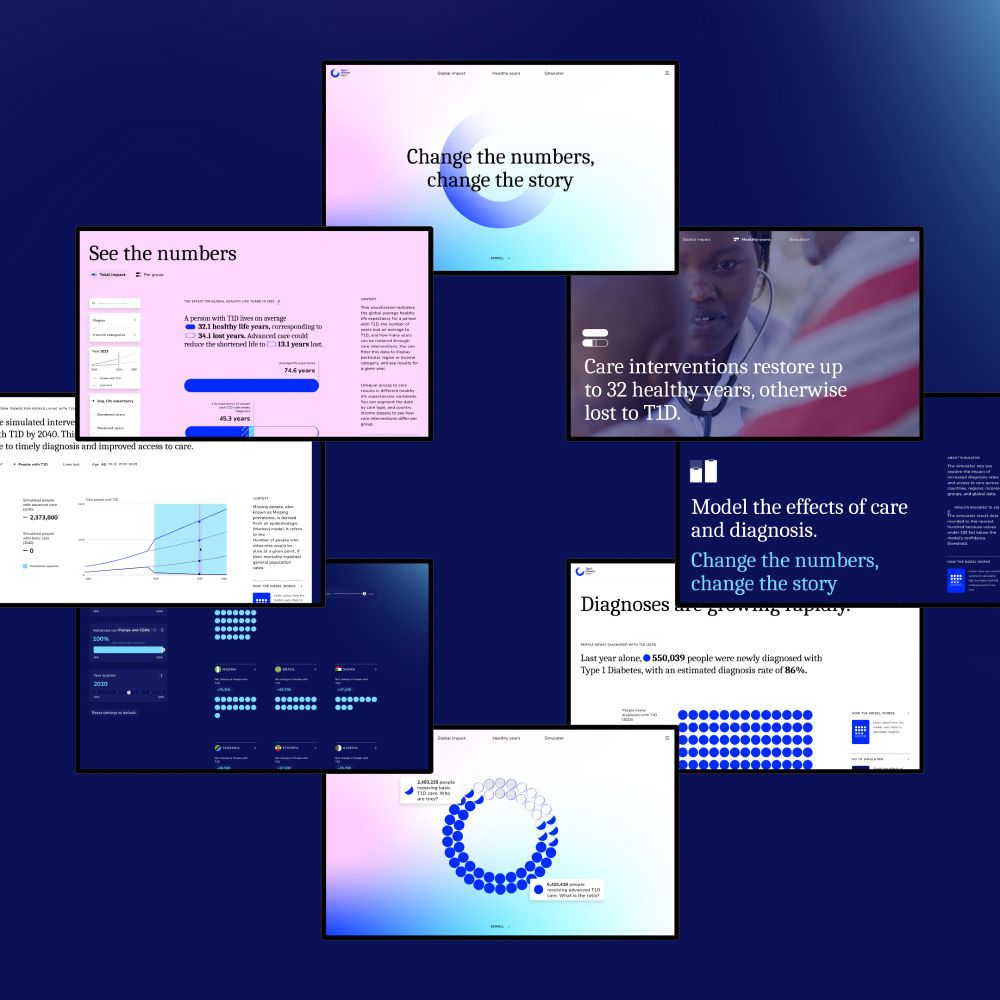
Hello #datafam and #dataviz community,
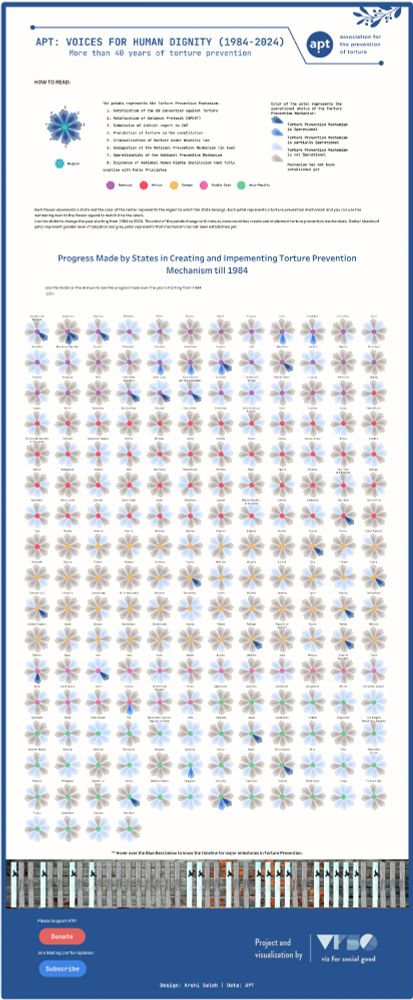
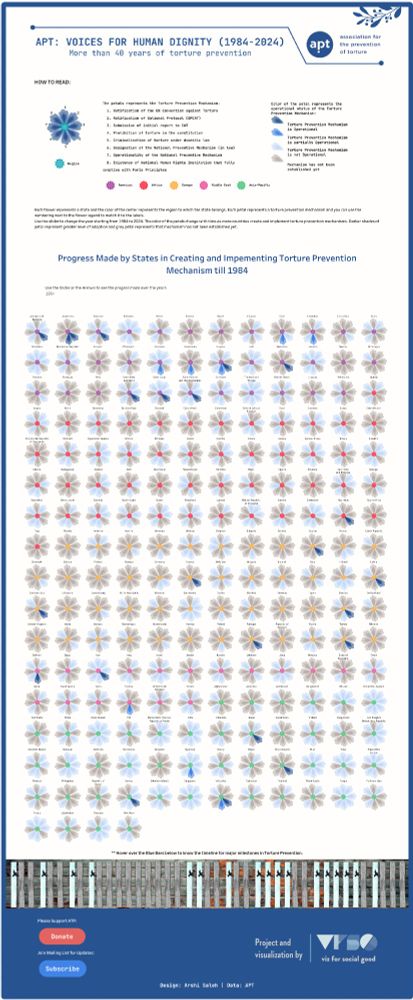
Sharing my latest project for #VFSG and APT which showcases the work done in implementing torture prevention mechanism.
Tableau Link: public.tableau.com/views/APTVoi...
#tableau #tortureprevention #datavisualization #storytelling #data #informationdesign
Sharing my latest project for #VFSG and APT which showcases the work done in implementing torture prevention mechanism.
Tableau Link: public.tableau.com/views/APTVoi...
#tableau #tortureprevention #datavisualization #storytelling #data #informationdesign
November 25, 2024 at 1:37 PM
Hello #datafam and #dataviz community,
Sharing my latest project for #VFSG and APT which showcases the work done in implementing torture prevention mechanism.
Tableau Link: public.tableau.com/views/APTVoi...
#tableau #tortureprevention #datavisualization #storytelling #data #informationdesign
Sharing my latest project for #VFSG and APT which showcases the work done in implementing torture prevention mechanism.
Tableau Link: public.tableau.com/views/APTVoi...
#tableau #tortureprevention #datavisualization #storytelling #data #informationdesign
Reposted by Arshi Saleh

Welcome to the 📊 Data Viz feed! This feed is designed to encourage sharing work and all kinds of discussion related to the broad field of data viz.
To participate, you must:
- Include 📊, #dataviz, or #datavis in your post
- Be added to the account list. Sign up here: forms.gle/mcVVczaQCBJL...
To participate, you must:
- Include 📊, #dataviz, or #datavis in your post
- Be added to the account list. Sign up here: forms.gle/mcVVczaQCBJL...
February 29, 2024 at 2:51 PM
Welcome to the 📊 Data Viz feed! This feed is designed to encourage sharing work and all kinds of discussion related to the broad field of data viz.
To participate, you must:
- Include 📊, #dataviz, or #datavis in your post
- Be added to the account list. Sign up here: forms.gle/mcVVczaQCBJL...
To participate, you must:
- Include 📊, #dataviz, or #datavis in your post
- Be added to the account list. Sign up here: forms.gle/mcVVczaQCBJL...
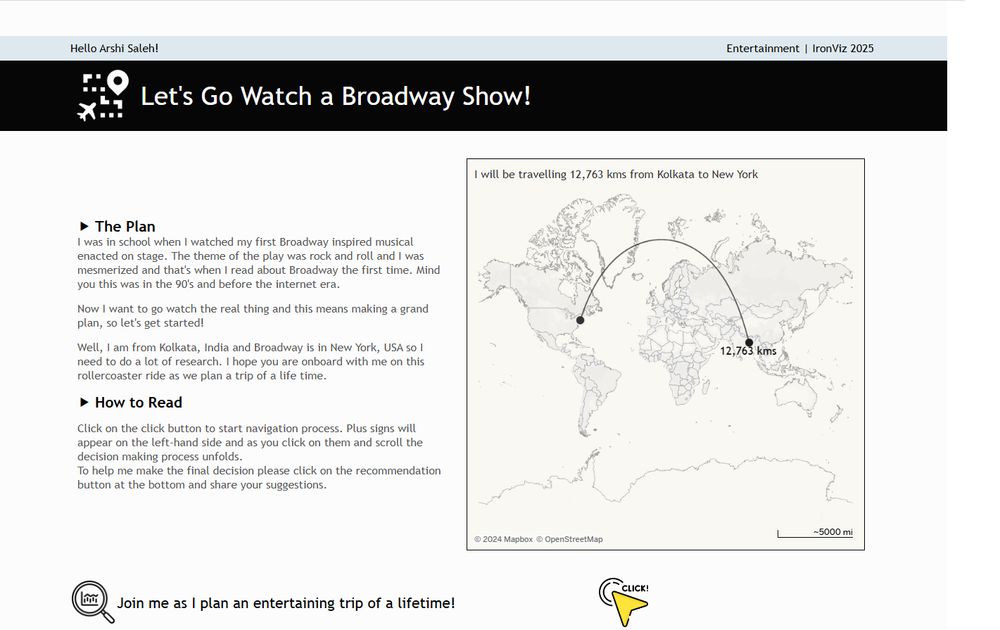
Hello #DataFam,
I am really excited to share my first #IronViz submission. It's been a roller coaster ride and I am glad to have made it before the deadline. Hope you enjoy it!
📊 Tableau Link: public.tableau.com/views/LetsGo...
I am really excited to share my first #IronViz submission. It's been a roller coaster ride and I am glad to have made it before the deadline. Hope you enjoy it!
📊 Tableau Link: public.tableau.com/views/LetsGo...
October 31, 2024 at 8:30 PM
Hello #DataFam,
I am really excited to share my first #IronViz submission. It's been a roller coaster ride and I am glad to have made it before the deadline. Hope you enjoy it!
📊 Tableau Link: public.tableau.com/views/LetsGo...
I am really excited to share my first #IronViz submission. It's been a roller coaster ride and I am glad to have made it before the deadline. Hope you enjoy it!
📊 Tableau Link: public.tableau.com/views/LetsGo...
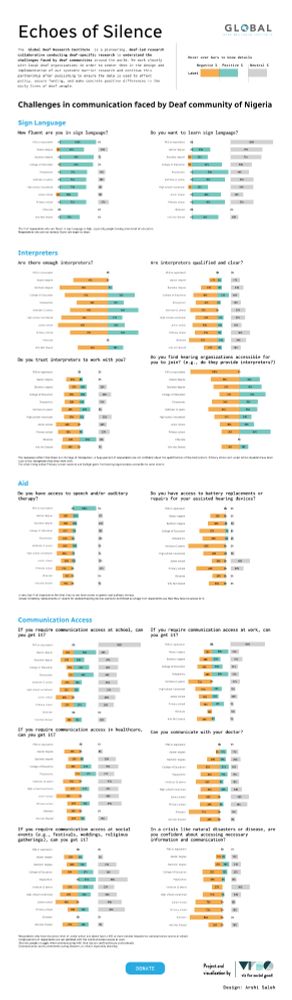
Hello #datafam,
Sharing my submission for #VizforSocialGood where I have explored the challenges in communication faced by the #Deaf community in #Nigeria.
Tableau Link: public.tableau.com/views/Echoes...
#VFSG #DataVisualization #DataForGood #DataForAll
#GDRI #Data #tableau #VFSG
Sharing my submission for #VizforSocialGood where I have explored the challenges in communication faced by the #Deaf community in #Nigeria.
Tableau Link: public.tableau.com/views/Echoes...
#VFSG #DataVisualization #DataForGood #DataForAll
#GDRI #Data #tableau #VFSG
May 31, 2024 at 7:38 AM
Hello #datafam,
Sharing my submission for #VizforSocialGood where I have explored the challenges in communication faced by the #Deaf community in #Nigeria.
Tableau Link: public.tableau.com/views/Echoes...
#VFSG #DataVisualization #DataForGood #DataForAll
#GDRI #Data #tableau #VFSG
Sharing my submission for #VizforSocialGood where I have explored the challenges in communication faced by the #Deaf community in #Nigeria.
Tableau Link: public.tableau.com/views/Echoes...
#VFSG #DataVisualization #DataForGood #DataForAll
#GDRI #Data #tableau #VFSG
*** #NewDataViz ***
Hello #DataFam,
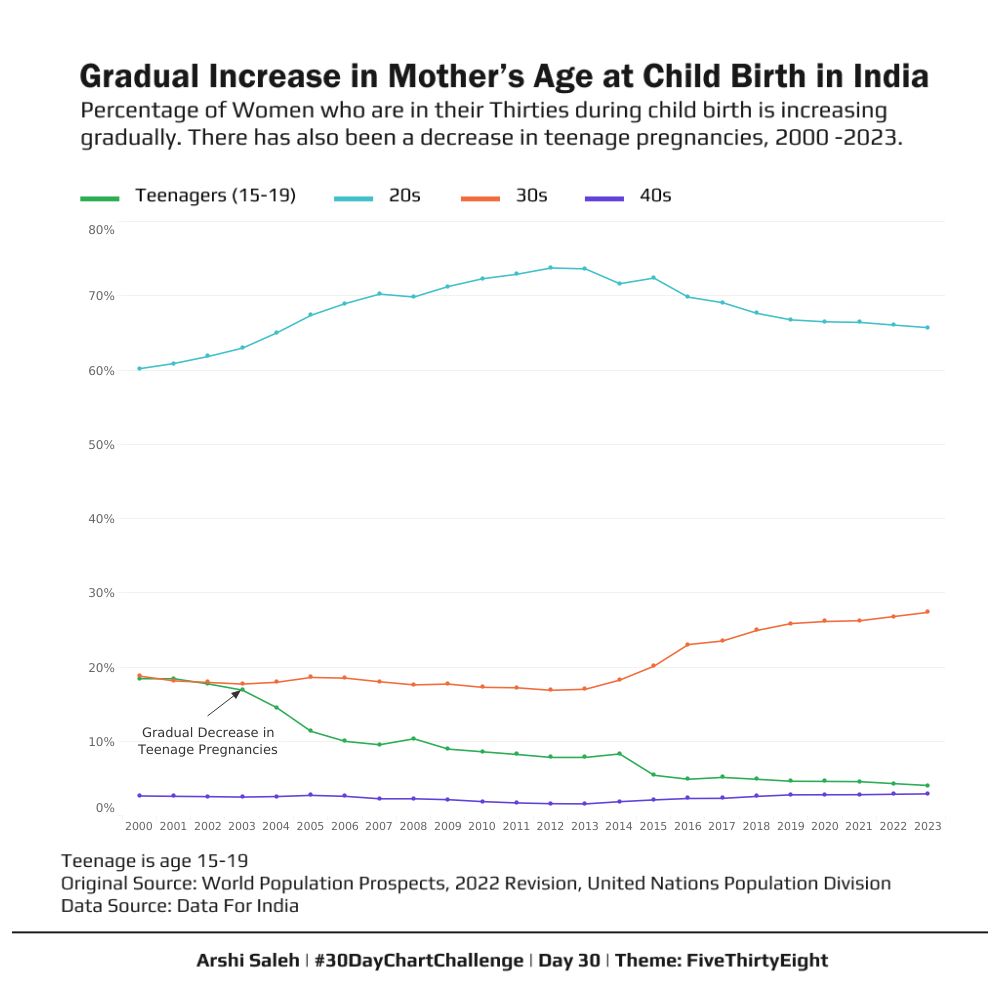
For #Day30 of #30DayChartChallenge the prompt was #theme: #fivethirtyeight and I have chosen to explore the Age of Women at Child Birth, in India. The data has been sourced from DataforIndia.
Tableau Link: public.tableau.com/views/30DayC...
Hello #DataFam,
For #Day30 of #30DayChartChallenge the prompt was #theme: #fivethirtyeight and I have chosen to explore the Age of Women at Child Birth, in India. The data has been sourced from DataforIndia.
Tableau Link: public.tableau.com/views/30DayC...
April 30, 2024 at 1:55 PM
*** #NewDataViz ***
Hello #DataFam,
For #Day30 of #30DayChartChallenge the prompt was #theme: #fivethirtyeight and I have chosen to explore the Age of Women at Child Birth, in India. The data has been sourced from DataforIndia.
Tableau Link: public.tableau.com/views/30DayC...
Hello #DataFam,
For #Day30 of #30DayChartChallenge the prompt was #theme: #fivethirtyeight and I have chosen to explore the Age of Women at Child Birth, in India. The data has been sourced from DataforIndia.
Tableau Link: public.tableau.com/views/30DayC...
Hello #DataFam,
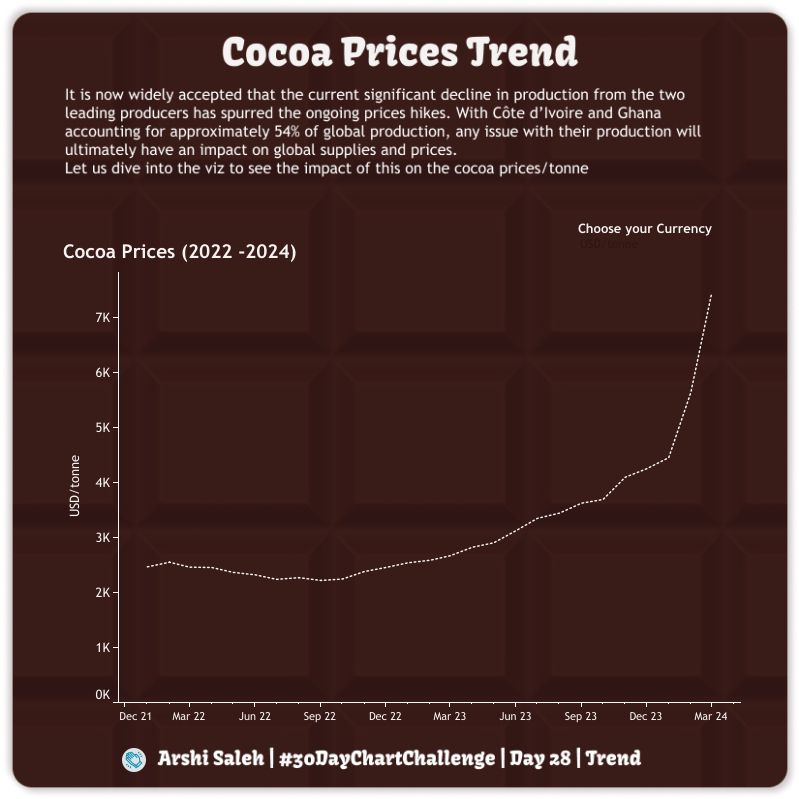
For #Day28 of the #30DayChartChallenge the prompt was #trends and I have explored the cocoa price trend.
If you are a #chocolate lover, then this is the #chart for you.
📊 Tableau Link: public.tableau.com/shared/7C4YS...
#tableau #tableaupublic #datavisualization #cocoa
For #Day28 of the #30DayChartChallenge the prompt was #trends and I have explored the cocoa price trend.
If you are a #chocolate lover, then this is the #chart for you.
📊 Tableau Link: public.tableau.com/shared/7C4YS...
#tableau #tableaupublic #datavisualization #cocoa
April 29, 2024 at 6:04 PM
Hello #DataFam,
For #Day28 of the #30DayChartChallenge the prompt was #trends and I have explored the cocoa price trend.
If you are a #chocolate lover, then this is the #chart for you.
📊 Tableau Link: public.tableau.com/shared/7C4YS...
#tableau #tableaupublic #datavisualization #cocoa
For #Day28 of the #30DayChartChallenge the prompt was #trends and I have explored the cocoa price trend.
If you are a #chocolate lover, then this is the #chart for you.
📊 Tableau Link: public.tableau.com/shared/7C4YS...
#tableau #tableaupublic #datavisualization #cocoa
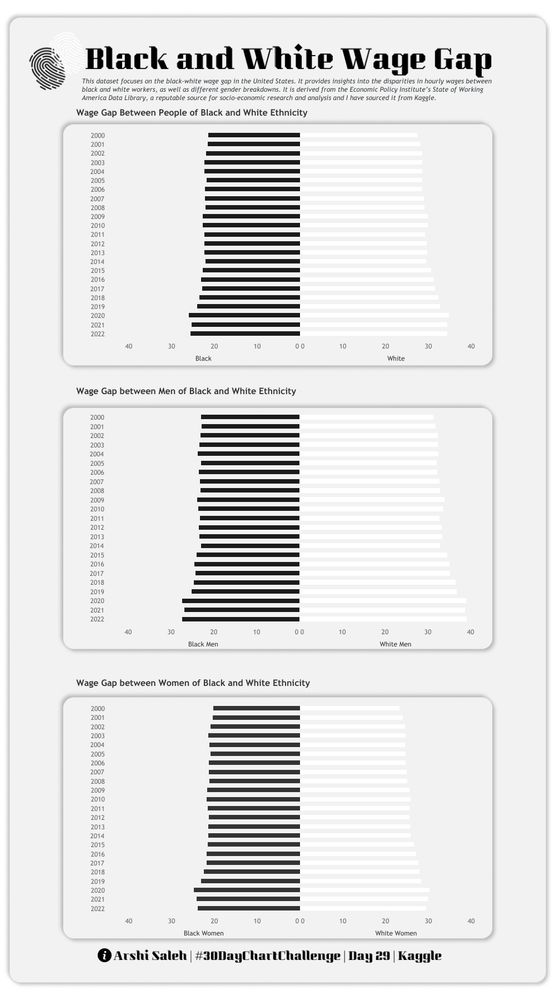
Hello #DataFam,
For #Day29 of the #30DayChartChallenge the prompt was #black and #white and I have explored the Wage Gap for people of Black and White Ethnicity.
📊 Tableau Link: public.tableau.com/views/30DayC...
#tableau #tableaupublic #diversity #paygap #datavisualization #dataviz
For #Day29 of the #30DayChartChallenge the prompt was #black and #white and I have explored the Wage Gap for people of Black and White Ethnicity.
📊 Tableau Link: public.tableau.com/views/30DayC...
#tableau #tableaupublic #diversity #paygap #datavisualization #dataviz
April 29, 2024 at 1:45 PM
Hello #DataFam,
For #Day29 of the #30DayChartChallenge the prompt was #black and #white and I have explored the Wage Gap for people of Black and White Ethnicity.
📊 Tableau Link: public.tableau.com/views/30DayC...
#tableau #tableaupublic #diversity #paygap #datavisualization #dataviz
For #Day29 of the #30DayChartChallenge the prompt was #black and #white and I have explored the Wage Gap for people of Black and White Ethnicity.
📊 Tableau Link: public.tableau.com/views/30DayC...
#tableau #tableaupublic #diversity #paygap #datavisualization #dataviz
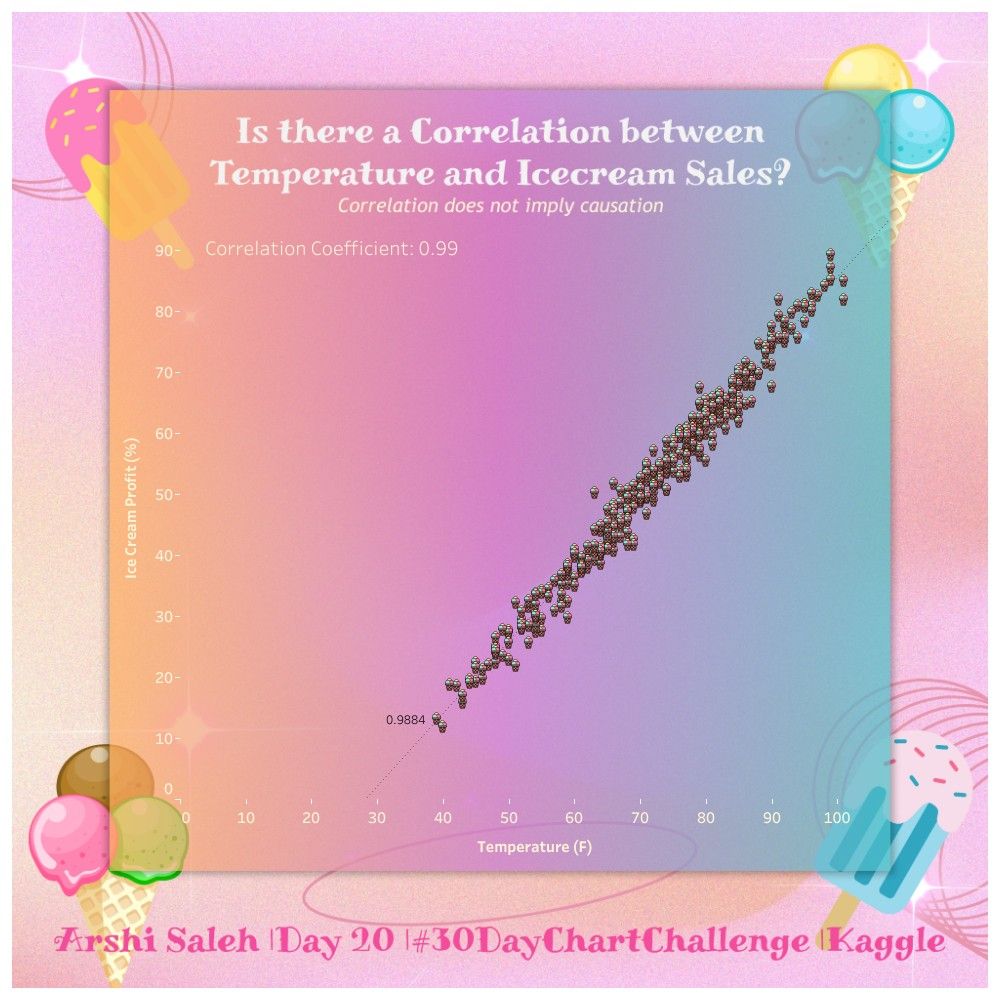
Hello #DataFam,
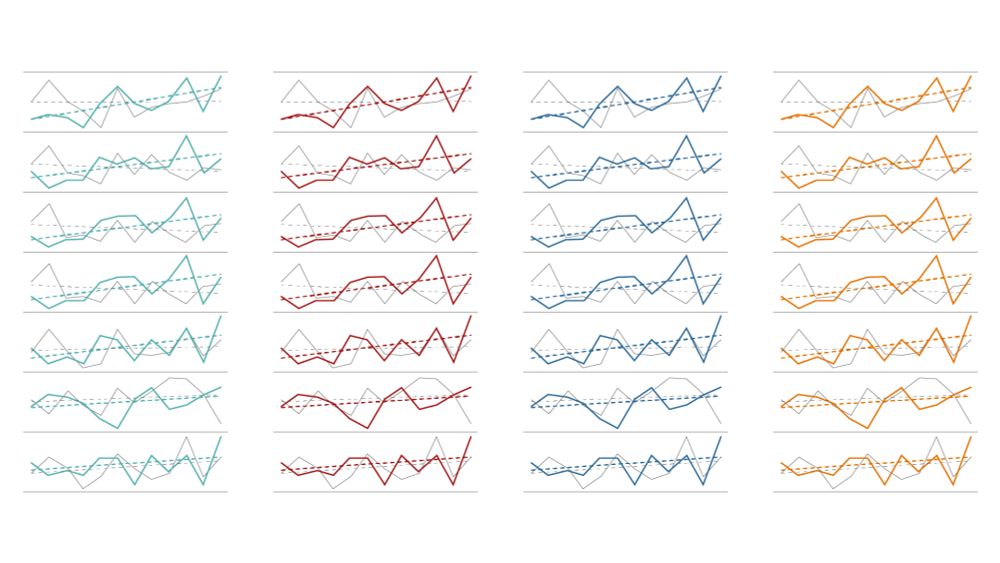
Sharing my viz for #Day20 of #30DayChartChallenge, prompt #correlation. Let's dive into this viz and find out if there is a correlation between Ice cream Profits and Temperature.
📊 Tableau Link: public.tableau.com/views/30DayC...
#tableau #datavisualization
Sharing my viz for #Day20 of #30DayChartChallenge, prompt #correlation. Let's dive into this viz and find out if there is a correlation between Ice cream Profits and Temperature.
📊 Tableau Link: public.tableau.com/views/30DayC...
#tableau #datavisualization
April 27, 2024 at 3:19 PM
Hello #DataFam,
Sharing my viz for #Day20 of #30DayChartChallenge, prompt #correlation. Let's dive into this viz and find out if there is a correlation between Ice cream Profits and Temperature.
📊 Tableau Link: public.tableau.com/views/30DayC...
#tableau #datavisualization
Sharing my viz for #Day20 of #30DayChartChallenge, prompt #correlation. Let's dive into this viz and find out if there is a correlation between Ice cream Profits and Temperature.
📊 Tableau Link: public.tableau.com/views/30DayC...
#tableau #datavisualization