
Zack Labe
@zacklabe.com
41K followers
1K following
3.7K posts
Climate Scientist at @climatecentral.org | PhD | Passionate about improving science communication through data-driven stories | Harrisburg, PA | https://zacklabe.com/
Views, thoughts, and opinions expressed here are only my own.
Posts
Media
Videos
Starter Packs
Pinned

Zack Labe
@zacklabe.com
· 1h
Reposted by Zack Labe


Zack Labe
@zacklabe.com
· 2d
Zack Labe
@zacklabe.com
· 2d
Zack Labe
@zacklabe.com
· 2d
Zack Labe
@zacklabe.com
· 2d
Zack Labe
@zacklabe.com
· 2d
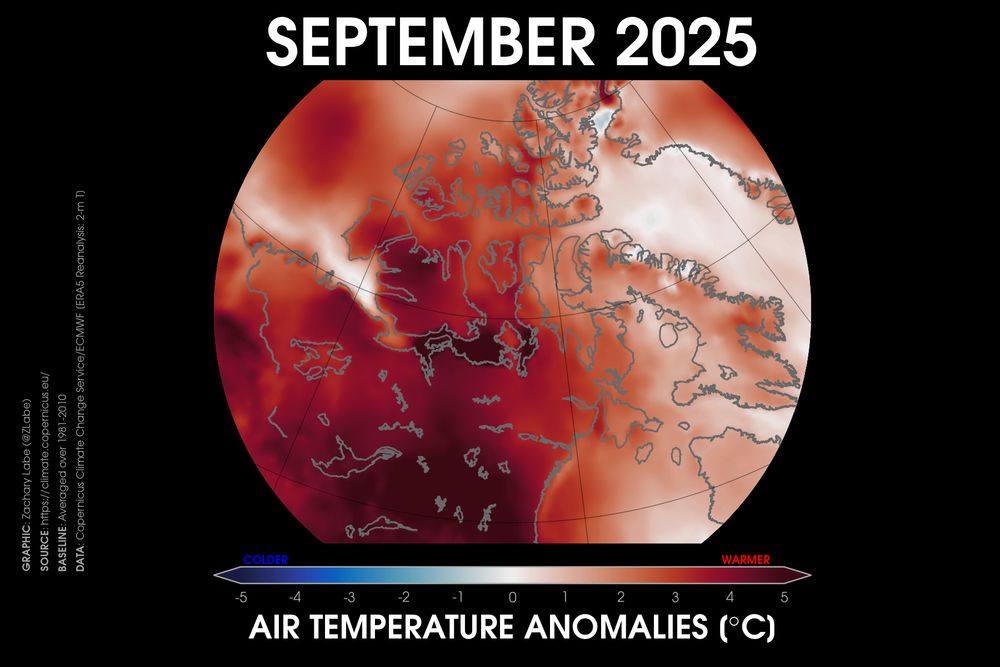
![Screenshot that says "August 2025 Monthly Update [September update delayed due to US Govn’t shutdown resulting in unavailable data]"](https://cdn.bsky.app/img/feed_thumbnail/plain/did:plc:nipoqrw2c5olbwkhy3bqxkiy/bafkreif5cerl2hdakserry7e5par5uydnhha2zqyks6owuhejrlbpuwyfq@jpeg)
Zack Labe
@zacklabe.com
· 3d
Zack Labe
@zacklabe.com
· 3d

Reposted by Zack Labe

Zack Labe
@zacklabe.com
· 4d
