Simon Lee
@simonleewx.com
4.4K followers 850 following 1.3K posts
Lecturer in Atmospheric Science, University of St Andrews. Co-Editor-in-Chief, Weather. Large-scale weather & climate variability, prediction & change. simonleewx.com
Posts Media Videos Starter Packs
simonleewx.com
Very much so, thanks Simon!
simonleewx.com
Even sunny St Andrews isn't immune from the anticyclonic gloom today ☁️
Grey clouds over a still sea with some small waves breaking onto the beach
Reposted by Simon Lee
kmalloy.bsky.social
An atmospheric general circulation model you can run on a Python Jupyter notebook?! Heck yeah! Check out this project- both an educational tool for undergraduates/graduate students, and a research tool for scientists interested in idealized climate modeling.
journals.ametsoc.org/view/journal...
journals.ametsoc.org
Reposted by Simon Lee
earthscista.bsky.social
Our first years headed out on their first field trip to Ruddons Point on the Fife coast this weekend – diving into Quaternary landscape evolution & sea level changes! Plenty of sunshine on the Saturday trips, but Sunday morning brought the haar (and not just the 'haar haar' response to staff jokes)
simonleewx.com
This particular reporter usually does a good job, I’ve found!
simonleewx.com
I'm teaching teleconnections & atmospheric/oceanic variability (+ a soupçon of sub/seasonal forecasting) to our Junior Honours students at the moment, so it's perfect timing to also be quoted here on forecasts for the coming season (article better than headline!) www.dailymail.co.uk/news/article...
Met Office gives first winter outlook as experts explain Polar Vortex
The Polar Vortex is a large circulation of winds 30 miles above ground level in the stratosphere, and can impact winter weather by strengthening or weakening.
www.dailymail.co.uk
simonleewx.com
Past instalments in the Global and Regional Climate series, going back to 1995, can be found here: rmets.onlinelibrary.wiley.com/doi/toc/10.1...

An ongoing log of our changing climate.
simonleewx.com
Global and regional climate in 2024 🌡️📈

The latest annual assessment from the Hadley Centre @metoffice.gov.uk published in @rmets.org Weather

Free to read: doi.org/10.1002/wea....
Screenshot of the Weather article page "Global and regional climate in 2024" led by Caroline Sandford
simonleewx.com
Interesting – looks like a large disturbance from the bottom up (see U-wind time series here: ozonewatch.gsfc.nasa.gov/meteorology/...). Haven't been following too closely but perhaps barotropic anomalies from some large blocking anticyclones over Eurasia. A bit early to be too significant, though.
NASA Ozone Watch: 2025 Arctic MERRA-2 Wind
2025 Arctic MERRA-2 Wind
ozonewatch.gsfc.nasa.gov
simonleewx.com
Aye I only spotted it last night when I revisited the chart for Floris!
simonleewx.com
Storm Floris at 12 UTC 4 August 2025 vs. Storm Amy at 18 UTC 3 October 2025.

Strikingly similar synoptic patterns and locations of the two storms separated by only two months!
Storm Floris surface pressure and fronts from the Met Office Storm Amy surface pressure and fronts from the Met Office
simonleewx.com
Excellent! Glad to hear it's still going.
simonleewx.com
Ah, I loved that view during my time at UoR! Hope you are enjoying your time there.
Reposted by Simon Lee
hausfath.bsky.social
And here is the percentage of the world's land area setting a new all-time monthly maximum temperature record in each decade:
simonleewx.com
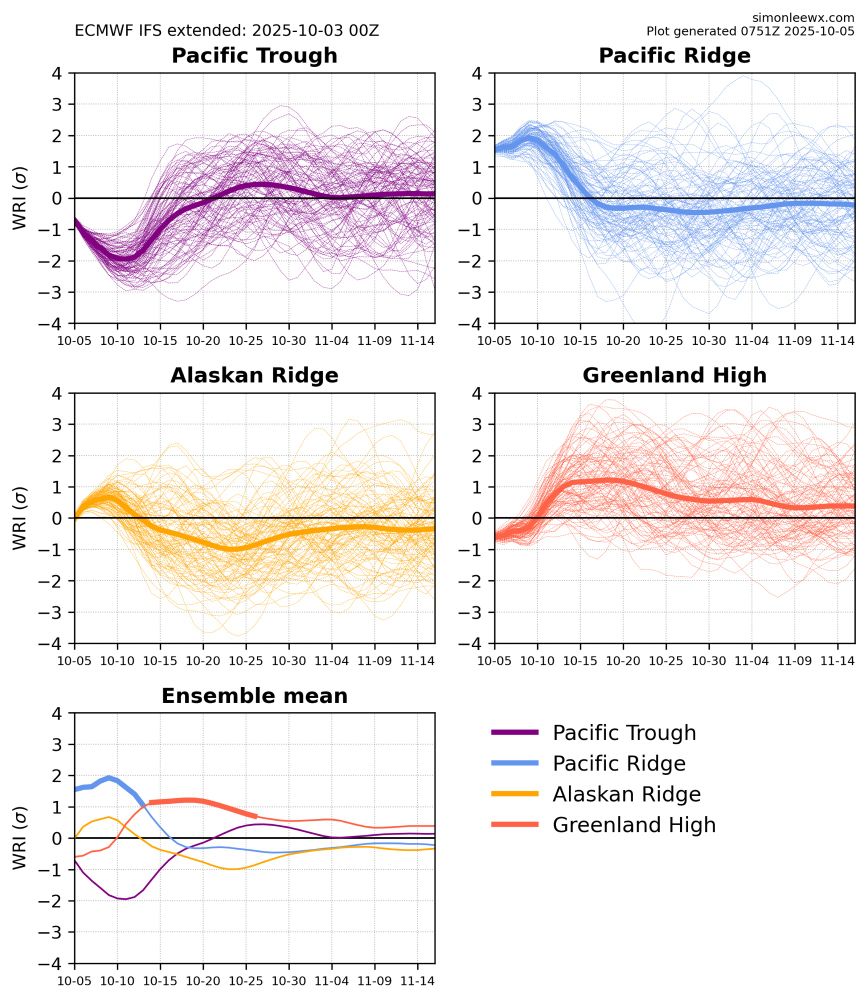
The west–east temperature contrast across North America is a hallmark of the Pacific Ridge regime, which is currently at 1.5–2 standard deviations simonleewx.com/ecmwf_north_...
Weather Regime Index plots from the ECMWF IFS subseasonal ensemble
simonleewx.com
Amy is a separate low pressure system, hence the new name. It did spawn from Humberto but the closed low is considered different.
simonleewx.com
Wonder what NH mean alone will look like?
simonleewx.com
This is absolutely staggering.
zacklabe.com
Record warm ocean temperatures continued in September across the North Pacific Ocean, with a number of consequential impacts (including on downstream weather patterns).

This graph shows the average for a band across the midlatitudes for every September from 1854-2025 using @noaa.gov ERSSTv5 data.
Green line graph time series of average sea surface temperature anomalies for each September from 1850 through 2025 for only the midlatitude region of the North Pacific Ocean. There is large interannual variability, but an overall long-term increasing trend. Anomalies are computed relative to a 1981-2010 baseline. 2025 is a record high.
simonleewx.com
Beaufort Force 12 (73mph or greater) is “hurricane force”, and that is referred to in storms in the UK where appropriate. But there is a VERY big difference between hurricane force winds and an actual hurricane.
simonleewx.com
Please provide evidence to support your claims.
simonleewx.com
“Hurricanes” are tropical cyclones, which feed off the energy of high oceanic heat. They are an entirely different type of storm which do not reach our shores. The storms we experience, like Amy, feed off the temperature contrast between cold and warm air masses.
Reposted by Simon Lee
eddywx.bsky.social
#StormAmy boomerang loop of #Meteosat12 #MTG water vapour 6.2micron channel imagery over 36h (3-4 Oct 2025) shows extent & expansion of deep dry air intrusion, before being spun majestically around the record-breaking deep cyclone centre #VorticityInAction
simonleewx.com
Yes, Amy spawned off Humberto at the end of its life — in fact, for a while, it looked like the storm hitting the UK would be ex-Humberto until it became clearer that it was a separate circulation.