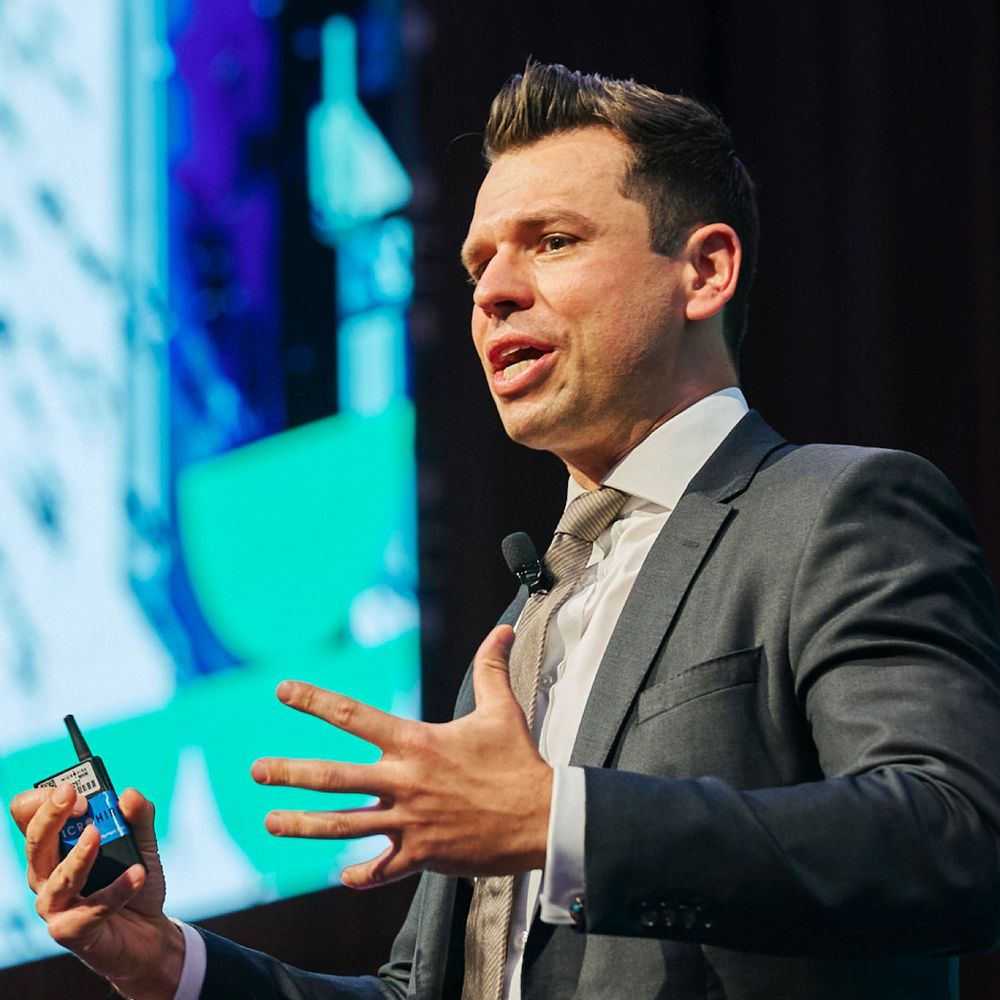
Simon Kuestenmacher
@simongerman600.bsky.social
13K followers 440 following 2.3K posts
German #geographer and #demographer in #Melbourne. I love and share #maps and #data that explain how the #world works.
Posts Media Videos Starter Packs
simongerman600.bsky.social
I was hoping to be slightly amused by this data but ended up being shocked. We see the most typically male and female reasons to be admitted to hospital in England. Only 10% of all psychosocial admissions are for men while men dominate suicide statistics. Source: buff.ly/W5PeSyl
simongerman600.bsky.social
The Australian Bureau of Statistics is to be commended for their bad statistic jokes. Well done!
simongerman600.bsky.social
How long will these countries need to DOUBLE their populations? Oman and Syria are doubling in only 20 years. Source: buff.ly/5yq0JHi
simongerman600.bsky.social
The chart shows where we humans get our electricity from. Coal is still a significant part of the mix. Phasing coal out will take decades. A young environmentalist is probably well advised to become an engineer and push for cleaner alternatives by making them cheaper. Source: buff.ly/gjZpGsq
simongerman600.bsky.social
As a dad of young kids living in Australia, I love that Bluey outperforms absolutely everyone.
simongerman600.bsky.social
On this map, @Maps_interlude shows us the number of spider species across Europe. Obviously, large countries with a range of biomes have more spiders than tiny countries. The Italians are the real Spidermen of Europe.
simongerman600.bsky.social
In Iceland geology nerds can channel their inner Homer Simpson… Who doesn’t like a post that requires both minimal Simpsons and minimal geology knowledge?
simongerman600.bsky.social
“Name one city in Estonia” a fun game for anyone outside of the country. Naming one city will be possible for a few folks. Naming a second? Not many folks will manage. Maybe some ice hockey fans?!
simongerman600.bsky.social
This might come in handy one day at a trivia night?
simongerman600.bsky.social
Now that’s a size-comparison map that I hadn’t seen before: Hawaii 🌺 overlayed on top of the contiguous US shows just how far spread out the Hawaiian islands are. Big geopolitical importance for a lovely corner of the world.
simongerman600.bsky.social
I think including Hobart and even Perth was unnecessary for this #badgeographyjoke 😉
simongerman600.bsky.social
This map shows the projected change in electoral college votes for the 2030 US election. This is about relative population size. We saw huge population flows from California to Texas and Florida. Source: buff.ly/TLpXOa6
simongerman600.bsky.social
This data is a combination of population age (older people are heaps more likely to have Alzheimer's), likelihood of diagnosis being registered, and factors that actually determine if you get Alzheimer's - I have no idea what these are... Source: buff.ly/rTmtUD7
simongerman600.bsky.social
This map shows what share of German cities was destroyed during the Second World War. It's easy to spot these areas today: no old building stock and lots of 1950s and 1960s concrete. Source: buff.ly/rTmtUD7
simongerman600.bsky.social
In places like France and Italy, major pension reforms would be needed but political cowardice suggests these places rather ruin their economy instead of having difficult conversations.
simongerman600.bsky.social
I’m loving this view of the Baltics by @rhodesmaps. A nice way of showing how close St Petersburg is to the Baltic states.
simongerman600.bsky.social
Wow, this is the view on the Himalayas from Jainagar (India). The mountain chain is 150 km away and still beautifully visible - I’m sure this was a particularly clear day but it’s a truly wonderful sight. Source: buff.ly/aTj63aD
simongerman600.bsky.social
Usually I point out that most things get better over time. Some things get worse. Why for example are so many pedestrians killed by cars in the US? Source: buff.ly/lUV8IE1
simongerman600.bsky.social
I’ve shared the opposite of this visual before. It’s rather striking to see that civilization and urbanization can also move backwards.
simongerman600.bsky.social
A bit of linguistic cartography to brighten your day. This map shows how the words for camel 🐫 spread across the Old World.
simongerman600.bsky.social
Here is yet another world map without New Zealand - oh wait... @undertheraedar is just messing with us 😉 🗺️ #badgeographyjoke
simongerman600.bsky.social
Thank god, chocolate didn’t make the list…
simongerman600.bsky.social
What is the graphics department at the Wall Street Journal smoking?! An insane infographic 🤣🤣🤣 Needless to say I approve!
simongerman600.bsky.social
This map shows when the leaves change colour across Europe.
simongerman600.bsky.social
Animated map shows the global shipping routes in 1770. Trade was dominated by three European empires. HT Niloofar Joulaei