


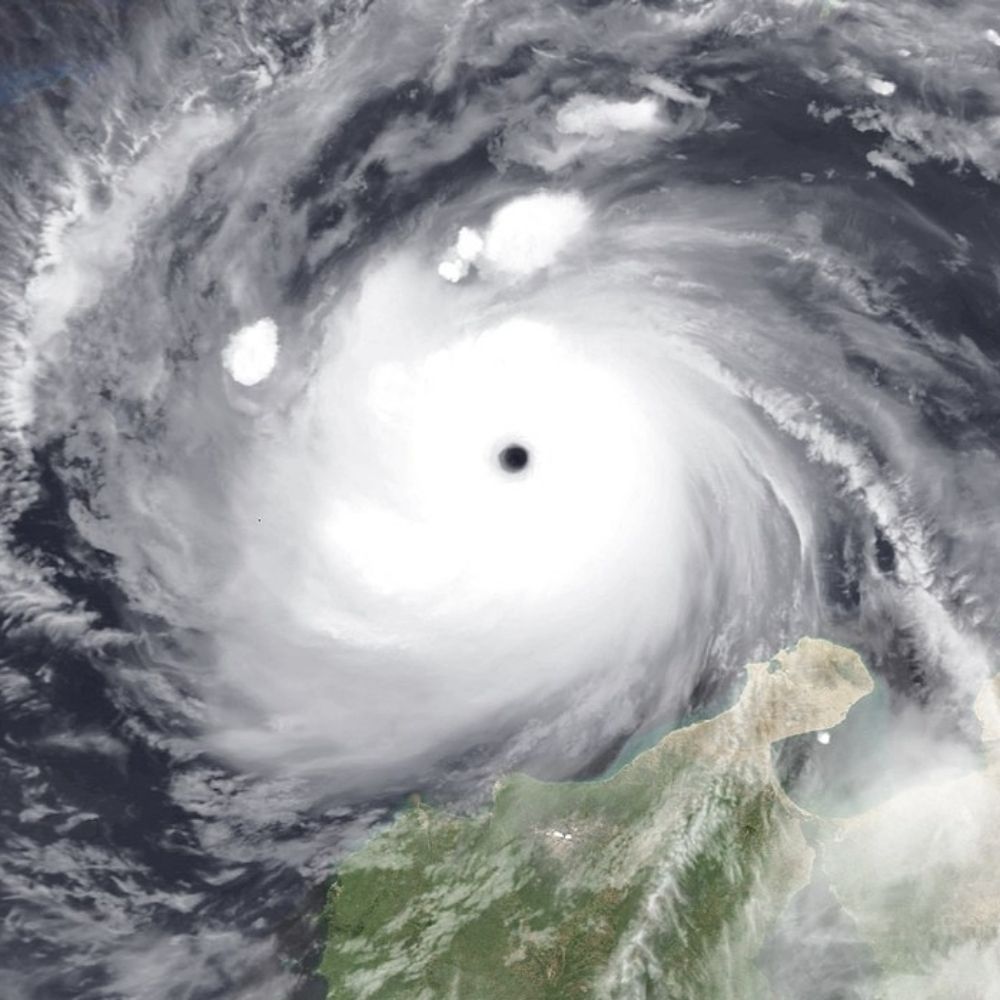
WOW! The latest SSMIS 183 Ghz microwave image of Fung-wong (Uwan) indicates a MW brightness temperatures of less then 110 Kelvin. Literally going off the scale. Just like with IR brightness temp, lower values mean more intense convection. Not sure if I have ever seen this before.

November 8, 2025 at 9:36 PM
WOW! The latest SSMIS 183 Ghz microwave image of Fung-wong (Uwan) indicates a MW brightness temperatures of less then 110 Kelvin. Literally going off the scale. Just like with IR brightness temp, lower values mean more intense convection. Not sure if I have ever seen this before.

Due to unstable access to #SSMIS data, we are suspending today the distribution of our #SeaIce concentration interim climate data record based on it (OSI-430-a).
We advise all users to switch to our #AMSR2 based climate products.
for more info: osi-saf.eumetsat.int/community/li...
We advise all users to switch to our #AMSR2 based climate products.
for more info: osi-saf.eumetsat.int/community/li...

October 17, 2025 at 12:34 PM
Due to unstable access to #SSMIS data, we are suspending today the distribution of our #SeaIce concentration interim climate data record based on it (OSI-430-a).
We advise all users to switch to our #AMSR2 based climate products.
for more info: osi-saf.eumetsat.int/community/li...
We advise all users to switch to our #AMSR2 based climate products.
for more info: osi-saf.eumetsat.int/community/li...

Technical data update - Due to the U.S. government shutdown, some climate data visualizations on my website may not be updated as usual. I’ll refresh them as soon as possible. Sorry, and thanks for your patience!
Image from nsidc.org/data/g10016/...
Image from nsidc.org/data/g10016/...

October 3, 2025 at 9:06 PM
Technical data update - Due to the U.S. government shutdown, some climate data visualizations on my website may not be updated as usual. I’ll refresh them as soon as possible. Sorry, and thanks for your patience!
Image from nsidc.org/data/g10016/...
Image from nsidc.org/data/g10016/...

Microwave imagery from the SSMIS shows deep convection wrapping around TS Gabrielle’s center, though the vortex still seems tilted toward the east. NOAA reconnaissance flights today will help to determine structure better.

September 20, 2025 at 1:34 PM
Microwave imagery from the SSMIS shows deep convection wrapping around TS Gabrielle’s center, though the vortex still seems tilted toward the east. NOAA reconnaissance flights today will help to determine structure better.

Thu February 1, 2024: 🇦🇶 Antarctica Today
Surface melt with a 1-day lag ❄️💦
📷s: Daily extent, sum, anomaly, & seasonal line plot.
Measurements derived from DMSP-F18 SSMIS. Images & post are auto-generated.
©2024 Dr. Mike MacFerrin, Univ. Colorado, and the National Snow & Ice Data Center (NSIDC)
🧪⚒️
Surface melt with a 1-day lag ❄️💦
📷s: Daily extent, sum, anomaly, & seasonal line plot.
Measurements derived from DMSP-F18 SSMIS. Images & post are auto-generated.
©2024 Dr. Mike MacFerrin, Univ. Colorado, and the National Snow & Ice Data Center (NSIDC)
🧪⚒️


February 2, 2024 at 5:41 PM
Thu February 1, 2024: 🇦🇶 Antarctica Today
Surface melt with a 1-day lag ❄️💦
📷s: Daily extent, sum, anomaly, & seasonal line plot.
Measurements derived from DMSP-F18 SSMIS. Images & post are auto-generated.
©2024 Dr. Mike MacFerrin, Univ. Colorado, and the National Snow & Ice Data Center (NSIDC)
🧪⚒️
Surface melt with a 1-day lag ❄️💦
📷s: Daily extent, sum, anomaly, & seasonal line plot.
Measurements derived from DMSP-F18 SSMIS. Images & post are auto-generated.
©2024 Dr. Mike MacFerrin, Univ. Colorado, and the National Snow & Ice Data Center (NSIDC)
🧪⚒️
*Note that there is currently an SSMIS outage, and my other plots using NSIDC data will therefore not be able to update at this time.
September 20, 2024 at 12:52 PM
*Note that there is currently an SSMIS outage, and my other plots using NSIDC data will therefore not be able to update at this time.
Sun February 25, 2024: 🇦🇶 Antarctica Today
Surface melt with a 1-day lag ❄️💦
📷s: Daily extent, sum, anomaly, & seasonal line plot.
Measurements derived from DMSP-F18 SSMIS. Images & post are auto-generated.
©2024 Dr. Mike MacFerrin, Univ. Colorado, and the National Snow & Ice Data Center (NSIDC)
🧪⚒️
Surface melt with a 1-day lag ❄️💦
📷s: Daily extent, sum, anomaly, & seasonal line plot.
Measurements derived from DMSP-F18 SSMIS. Images & post are auto-generated.
©2024 Dr. Mike MacFerrin, Univ. Colorado, and the National Snow & Ice Data Center (NSIDC)
🧪⚒️


February 26, 2024 at 9:26 PM
Sun February 25, 2024: 🇦🇶 Antarctica Today
Surface melt with a 1-day lag ❄️💦
📷s: Daily extent, sum, anomaly, & seasonal line plot.
Measurements derived from DMSP-F18 SSMIS. Images & post are auto-generated.
©2024 Dr. Mike MacFerrin, Univ. Colorado, and the National Snow & Ice Data Center (NSIDC)
🧪⚒️
Surface melt with a 1-day lag ❄️💦
📷s: Daily extent, sum, anomaly, & seasonal line plot.
Measurements derived from DMSP-F18 SSMIS. Images & post are auto-generated.
©2024 Dr. Mike MacFerrin, Univ. Colorado, and the National Snow & Ice Data Center (NSIDC)
🧪⚒️
Wed January 31, 2024: 🇦🇶 Antarctica Today
Surface melt with a 1-day lag ❄️💦
📷s: Daily extent, sum, anomaly, & seasonal line plot.
Measurements derived from DMSP-F18 SSMIS. Images & post are auto-generated.
©2024 Dr. Mike MacFerrin, Univ. Colorado, and the National Snow & Ice Data Center (NSIDC)
🧪⚒️
Surface melt with a 1-day lag ❄️💦
📷s: Daily extent, sum, anomaly, & seasonal line plot.
Measurements derived from DMSP-F18 SSMIS. Images & post are auto-generated.
©2024 Dr. Mike MacFerrin, Univ. Colorado, and the National Snow & Ice Data Center (NSIDC)
🧪⚒️


February 1, 2024 at 4:26 PM
Wed January 31, 2024: 🇦🇶 Antarctica Today
Surface melt with a 1-day lag ❄️💦
📷s: Daily extent, sum, anomaly, & seasonal line plot.
Measurements derived from DMSP-F18 SSMIS. Images & post are auto-generated.
©2024 Dr. Mike MacFerrin, Univ. Colorado, and the National Snow & Ice Data Center (NSIDC)
🧪⚒️
Surface melt with a 1-day lag ❄️💦
📷s: Daily extent, sum, anomaly, & seasonal line plot.
Measurements derived from DMSP-F18 SSMIS. Images & post are auto-generated.
©2024 Dr. Mike MacFerrin, Univ. Colorado, and the National Snow & Ice Data Center (NSIDC)
🧪⚒️

The SSMIS instruments are part of three weather satellites in low-Earth orbit and are maintained by NOAA in cooperation with the United States Department of Defense. abcnews.go.com/US/hurricane...

Hurricane season is here and meteorologists are losing a vital tool for forecasting them
Meteorologists are losing a sophisticated tool that has proved invaluable when monitoring and forecasting hurricanes.
abcnews.go.com
June 29, 2025 at 5:32 PM
The SSMIS instruments are part of three weather satellites in low-Earth orbit and are maintained by NOAA in cooperation with the United States Department of Defense. abcnews.go.com/US/hurricane...

So, so bad. The most impactful loss of a forecast tool so far. Losing SSMIS, we won't have a good way of knowing if a hurricane's structure is changing to indicate rapid intensification overnight. It'll also degrade forecast skill for all weather because SSMIS data is a key input to computer models.

A huge blow was dealt to hurricane forecasters this week as a critical tool was abruptly terminated by the Department of Defense and NOAA. The immediate discontinuation of data from three weather satellites will severely impact hurricane forecasts this season and beyond. More ⬇️
Critical Hurricane Forecast Tool Abruptly Terminated
U.S. Department of Defense announced Tuesday it would no longer process and deliver data essential to most hurricane forecasts
michaelrlowry.substack.com
June 27, 2025 at 4:01 PM
So, so bad. The most impactful loss of a forecast tool so far. Losing SSMIS, we won't have a good way of knowing if a hurricane's structure is changing to indicate rapid intensification overnight. It'll also degrade forecast skill for all weather because SSMIS data is a key input to computer models.
Mon January 1, 2024: 🇦🇶 Antarctica Today
Surface melt with a 1-day lag ❄️💦
📷s: Daily extent, sum, anomaly, & seasonal line plot.
Measurements derived from DMSP-F18 SSMIS. Images & post are auto-generated.
©2024 Dr. Mike MacFerrin, Univ. Colorado, and the National Snow & Ice Data Center (NSIDC)
🧪⚒️
Surface melt with a 1-day lag ❄️💦
📷s: Daily extent, sum, anomaly, & seasonal line plot.
Measurements derived from DMSP-F18 SSMIS. Images & post are auto-generated.
©2024 Dr. Mike MacFerrin, Univ. Colorado, and the National Snow & Ice Data Center (NSIDC)
🧪⚒️


January 2, 2024 at 2:35 PM
Mon January 1, 2024: 🇦🇶 Antarctica Today
Surface melt with a 1-day lag ❄️💦
📷s: Daily extent, sum, anomaly, & seasonal line plot.
Measurements derived from DMSP-F18 SSMIS. Images & post are auto-generated.
©2024 Dr. Mike MacFerrin, Univ. Colorado, and the National Snow & Ice Data Center (NSIDC)
🧪⚒️
Surface melt with a 1-day lag ❄️💦
📷s: Daily extent, sum, anomaly, & seasonal line plot.
Measurements derived from DMSP-F18 SSMIS. Images & post are auto-generated.
©2024 Dr. Mike MacFerrin, Univ. Colorado, and the National Snow & Ice Data Center (NSIDC)
🧪⚒️
Sun March 17, 2024: 🇦🇶 Antarctica Today
Surface melt with a 1-day lag ❄️💦
📷s: Daily extent, sum, anomaly, & seasonal line plot.
Measurements derived from DMSP-F18 SSMIS. Images & post are auto-generated.
©2024 Dr. Mike MacFerrin, Univ. Colorado, and the National Snow & Ice Data Center (NSIDC)
🧪⚒️
Surface melt with a 1-day lag ❄️💦
📷s: Daily extent, sum, anomaly, & seasonal line plot.
Measurements derived from DMSP-F18 SSMIS. Images & post are auto-generated.
©2024 Dr. Mike MacFerrin, Univ. Colorado, and the National Snow & Ice Data Center (NSIDC)
🧪⚒️


March 18, 2024 at 2:32 PM
Sun March 17, 2024: 🇦🇶 Antarctica Today
Surface melt with a 1-day lag ❄️💦
📷s: Daily extent, sum, anomaly, & seasonal line plot.
Measurements derived from DMSP-F18 SSMIS. Images & post are auto-generated.
©2024 Dr. Mike MacFerrin, Univ. Colorado, and the National Snow & Ice Data Center (NSIDC)
🧪⚒️
Surface melt with a 1-day lag ❄️💦
📷s: Daily extent, sum, anomaly, & seasonal line plot.
Measurements derived from DMSP-F18 SSMIS. Images & post are auto-generated.
©2024 Dr. Mike MacFerrin, Univ. Colorado, and the National Snow & Ice Data Center (NSIDC)
🧪⚒️
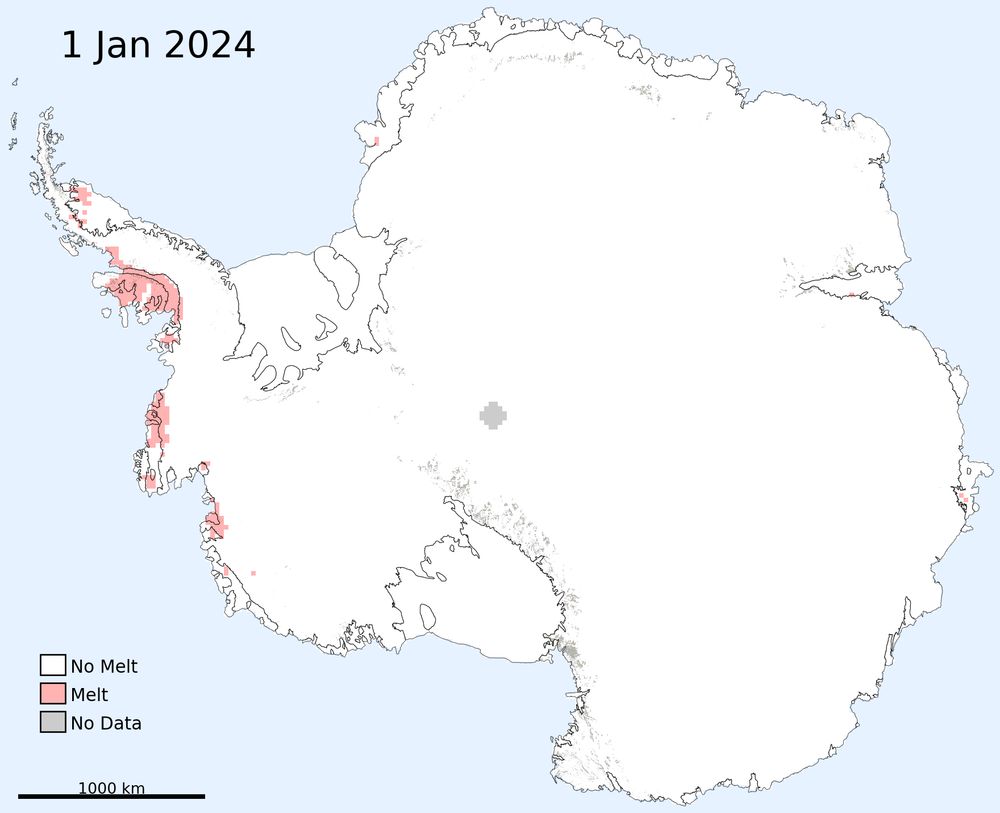
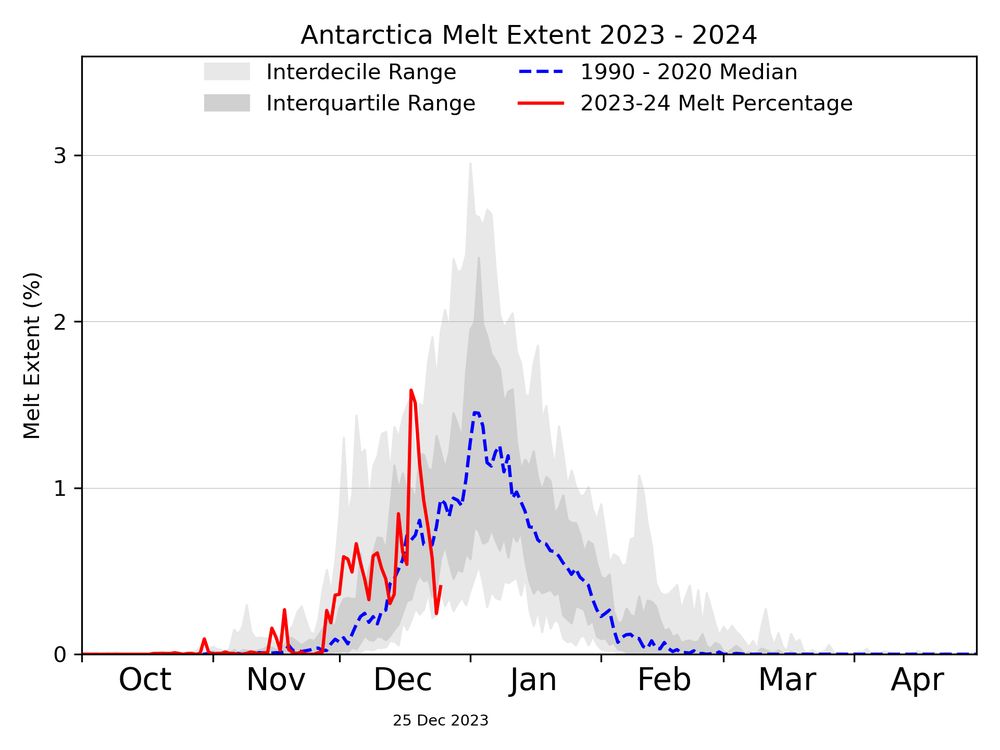
Mon December 25, 2023: 🇦🇶 Antarctica Today
Surface melt with a 1-day lag ❄️💦
📷s: Daily extent, sum, anomaly, & seasonal line plot.
Measurements derived from DMSP-F18 SSMIS. Images & post are auto-generated.
©2023 Dr. Mike MacFerrin, Univ. Colorado, and the National Snow & Ice Data Center (NSIDC)
🧪⚒️
Surface melt with a 1-day lag ❄️💦
📷s: Daily extent, sum, anomaly, & seasonal line plot.
Measurements derived from DMSP-F18 SSMIS. Images & post are auto-generated.
©2023 Dr. Mike MacFerrin, Univ. Colorado, and the National Snow & Ice Data Center (NSIDC)
🧪⚒️


December 26, 2023 at 2:35 PM
Mon December 25, 2023: 🇦🇶 Antarctica Today
Surface melt with a 1-day lag ❄️💦
📷s: Daily extent, sum, anomaly, & seasonal line plot.
Measurements derived from DMSP-F18 SSMIS. Images & post are auto-generated.
©2023 Dr. Mike MacFerrin, Univ. Colorado, and the National Snow & Ice Data Center (NSIDC)
🧪⚒️
Surface melt with a 1-day lag ❄️💦
📷s: Daily extent, sum, anomaly, & seasonal line plot.
Measurements derived from DMSP-F18 SSMIS. Images & post are auto-generated.
©2023 Dr. Mike MacFerrin, Univ. Colorado, and the National Snow & Ice Data Center (NSIDC)
🧪⚒️

arXiv:2505.16625v1 Announce Type: new
Abstract: Semi-supervised medical image segmentation (SSMIS) leverages unlabeled data to reduce reliance on manually annotated images. However, current SOTA approaches predominantly focus on foreground-oriented [1/6 of https://arxiv.org/abs/2505.16625v1]
Abstract: Semi-supervised medical image segmentation (SSMIS) leverages unlabeled data to reduce reliance on manually annotated images. However, current SOTA approaches predominantly focus on foreground-oriented [1/6 of https://arxiv.org/abs/2505.16625v1]
May 23, 2025 at 6:12 AM
arXiv:2505.16625v1 Announce Type: new
Abstract: Semi-supervised medical image segmentation (SSMIS) leverages unlabeled data to reduce reliance on manually annotated images. However, current SOTA approaches predominantly focus on foreground-oriented [1/6 of https://arxiv.org/abs/2505.16625v1]
Abstract: Semi-supervised medical image segmentation (SSMIS) leverages unlabeled data to reduce reliance on manually annotated images. However, current SOTA approaches predominantly focus on foreground-oriented [1/6 of https://arxiv.org/abs/2505.16625v1]
Sunrise over Hurricane Kirk reveals a storm that is continuing to steadily organise and is now featuring a well defined spiral band wrapping into a circular CDO. Cirrus continues to fan out agressively on the west and north side. MW images from this morning show core formation well underway.


October 2, 2024 at 1:42 PM
Sunrise over Hurricane Kirk reveals a storm that is continuing to steadily organise and is now featuring a well defined spiral band wrapping into a circular CDO. Cirrus continues to fan out agressively on the west and north side. MW images from this morning show core formation well underway.
Sun April 7, 2024: 🇦🇶 Antarctica Today
Surface melt with a 1-day lag ❄️💦
📷s: Daily extent, sum, anomaly, & seasonal line plot.
Measurements derived from DMSP-F18 SSMIS. Images & post are auto-generated.
©2024 Dr. Mike MacFerrin, Univ. Colorado, and the National Snow & Ice Data Center (NSIDC)
🧪⚒️
Surface melt with a 1-day lag ❄️💦
📷s: Daily extent, sum, anomaly, & seasonal line plot.
Measurements derived from DMSP-F18 SSMIS. Images & post are auto-generated.
©2024 Dr. Mike MacFerrin, Univ. Colorado, and the National Snow & Ice Data Center (NSIDC)
🧪⚒️


April 8, 2024 at 12:14 PM
Sun April 7, 2024: 🇦🇶 Antarctica Today
Surface melt with a 1-day lag ❄️💦
📷s: Daily extent, sum, anomaly, & seasonal line plot.
Measurements derived from DMSP-F18 SSMIS. Images & post are auto-generated.
©2024 Dr. Mike MacFerrin, Univ. Colorado, and the National Snow & Ice Data Center (NSIDC)
🧪⚒️
Surface melt with a 1-day lag ❄️💦
📷s: Daily extent, sum, anomaly, & seasonal line plot.
Measurements derived from DMSP-F18 SSMIS. Images & post are auto-generated.
©2024 Dr. Mike MacFerrin, Univ. Colorado, and the National Snow & Ice Data Center (NSIDC)
🧪⚒️

DoD has stopped transmitting real-time microwave data from 3 weather satellites critical to hurricane forecasting. The data feed will officially cease by Monday, June 30.
The impact extends beyond hurricanes and tropical storms. SSMIS data also supports polar climate monitoring.
The impact extends beyond hurricanes and tropical storms. SSMIS data also supports polar climate monitoring.

June 28, 2025 at 2:47 PM
DoD has stopped transmitting real-time microwave data from 3 weather satellites critical to hurricane forecasting. The data feed will officially cease by Monday, June 30.
The impact extends beyond hurricanes and tropical storms. SSMIS data also supports polar climate monitoring.
The impact extends beyond hurricanes and tropical storms. SSMIS data also supports polar climate monitoring.

Check out this article in AP on the Trump admin permanently shutting down SSMIS, which provides essential data for hurricane forecasters.
‘“What happened this week is another attempt by the Trump administration to sabotage our weather and climate infrastructure,” Alessi said.’
‘“What happened this week is another attempt by the Trump administration to sabotage our weather and climate infrastructure,” Alessi said.’

The government cuts key data used in hurricane forecasting, and experts sound an alarm
Weather experts are warning that hurricane forecasts will be severely hampered by the upcoming cutoff of key data from U.S. Department of Defense satellites.
apnews.com
June 27, 2025 at 9:10 PM
Check out this article in AP on the Trump admin permanently shutting down SSMIS, which provides essential data for hurricane forecasters.
‘“What happened this week is another attempt by the Trump administration to sabotage our weather and climate infrastructure,” Alessi said.’
‘“What happened this week is another attempt by the Trump administration to sabotage our weather and climate infrastructure,” Alessi said.’

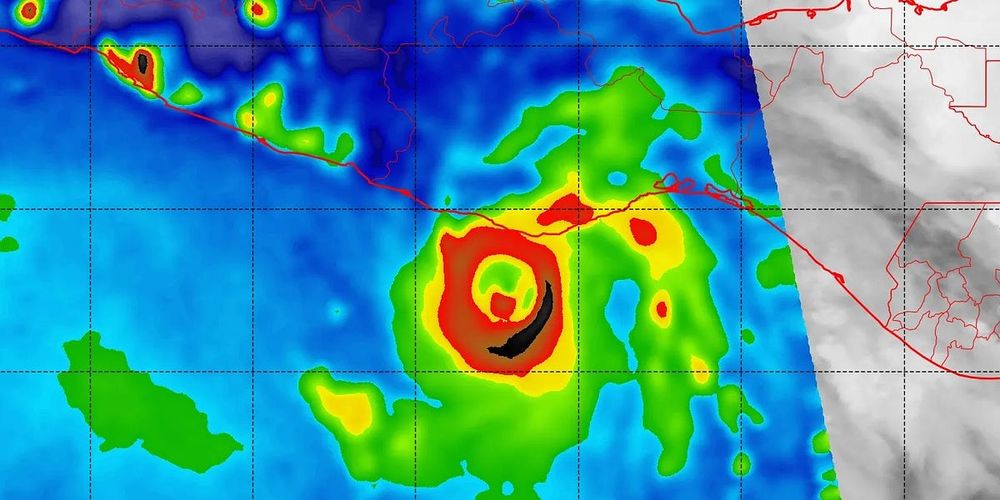
Dangerous situation imminent in #CostaRica & #Nicaragua as #Otto rapidly intensifies. Impressive SSMIS #microwave w/ potent #eyewall.

December 1, 2024 at 7:14 PM
Dangerous situation imminent in #CostaRica & #Nicaragua as #Otto rapidly intensifies. Impressive SSMIS #microwave w/ potent #eyewall.
📣 Note - Are you using sea-ice concentration climate data from OSI SAF,
please be aware
that an AMSR-2-based product is now being released
to replace the SSMIS-based product (soon end-of-life) 👉
please be aware
that an AMSR-2-based product is now being released
to replace the SSMIS-based product (soon end-of-life) 👉
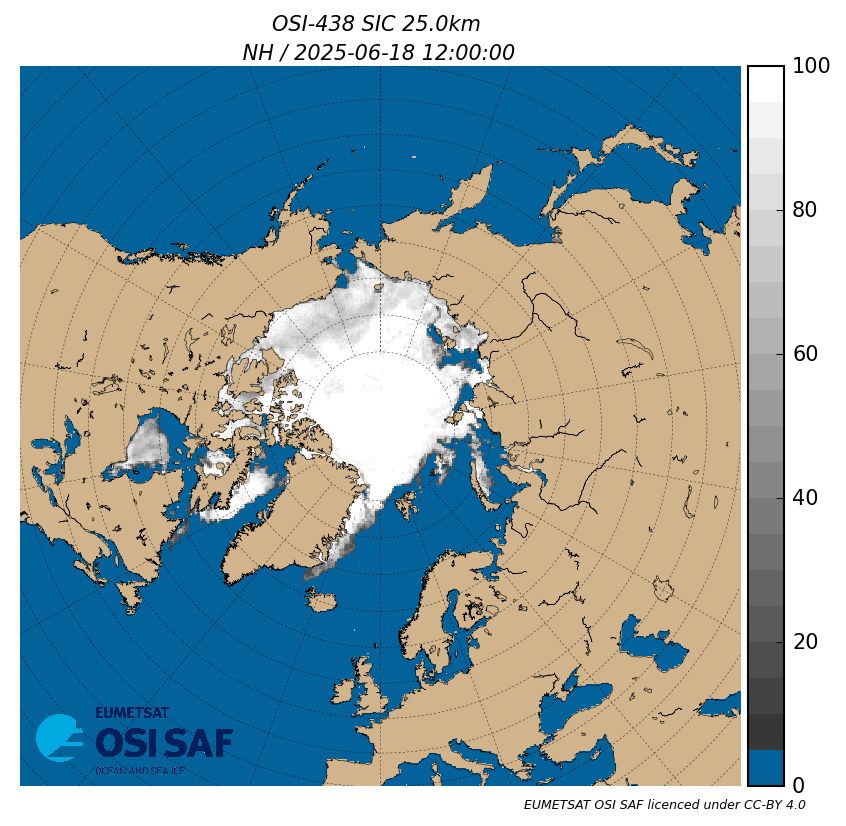
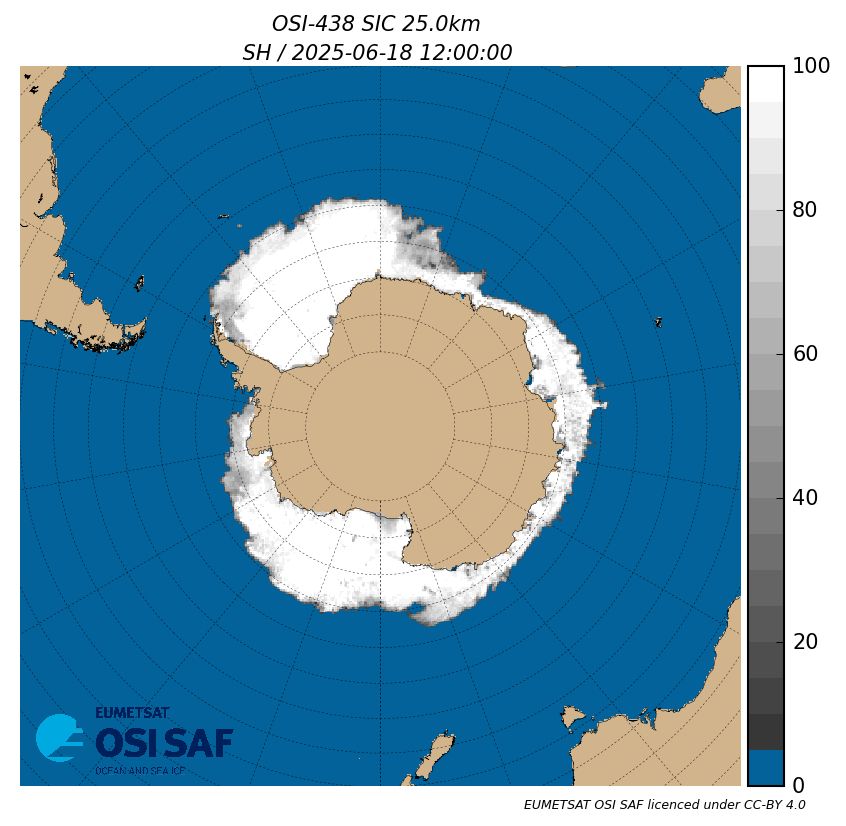
🛰️New Product ! 🛰️
Our #SeaIce team at @met.no and @dmidk.bsky.social
has been working hard to ensure you reliable and lasting access to sea ice concentration Climate Data Record.
Today we release as demonstrational a new #AMSR-2 based Interim CDR (OSI-438)
osi-saf.eumetsat.int/community/li...
Our #SeaIce team at @met.no and @dmidk.bsky.social
has been working hard to ensure you reliable and lasting access to sea ice concentration Climate Data Record.
Today we release as demonstrational a new #AMSR-2 based Interim CDR (OSI-438)
osi-saf.eumetsat.int/community/li...
July 4, 2025 at 3:21 PM
📣 Note - Are you using sea-ice concentration climate data from OSI SAF,
please be aware
that an AMSR-2-based product is now being released
to replace the SSMIS-based product (soon end-of-life) 👉
please be aware
that an AMSR-2-based product is now being released
to replace the SSMIS-based product (soon end-of-life) 👉
Sun January 7, 2024: 🇦🇶 Antarctica Today
Surface melt with a 1-day lag ❄️💦
📷s: Daily extent, sum, anomaly, & seasonal line plot.
Measurements derived from DMSP-F18 SSMIS. Images & post are auto-generated.
©2024 Dr. Mike MacFerrin, Univ. Colorado, and the National Snow & Ice Data Center (NSIDC)
🧪⚒️
Surface melt with a 1-day lag ❄️💦
📷s: Daily extent, sum, anomaly, & seasonal line plot.
Measurements derived from DMSP-F18 SSMIS. Images & post are auto-generated.
©2024 Dr. Mike MacFerrin, Univ. Colorado, and the National Snow & Ice Data Center (NSIDC)
🧪⚒️


January 8, 2024 at 2:35 PM
Sun January 7, 2024: 🇦🇶 Antarctica Today
Surface melt with a 1-day lag ❄️💦
📷s: Daily extent, sum, anomaly, & seasonal line plot.
Measurements derived from DMSP-F18 SSMIS. Images & post are auto-generated.
©2024 Dr. Mike MacFerrin, Univ. Colorado, and the National Snow & Ice Data Center (NSIDC)
🧪⚒️
Surface melt with a 1-day lag ❄️💦
📷s: Daily extent, sum, anomaly, & seasonal line plot.
Measurements derived from DMSP-F18 SSMIS. Images & post are auto-generated.
©2024 Dr. Mike MacFerrin, Univ. Colorado, and the National Snow & Ice Data Center (NSIDC)
🧪⚒️

Prime example from this morning's NHC discussion on Flossie of the utility of SSMIS microwave data in the forecast process, enabled better intensity estimate. This is what is in danger of being lost if and when that data goes away as discussed here.
balancedweather.substack.com/p/updates-re...
balancedweather.substack.com/p/updates-re...

July 1, 2025 at 7:50 PM
Prime example from this morning's NHC discussion on Flossie of the utility of SSMIS microwave data in the forecast process, enabled better intensity estimate. This is what is in danger of being lost if and when that data goes away as discussed here.
balancedweather.substack.com/p/updates-re...
balancedweather.substack.com/p/updates-re...
Mon March 18, 2024: 🇦🇶 Antarctica Today
Surface melt with a 1-day lag ❄️💦
📷s: Daily extent, sum, anomaly, & seasonal line plot.
Measurements derived from DMSP-F18 SSMIS. Images & post are auto-generated.
©2024 Dr. Mike MacFerrin, Univ. Colorado, and the National Snow & Ice Data Center (NSIDC)
🧪⚒️
Surface melt with a 1-day lag ❄️💦
📷s: Daily extent, sum, anomaly, & seasonal line plot.
Measurements derived from DMSP-F18 SSMIS. Images & post are auto-generated.
©2024 Dr. Mike MacFerrin, Univ. Colorado, and the National Snow & Ice Data Center (NSIDC)
🧪⚒️


March 19, 2024 at 2:55 PM
Mon March 18, 2024: 🇦🇶 Antarctica Today
Surface melt with a 1-day lag ❄️💦
📷s: Daily extent, sum, anomaly, & seasonal line plot.
Measurements derived from DMSP-F18 SSMIS. Images & post are auto-generated.
©2024 Dr. Mike MacFerrin, Univ. Colorado, and the National Snow & Ice Data Center (NSIDC)
🧪⚒️
Surface melt with a 1-day lag ❄️💦
📷s: Daily extent, sum, anomaly, & seasonal line plot.
Measurements derived from DMSP-F18 SSMIS. Images & post are auto-generated.
©2024 Dr. Mike MacFerrin, Univ. Colorado, and the National Snow & Ice Data Center (NSIDC)
🧪⚒️
Mon February 5, 2024: 🇦🇶 Antarctica Today
Surface melt with a 1-day lag ❄️💦
📷s: Daily extent, sum, anomaly, & seasonal line plot.
Measurements derived from DMSP-F18 SSMIS. Images & post are auto-generated.
©2024 Dr. Mike MacFerrin, Univ. Colorado, and the National Snow & Ice Data Center (NSIDC)
🧪⚒️
Surface melt with a 1-day lag ❄️💦
📷s: Daily extent, sum, anomaly, & seasonal line plot.
Measurements derived from DMSP-F18 SSMIS. Images & post are auto-generated.
©2024 Dr. Mike MacFerrin, Univ. Colorado, and the National Snow & Ice Data Center (NSIDC)
🧪⚒️


February 6, 2024 at 2:37 PM
Mon February 5, 2024: 🇦🇶 Antarctica Today
Surface melt with a 1-day lag ❄️💦
📷s: Daily extent, sum, anomaly, & seasonal line plot.
Measurements derived from DMSP-F18 SSMIS. Images & post are auto-generated.
©2024 Dr. Mike MacFerrin, Univ. Colorado, and the National Snow & Ice Data Center (NSIDC)
🧪⚒️
Surface melt with a 1-day lag ❄️💦
📷s: Daily extent, sum, anomaly, & seasonal line plot.
Measurements derived from DMSP-F18 SSMIS. Images & post are auto-generated.
©2024 Dr. Mike MacFerrin, Univ. Colorado, and the National Snow & Ice Data Center (NSIDC)
🧪⚒️
Fri March 29, 2024: 🇦🇶 Antarctica Today
Surface melt with a 1-day lag ❄️💦
📷s: Daily extent, sum, anomaly, & seasonal line plot.
Measurements derived from DMSP-F18 SSMIS. Images & post are auto-generated.
©2024 Dr. Mike MacFerrin, Univ. Colorado, and the National Snow & Ice Data Center (NSIDC)
🧪⚒️
Surface melt with a 1-day lag ❄️💦
📷s: Daily extent, sum, anomaly, & seasonal line plot.
Measurements derived from DMSP-F18 SSMIS. Images & post are auto-generated.
©2024 Dr. Mike MacFerrin, Univ. Colorado, and the National Snow & Ice Data Center (NSIDC)
🧪⚒️


March 30, 2024 at 3:15 PM
Fri March 29, 2024: 🇦🇶 Antarctica Today
Surface melt with a 1-day lag ❄️💦
📷s: Daily extent, sum, anomaly, & seasonal line plot.
Measurements derived from DMSP-F18 SSMIS. Images & post are auto-generated.
©2024 Dr. Mike MacFerrin, Univ. Colorado, and the National Snow & Ice Data Center (NSIDC)
🧪⚒️
Surface melt with a 1-day lag ❄️💦
📷s: Daily extent, sum, anomaly, & seasonal line plot.
Measurements derived from DMSP-F18 SSMIS. Images & post are auto-generated.
©2024 Dr. Mike MacFerrin, Univ. Colorado, and the National Snow & Ice Data Center (NSIDC)
🧪⚒️