


Moritz Zackariat
@zackouvakis.bsky.social
Energy transition and power markets | @agoraew.bsky.social
Passion for data and viz| private acc
Passion for data and viz| private acc
Reposted by Moritz Zackariat

We're entering the next energy revolution.
Battery storage deployment has taken off in the last few years. 2024 saw 69 GW installed globally, nearly doubling the previous total installed capacity of 86 GW 🔋⚡
It's a classic technology transition: Prices go down → adoption skyrockets
Battery storage deployment has taken off in the last few years. 2024 saw 69 GW installed globally, nearly doubling the previous total installed capacity of 86 GW 🔋⚡
It's a classic technology transition: Prices go down → adoption skyrockets

April 14, 2025 at 11:00 AM
We're entering the next energy revolution.
Battery storage deployment has taken off in the last few years. 2024 saw 69 GW installed globally, nearly doubling the previous total installed capacity of 86 GW 🔋⚡
It's a classic technology transition: Prices go down → adoption skyrockets
Battery storage deployment has taken off in the last few years. 2024 saw 69 GW installed globally, nearly doubling the previous total installed capacity of 86 GW 🔋⚡
It's a classic technology transition: Prices go down → adoption skyrockets
Reposted by Moritz Zackariat


Reposted by Moritz Zackariat


Reposted by Moritz Zackariat

How many hours in the year different technologies produce electricity at their maximum capacity differs widely depending mainly on electricity markets & the weather.
Here's the data for the US. One dot I believe represents one facility & its capacity factor in 2023.
Great visual by Aaron Foyer.
Here's the data for the US. One dot I believe represents one facility & its capacity factor in 2023.
Great visual by Aaron Foyer.

February 24, 2025 at 9:04 AM
How many hours in the year different technologies produce electricity at their maximum capacity differs widely depending mainly on electricity markets & the weather.
Here's the data for the US. One dot I believe represents one facility & its capacity factor in 2023.
Great visual by Aaron Foyer.
Here's the data for the US. One dot I believe represents one facility & its capacity factor in 2023.
Great visual by Aaron Foyer.
Wir haben ein Konzept zur Weiterentwicklung der Erneuerbaren-Förderung entwickelt: den „marktöffnenden CfD“. Er vereint die Vorteile staatlich abgesicherter CfDs mit den Vorteilen marktorientierter PPAs für einen effizienten EE-Ausbau.
Link zur Studie: www.agora-energiewende.de/fileadmin/Pr...
Link zur Studie: www.agora-energiewende.de/fileadmin/Pr...

February 20, 2025 at 1:44 PM
Wir haben ein Konzept zur Weiterentwicklung der Erneuerbaren-Förderung entwickelt: den „marktöffnenden CfD“. Er vereint die Vorteile staatlich abgesicherter CfDs mit den Vorteilen marktorientierter PPAs für einen effizienten EE-Ausbau.
Link zur Studie: www.agora-energiewende.de/fileadmin/Pr...
Link zur Studie: www.agora-energiewende.de/fileadmin/Pr...
Reposted by Moritz Zackariat

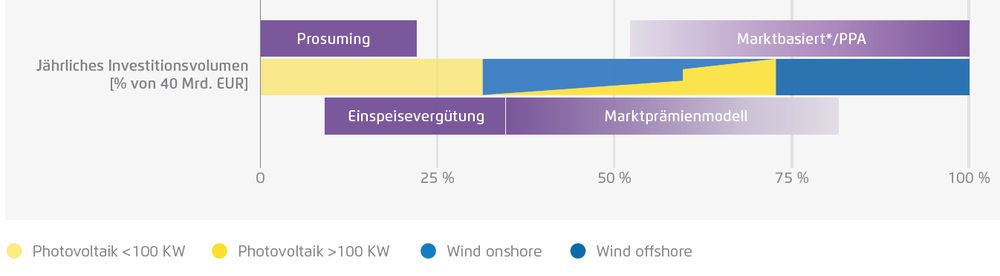
Finanzieung der Energiewende: Wie viele Investitionen in Wind und Solar werden - Stand heute - über welchen Mechanismus finanziert? Prosuming aka Eigenverbrauch machen ein Drittel der Invest von rund 40 Mrd p.a. aus. Ungefähr gleichviel: Marktbasiert (offshore, PV-Freifläche).
February 13, 2025 at 11:56 AM
Finanzieung der Energiewende: Wie viele Investitionen in Wind und Solar werden - Stand heute - über welchen Mechanismus finanziert? Prosuming aka Eigenverbrauch machen ein Drittel der Invest von rund 40 Mrd p.a. aus. Ungefähr gleichviel: Marktbasiert (offshore, PV-Freifläche).
Reposted by Moritz Zackariat

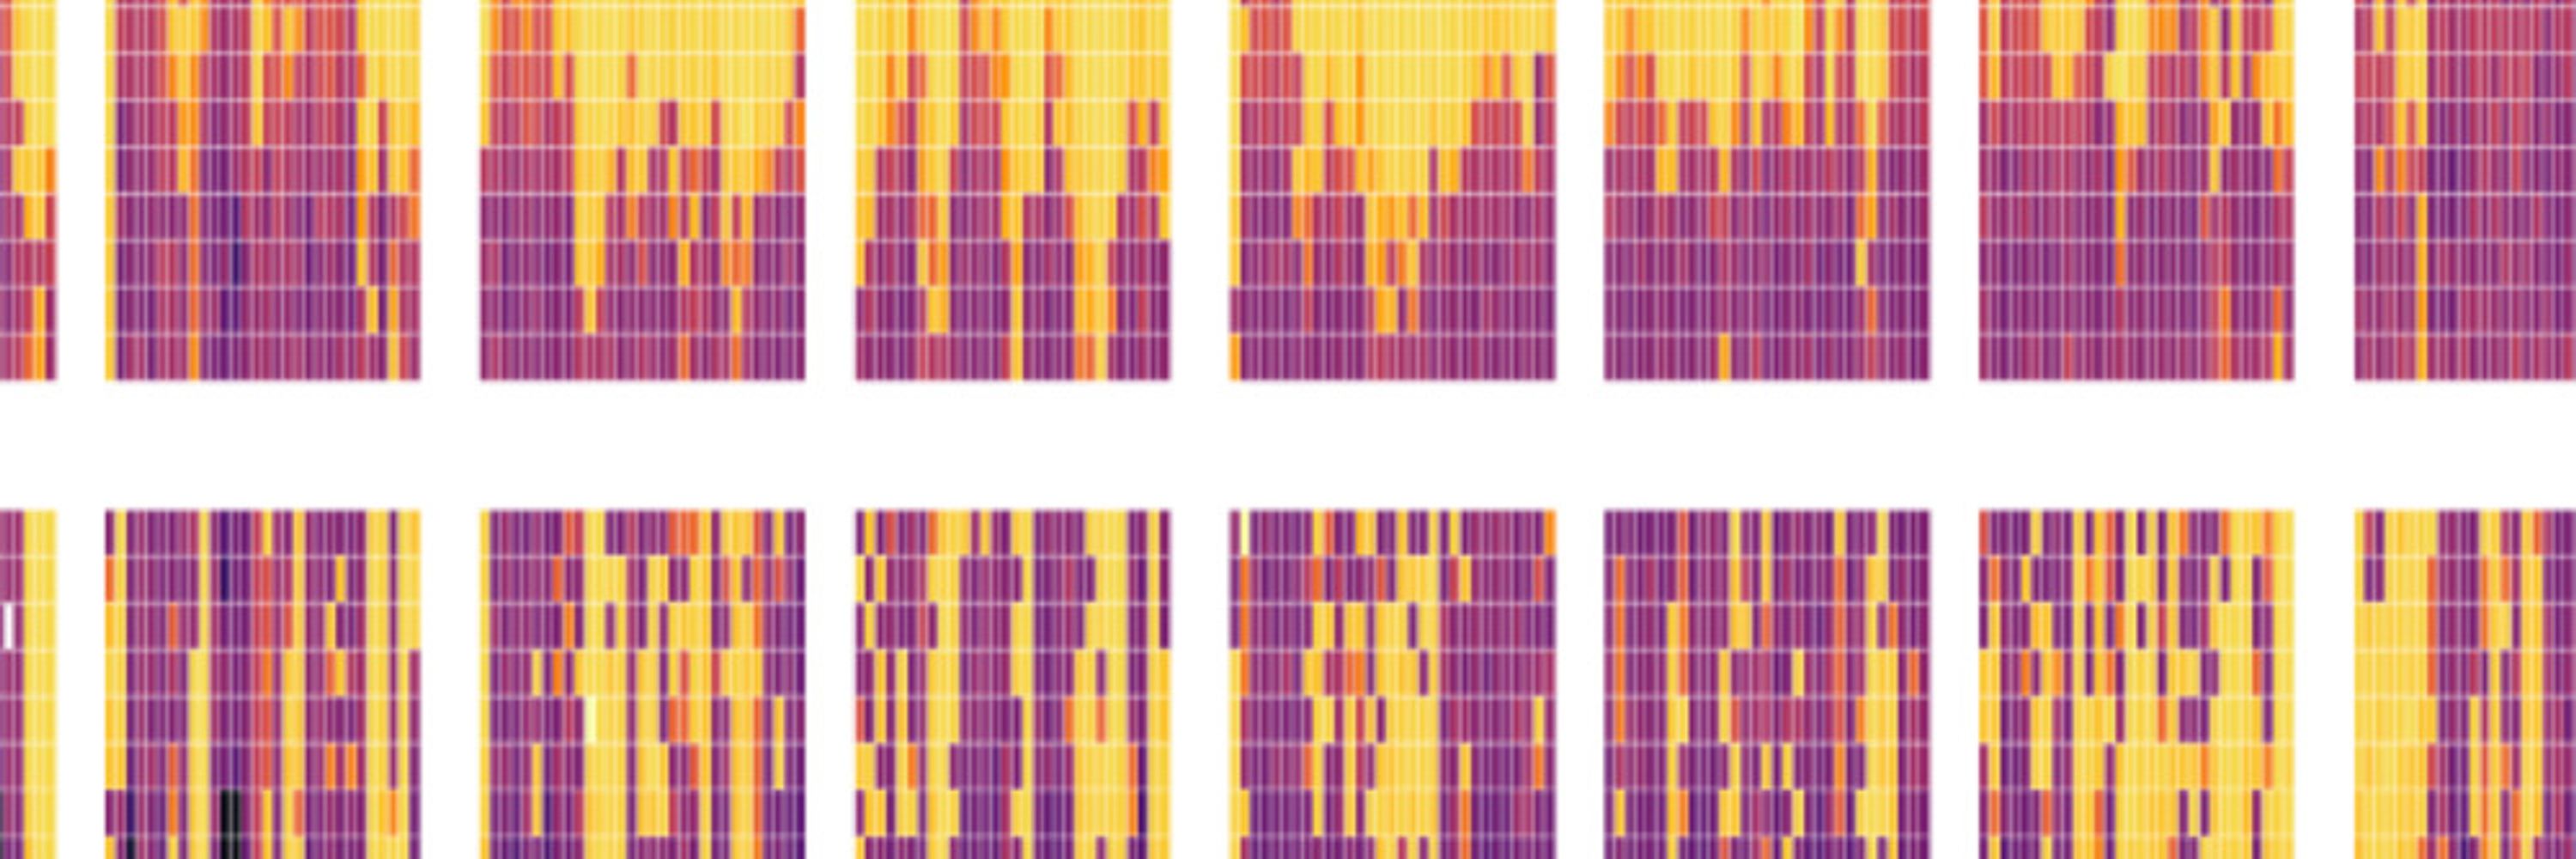
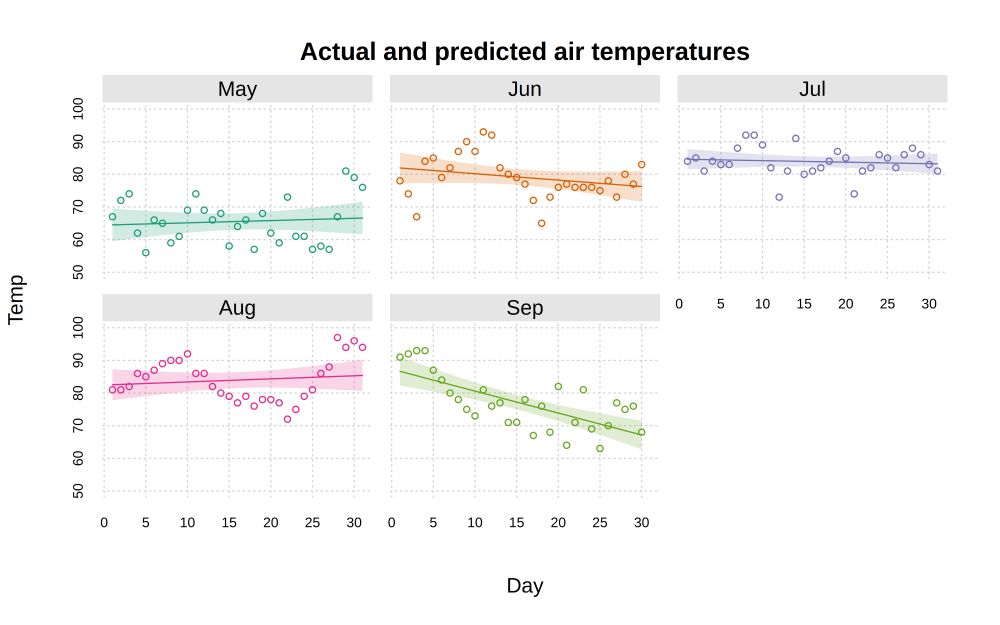
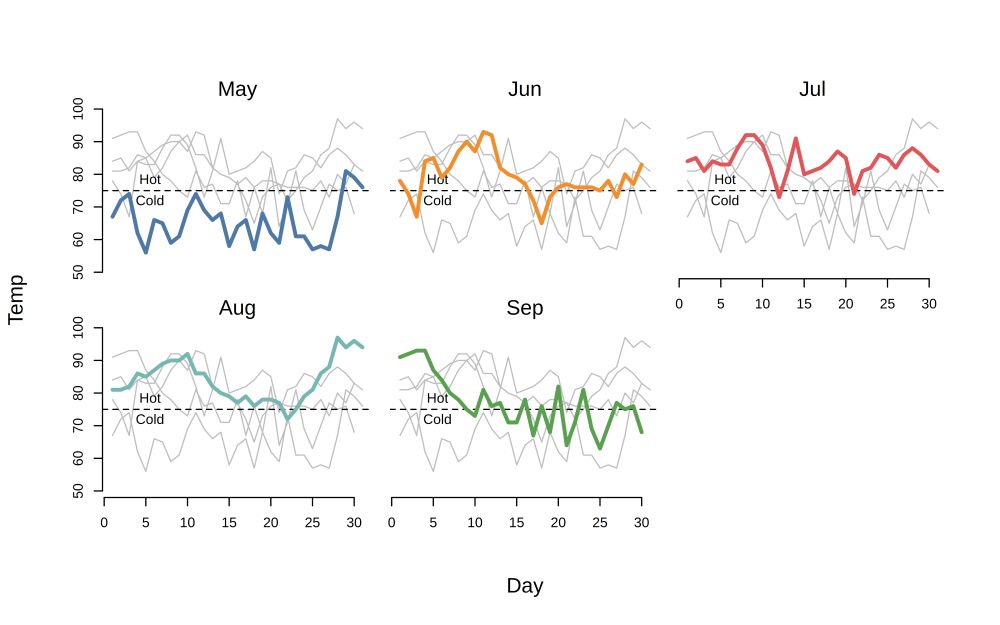
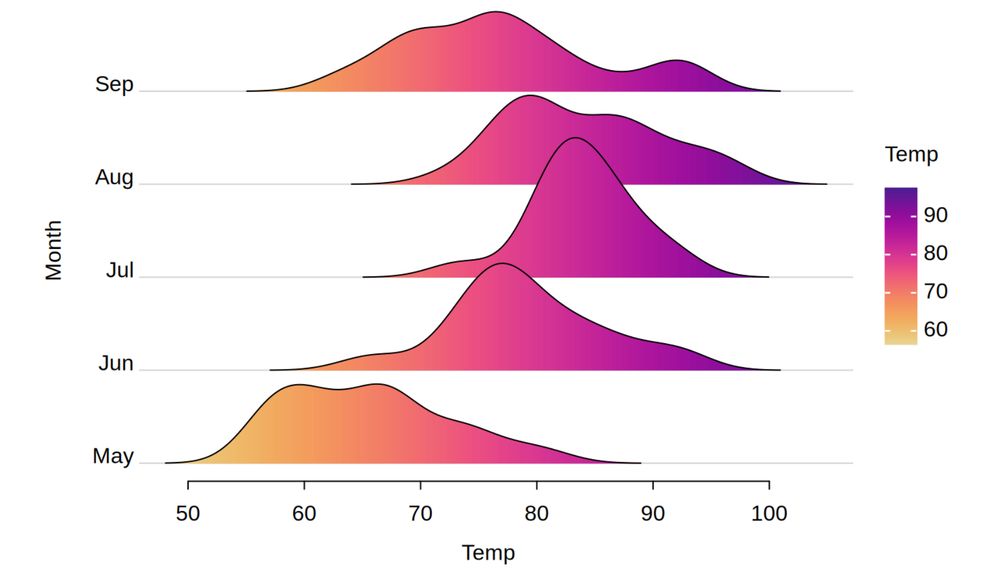
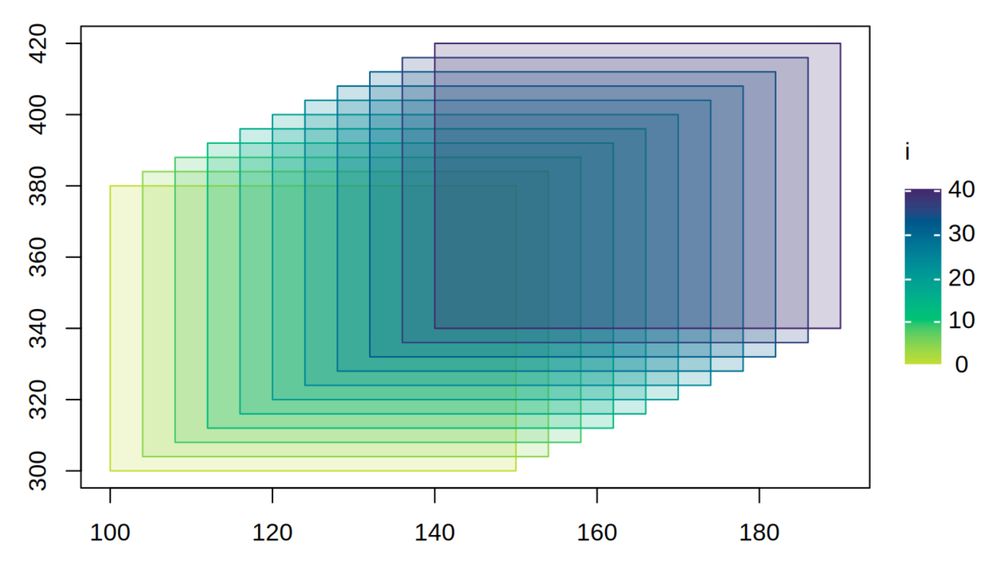
{tinyplot} 0.3.0 is out! 🚨
It's a lightweight #Rstats 📦 to draw beautiful and complex plots, using an ultra-simple and concise syntax.
This is a massive release! @gmcd.bsky.social @zeileis.org and I worked hard to add tons of new themes and plot types.
Check it out!
grantmcdermott.com/tinyplot/
It's a lightweight #Rstats 📦 to draw beautiful and complex plots, using an ultra-simple and concise syntax.
This is a massive release! @gmcd.bsky.social @zeileis.org and I worked hard to add tons of new themes and plot types.
Check it out!
grantmcdermott.com/tinyplot/
February 5, 2025 at 9:48 PM
{tinyplot} 0.3.0 is out! 🚨
It's a lightweight #Rstats 📦 to draw beautiful and complex plots, using an ultra-simple and concise syntax.
This is a massive release! @gmcd.bsky.social @zeileis.org and I worked hard to add tons of new themes and plot types.
Check it out!
grantmcdermott.com/tinyplot/
It's a lightweight #Rstats 📦 to draw beautiful and complex plots, using an ultra-simple and concise syntax.
This is a massive release! @gmcd.bsky.social @zeileis.org and I worked hard to add tons of new themes and plot types.
Check it out!
grantmcdermott.com/tinyplot/
Reposted by Moritz Zackariat

Aus unseren Modellrechnungen kann man (c.p.) folgende Formel ableiten: pro 10 GW mehr Windkraft (Onshore) liegen die Großhandelspreise in Deutschland rund 5 EUR/MWh niedriger. Beispiel: 4 Jahre Zubau mit jährlich 10 GW, statt 5 GW jährlich -> senkt den Strompreis um 10 EUR/MWh bzw. 1 Cent/kWh. (5/5)
February 4, 2025 at 3:12 PM
Aus unseren Modellrechnungen kann man (c.p.) folgende Formel ableiten: pro 10 GW mehr Windkraft (Onshore) liegen die Großhandelspreise in Deutschland rund 5 EUR/MWh niedriger. Beispiel: 4 Jahre Zubau mit jährlich 10 GW, statt 5 GW jährlich -> senkt den Strompreis um 10 EUR/MWh bzw. 1 Cent/kWh. (5/5)
Reposted by Moritz Zackariat

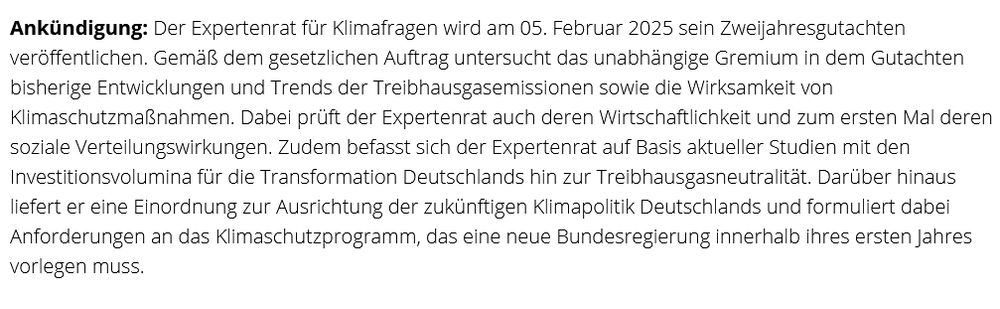
Am Mittwoch, 5.2: Veröffentlichung des Zweijahresgutachtens vom @expertenratklima.bsky.social. Das Gutachen ist dann ab 10 Uhr hier verfügbar: expertenrat-klima.de.
Worum es geht: Trendentwicklung, soziale & ökonomische Verteilungswirkungen, Investitionen und die Ausrichtung der Klimapolitik 👇
Worum es geht: Trendentwicklung, soziale & ökonomische Verteilungswirkungen, Investitionen und die Ausrichtung der Klimapolitik 👇
February 3, 2025 at 6:46 AM
Am Mittwoch, 5.2: Veröffentlichung des Zweijahresgutachtens vom @expertenratklima.bsky.social. Das Gutachen ist dann ab 10 Uhr hier verfügbar: expertenrat-klima.de.
Worum es geht: Trendentwicklung, soziale & ökonomische Verteilungswirkungen, Investitionen und die Ausrichtung der Klimapolitik 👇
Worum es geht: Trendentwicklung, soziale & ökonomische Verteilungswirkungen, Investitionen und die Ausrichtung der Klimapolitik 👇
Reposted by Moritz Zackariat
Auf ~500 Tsd. Hektar werden 5% der Fahrleistung "angebaut" (Raps>Biodiesel>Pkw). ~150 Tsd. Hektar PV-Freifläche reichen eigentlich für 100% Fahrleistung (bilanziell vereinfacht, aber wahr). Günstigere Energiewende? Geht mit PV nicht zu schnell, sondern mit E-Mob zu langsam.

January 30, 2025 at 2:54 PM
Auf ~500 Tsd. Hektar werden 5% der Fahrleistung "angebaut" (Raps>Biodiesel>Pkw). ~150 Tsd. Hektar PV-Freifläche reichen eigentlich für 100% Fahrleistung (bilanziell vereinfacht, aber wahr). Günstigere Energiewende? Geht mit PV nicht zu schnell, sondern mit E-Mob zu langsam.
We have done the maths: the electricity that the existing wind plants can still produce in 20 years of operation is worth 97 billion euros on the electricity market. The dismantling would destroy this equivalent value. Database: www.agora-energiewende.de/publikatione...
January 15, 2025 at 8:52 AM
We have done the maths: the electricity that the existing wind plants can still produce in 20 years of operation is worth 97 billion euros on the electricity market. The dismantling would destroy this equivalent value. Database: www.agora-energiewende.de/publikatione...
Reposted by Moritz Zackariat
Wir haben in unserer Jahresauswertung 2024 den Einfluss sehr hoher / sehr niedriger stündlicher Strompreise 2024 untersucht. Als monatliches Knappheitskriterium haben wir Stundenpreise oberhalb der Einsatzkosten eines Gaskraftwerks* definiert, nach unten <= 0 EUR/MWh.

January 8, 2025 at 9:54 AM
Wir haben in unserer Jahresauswertung 2024 den Einfluss sehr hoher / sehr niedriger stündlicher Strompreise 2024 untersucht. Als monatliches Knappheitskriterium haben wir Stundenpreise oberhalb der Einsatzkosten eines Gaskraftwerks* definiert, nach unten <= 0 EUR/MWh.
Reposted by Moritz Zackariat

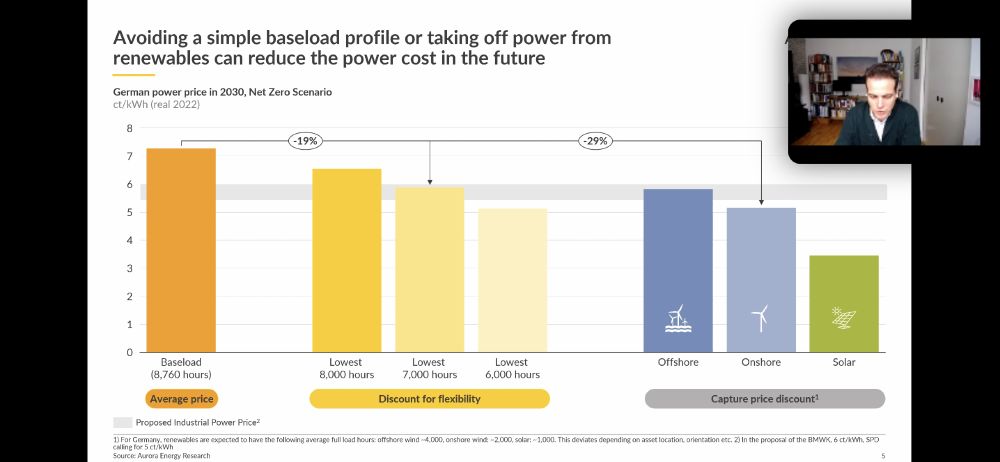
Flexibility of demand is crucial for reaping the benefits of low renewable electricity generation costs. Great visualization from Aurora Energy Research @hannskoenig.bsky.social:
November 9, 2023 at 9:37 AM
Flexibility of demand is crucial for reaping the benefits of low renewable electricity generation costs. Great visualization from Aurora Energy Research @hannskoenig.bsky.social:
Reposted by Moritz Zackariat

Gerechnet hat @agoraew.bsky.social :) Wir haben die Daten netterweise zur Verfügung gestellt bekommen. Aber stimmt, der größte Import-Anteil stammt aus Erneuerbaren.
October 26, 2023 at 9:32 AM
Gerechnet hat @agoraew.bsky.social :) Wir haben die Daten netterweise zur Verfügung gestellt bekommen. Aber stimmt, der größte Import-Anteil stammt aus Erneuerbaren.
Reposted by Moritz Zackariat

Als wir anfingen, mit Monatsdaten von @energy-charts.bsky.social den Import-Strommix zu schätzen, spekulierten Atom-Fans, dass der Atom-Anteil mit stündlichen Daten viel höher sein würde.
@catkrapp.bsky.social und Ben Mendelson haben nun mit Stunden-Daten gerechnet und kommen auf ähnliche Zahlen
@catkrapp.bsky.social und Ben Mendelson haben nun mit Stunden-Daten gerechnet und kommen auf ähnliche Zahlen


October 26, 2023 at 9:28 AM
Als wir anfingen, mit Monatsdaten von @energy-charts.bsky.social den Import-Strommix zu schätzen, spekulierten Atom-Fans, dass der Atom-Anteil mit stündlichen Daten viel höher sein würde.
@catkrapp.bsky.social und Ben Mendelson haben nun mit Stunden-Daten gerechnet und kommen auf ähnliche Zahlen
@catkrapp.bsky.social und Ben Mendelson haben nun mit Stunden-Daten gerechnet und kommen auf ähnliche Zahlen