


Mike Simonsen
@mikesimonsen.bsky.social
I help people understand the housing market. Now: Chief Economist, Compass. Prev: Founder CEO Altos Research (acq by HWMedia)
Maryland is just playing catch up!

October 3, 2025 at 12:10 AM
Maryland is just playing catch up!
Doing some work with the Compass data team today. Thought this looked cool

October 2, 2025 at 7:55 PM
Doing some work with the Compass data team today. Thought this looked cool
Looking at the MBA purchase mortgage applications on a 13-week rolling average really highlights the current trend

October 1, 2025 at 6:25 PM
Looking at the MBA purchase mortgage applications on a 13-week rolling average really highlights the current trend
Existing home sales are inching above last year as reported by NAR.
In our weekly pending contracts, the slight growth over 2024 continues.
Last year the brief mortgage rate dip to 6.1% in September lifted the sales rate for Q4. Will be interesting if we can beat that this year.
In our weekly pending contracts, the slight growth over 2024 continues.
Last year the brief mortgage rate dip to 6.1% in September lifted the sales rate for Q4. Will be interesting if we can beat that this year.

September 25, 2025 at 6:29 PM
Existing home sales are inching above last year as reported by NAR.
In our weekly pending contracts, the slight growth over 2024 continues.
Last year the brief mortgage rate dip to 6.1% in September lifted the sales rate for Q4. Will be interesting if we can beat that this year.
In our weekly pending contracts, the slight growth over 2024 continues.
Last year the brief mortgage rate dip to 6.1% in September lifted the sales rate for Q4. Will be interesting if we can beat that this year.
6/7 We see it in the price reductions too.
41.5% of the homes have taken a price cut from the original list price. That level isn't increasing.
41.5% of the homes have taken a price cut from the original list price. That level isn't increasing.

September 22, 2025 at 11:16 PM
6/7 We see it in the price reductions too.
41.5% of the homes have taken a price cut from the original list price. That level isn't increasing.
41.5% of the homes have taken a price cut from the original list price. That level isn't increasing.
5/7 This "downside stickiness" psychology is a key reason for price stability.
This week, the median price of new pending contracts ticked up to $397,500, coming in almost 2% above the same week last year.
This week, the median price of new pending contracts ticked up to $397,500, coming in almost 2% above the same week last year.

September 22, 2025 at 11:16 PM
5/7 This "downside stickiness" psychology is a key reason for price stability.
This week, the median price of new pending contracts ticked up to $397,500, coming in almost 2% above the same week last year.
This week, the median price of new pending contracts ticked up to $397,500, coming in almost 2% above the same week last year.
4/7 But here's the interesting part:
Even with limited supply, newly pending sales were up almost 5% from last year this week. We counted 77,000 sales contracts started this week.
More transactions are getting done in states with more available inventory.
Even with limited supply, newly pending sales were up almost 5% from last year this week. We counted 77,000 sales contracts started this week.
More transactions are getting done in states with more available inventory.

September 22, 2025 at 11:16 PM
4/7 But here's the interesting part:
Even with limited supply, newly pending sales were up almost 5% from last year this week. We counted 77,000 sales contracts started this week.
More transactions are getting done in states with more available inventory.
Even with limited supply, newly pending sales were up almost 5% from last year this week. We counted 77,000 sales contracts started this week.
More transactions are getting done in states with more available inventory.
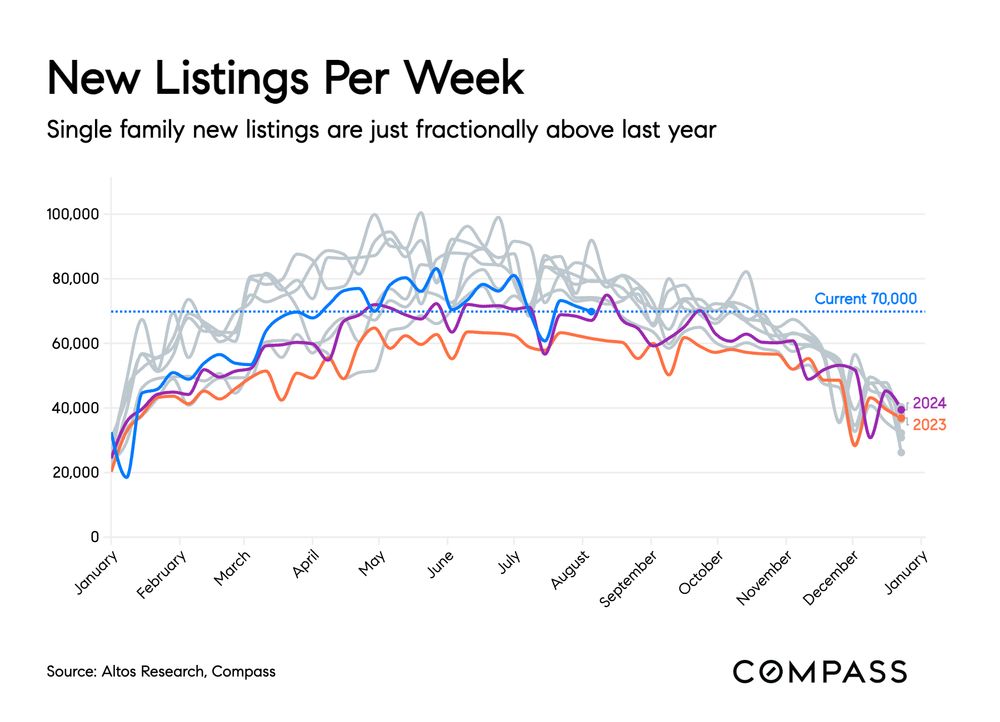
3/7 New listings are down and withdrawals are up.
This week we counted just over 66,000 newly listed single-family homes, 5% fewer than a year ago.
This 90-day rolling average shows the trend clearly.
This week we counted just over 66,000 newly listed single-family homes, 5% fewer than a year ago.
This 90-day rolling average shows the trend clearly.

September 22, 2025 at 11:16 PM
3/7 New listings are down and withdrawals are up.
This week we counted just over 66,000 newly listed single-family homes, 5% fewer than a year ago.
This 90-day rolling average shows the trend clearly.
This week we counted just over 66,000 newly listed single-family homes, 5% fewer than a year ago.
This 90-day rolling average shows the trend clearly.
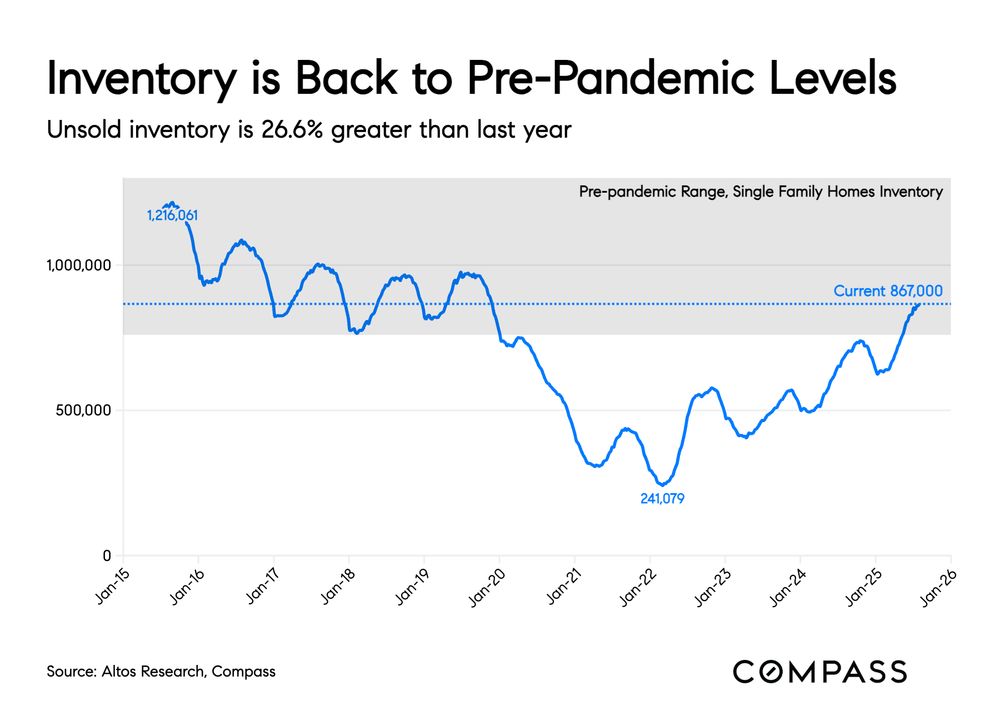
2/7 Data shows this in action:
National inventory has been unchanged at ~860,000 single-family homes since July. Last year it was rising quickly.
National inventory has been unchanged at ~860,000 single-family homes since July. Last year it was rising quickly.

September 22, 2025 at 11:16 PM
2/7 Data shows this in action:
National inventory has been unchanged at ~860,000 single-family homes since July. Last year it was rising quickly.
National inventory has been unchanged at ~860,000 single-family homes since July. Last year it was rising quickly.
Everyone's talking Fed of course, but the real news of the day may be the new construction data

September 17, 2025 at 7:01 PM
Everyone's talking Fed of course, but the real news of the day may be the new construction data
6/ Home sales are inching higher
We count 66,000 newly pending single family home sales this week, plus 13,000 condos. 4% more than a year ago.
In fact, year-to-date the cumulative pending home sales are finally ahead of 2024. 2.759MM sales vs. 2.75MM last year.
We count 66,000 newly pending single family home sales this week, plus 13,000 condos. 4% more than a year ago.
In fact, year-to-date the cumulative pending home sales are finally ahead of 2024. 2.759MM sales vs. 2.75MM last year.

September 2, 2025 at 7:10 PM
6/ Home sales are inching higher
We count 66,000 newly pending single family home sales this week, plus 13,000 condos. 4% more than a year ago.
In fact, year-to-date the cumulative pending home sales are finally ahead of 2024. 2.759MM sales vs. 2.75MM last year.
We count 66,000 newly pending single family home sales this week, plus 13,000 condos. 4% more than a year ago.
In fact, year-to-date the cumulative pending home sales are finally ahead of 2024. 2.759MM sales vs. 2.75MM last year.
5/ Inventory has stopped growing.
861,000 single family homes unsold on the market. That's unchanged for 6 weeks.
Limited supply has implications of a floor on future prices. There are just not that many sellers out there.
861,000 single family homes unsold on the market. That's unchanged for 6 weeks.
Limited supply has implications of a floor on future prices. There are just not that many sellers out there.

September 2, 2025 at 7:10 PM
5/ Inventory has stopped growing.
861,000 single family homes unsold on the market. That's unchanged for 6 weeks.
Limited supply has implications of a floor on future prices. There are just not that many sellers out there.
861,000 single family homes unsold on the market. That's unchanged for 6 weeks.
Limited supply has implications of a floor on future prices. There are just not that many sellers out there.
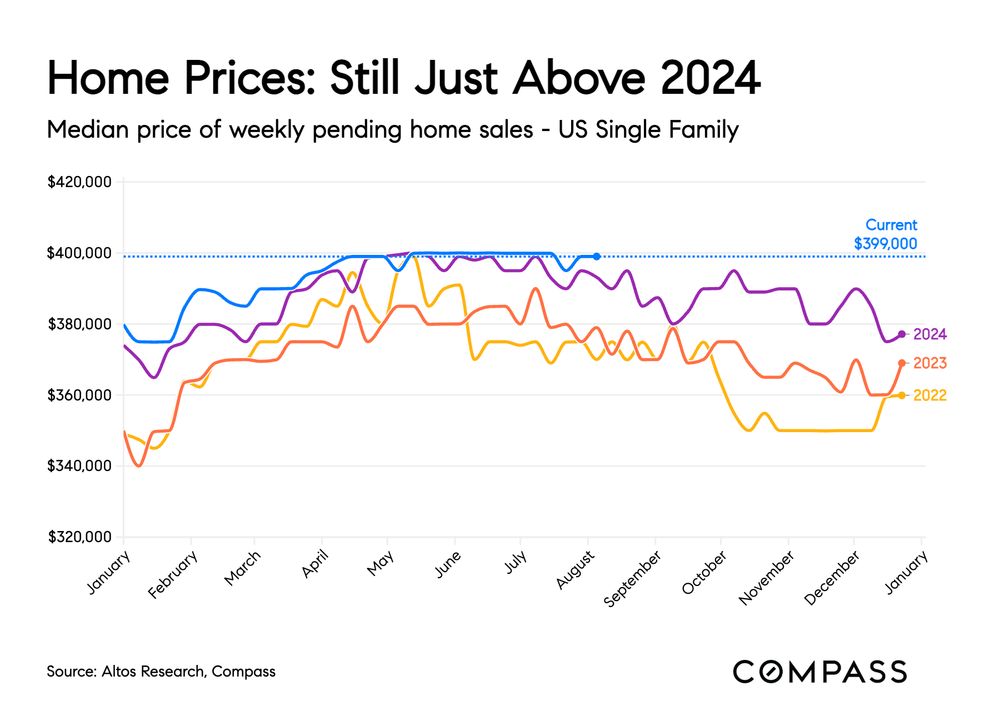
4/The price of the weekly pending home sales is still positive. +1.6% vs last year at this time.
I expect it to be negative by October.
In this chart I've highlighted three recent pricing moments to pay attention to for repeats later in 2025, depending on mortgage rate moves.
I expect it to be negative by October.
In this chart I've highlighted three recent pricing moments to pay attention to for repeats later in 2025, depending on mortgage rate moves.

September 2, 2025 at 7:10 PM
4/The price of the weekly pending home sales is still positive. +1.6% vs last year at this time.
I expect it to be negative by October.
In this chart I've highlighted three recent pricing moments to pay attention to for repeats later in 2025, depending on mortgage rate moves.
I expect it to be negative by October.
In this chart I've highlighted three recent pricing moments to pay attention to for repeats later in 2025, depending on mortgage rate moves.
3/ The Case Shiller Index for June was released last Tuesday. It was still 1.9% above 2024, but in a few months I expect it'll catch up to the real-time active market data and turn negative too.
Expect EOY "Home prices are down for 2025" headlines.
Expect EOY "Home prices are down for 2025" headlines.

September 2, 2025 at 7:10 PM
3/ The Case Shiller Index for June was released last Tuesday. It was still 1.9% above 2024, but in a few months I expect it'll catch up to the real-time active market data and turn negative too.
Expect EOY "Home prices are down for 2025" headlines.
Expect EOY "Home prices are down for 2025" headlines.
2/ Home Price per Square Foot is Now Below 2024
The slope of the asking price of homes for sale continues to be pretty steep. This is the first negative reading since 2023 and looks like it's aiming for full year 2025 to finish lower than 2024. (national, single fam)
The slope of the asking price of homes for sale continues to be pretty steep. This is the first negative reading since 2023 and looks like it's aiming for full year 2025 to finish lower than 2024. (national, single fam)

September 2, 2025 at 7:10 PM
2/ Home Price per Square Foot is Now Below 2024
The slope of the asking price of homes for sale continues to be pretty steep. This is the first negative reading since 2023 and looks like it's aiming for full year 2025 to finish lower than 2024. (national, single fam)
The slope of the asking price of homes for sale continues to be pretty steep. This is the first negative reading since 2023 and looks like it's aiming for full year 2025 to finish lower than 2024. (national, single fam)
Home prices are about to go negative again.
Here's an illustration of what's under way.
Here's an illustration of what's under way.
August 16, 2025 at 5:50 PM
Home prices are about to go negative again.
Here's an illustration of what's under way.
Here's an illustration of what's under way.
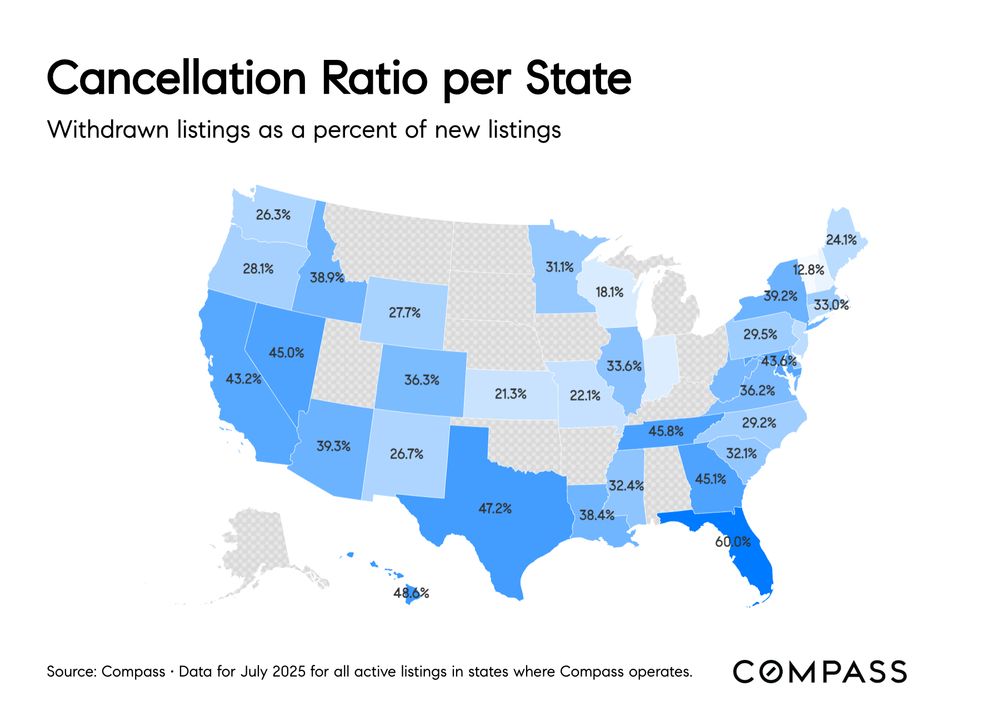
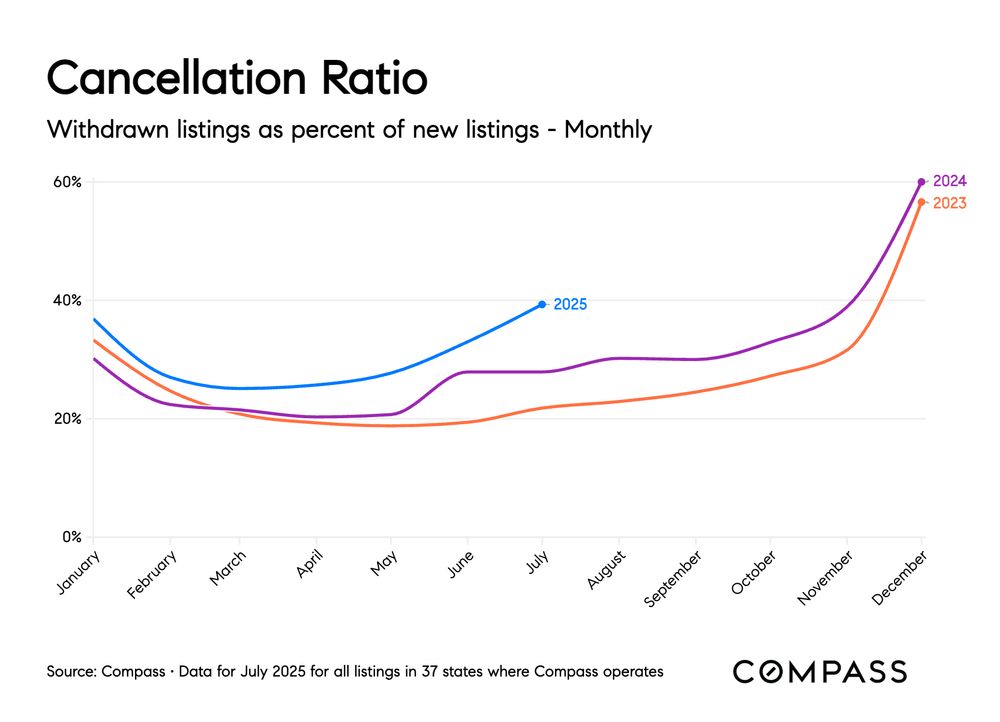
When home sellers don't get the offer they want, one option is to withdraw the listing.
How much are cancellations effecting the market right now?
Lots of people asking that question. Here's how I look at it. As a percentage of new listings - how many cancel?
Some data:
How much are cancellations effecting the market right now?
Lots of people asking that question. Here's how I look at it. As a percentage of new listings - how many cancel?
Some data:
August 7, 2025 at 9:22 PM
When home sellers don't get the offer they want, one option is to withdraw the listing.
How much are cancellations effecting the market right now?
Lots of people asking that question. Here's how I look at it. As a percentage of new listings - how many cancel?
Some data:
How much are cancellations effecting the market right now?
Lots of people asking that question. Here's how I look at it. As a percentage of new listings - how many cancel?
Some data:
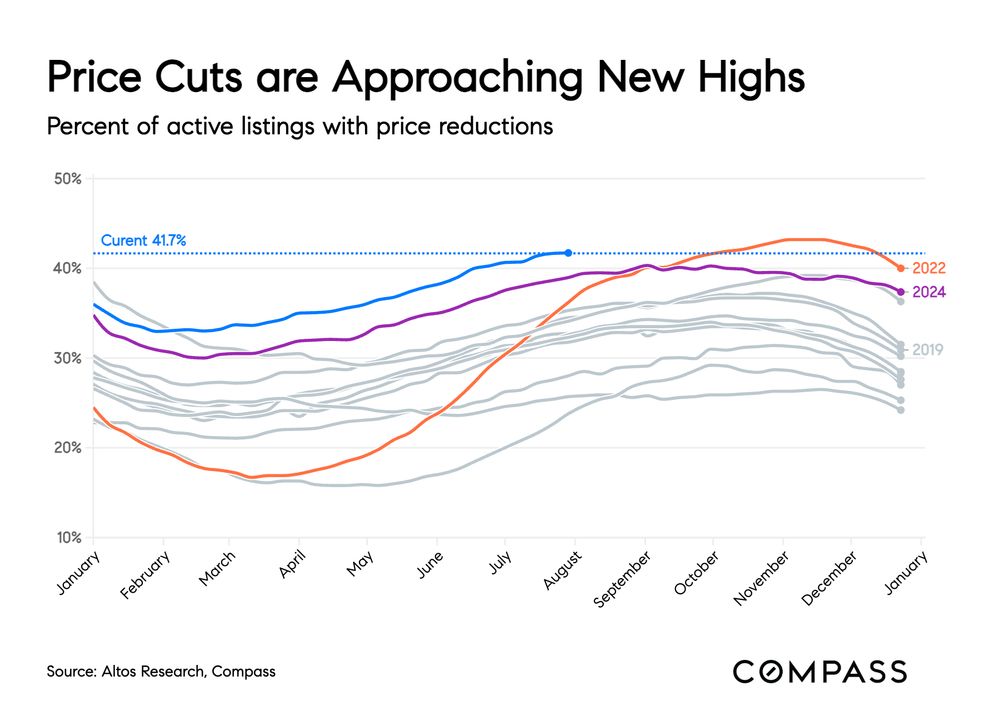
5/6 Price Reductions
➡️ At 41.7% of the active listings, price reductions were unchanged from last week but still significantly more than a year ago.
While pricing is obviously soft in most of the country, it's notable that it's not deteriorating.
➡️ At 41.7% of the active listings, price reductions were unchanged from last week but still significantly more than a year ago.
While pricing is obviously soft in most of the country, it's notable that it's not deteriorating.
August 4, 2025 at 9:07 PM
5/6 Price Reductions
➡️ At 41.7% of the active listings, price reductions were unchanged from last week but still significantly more than a year ago.
While pricing is obviously soft in most of the country, it's notable that it's not deteriorating.
➡️ At 41.7% of the active listings, price reductions were unchanged from last week but still significantly more than a year ago.
While pricing is obviously soft in most of the country, it's notable that it's not deteriorating.
4/6 Home Prices
➡️At $399,000 home prices are just 1.5% above last year at this time.
Even as sale inch upwards, it sure looks like there are lots of opportunities for home prices to finish 2025 in negative territory.
➡️At $399,000 home prices are just 1.5% above last year at this time.
Even as sale inch upwards, it sure looks like there are lots of opportunities for home prices to finish 2025 in negative territory.
August 4, 2025 at 9:07 PM
4/6 Home Prices
➡️At $399,000 home prices are just 1.5% above last year at this time.
Even as sale inch upwards, it sure looks like there are lots of opportunities for home prices to finish 2025 in negative territory.
➡️At $399,000 home prices are just 1.5% above last year at this time.
Even as sale inch upwards, it sure looks like there are lots of opportunities for home prices to finish 2025 in negative territory.
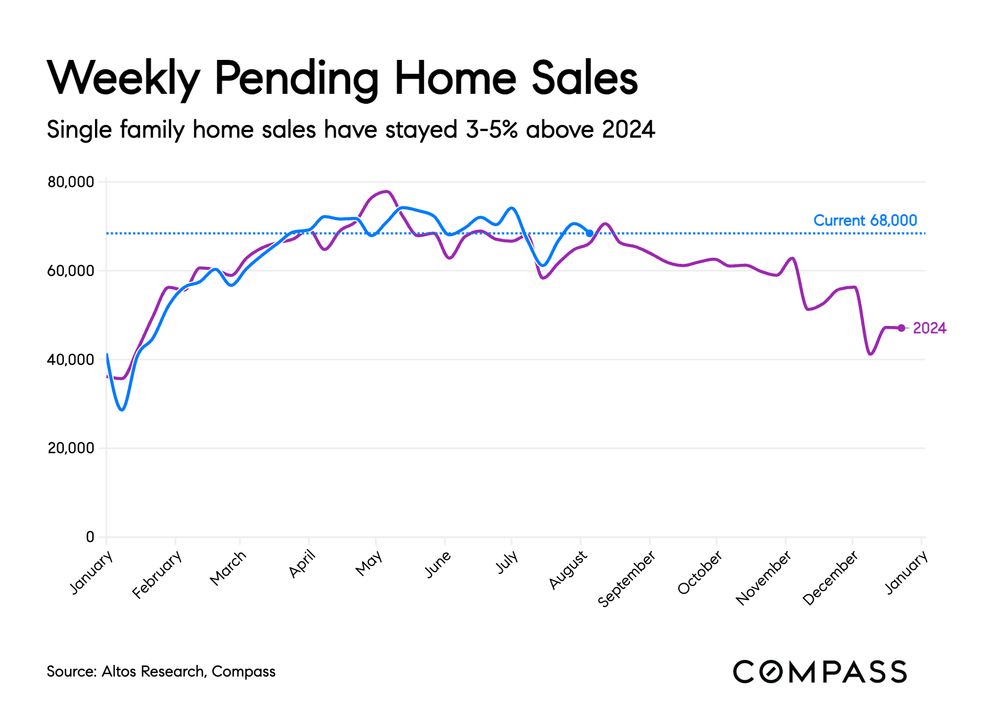
3/6 Weekly Pending Home Sales
➡️68,000 new contracts for single family homes.
That dipped 3% for the week but is still 3.5% greater than last year. Slowly that'll turn into transaction growth headlines.
➡️68,000 new contracts for single family homes.
That dipped 3% for the week but is still 3.5% greater than last year. Slowly that'll turn into transaction growth headlines.
August 4, 2025 at 9:07 PM
3/6 Weekly Pending Home Sales
➡️68,000 new contracts for single family homes.
That dipped 3% for the week but is still 3.5% greater than last year. Slowly that'll turn into transaction growth headlines.
➡️68,000 new contracts for single family homes.
That dipped 3% for the week but is still 3.5% greater than last year. Slowly that'll turn into transaction growth headlines.
2/6 Inventory
➡️There are 867,000 single family homes on the market.
That's 26.6% more than last year. Lots more unsold homes, but inventory was growing faster then.
➡️There are 867,000 single family homes on the market.
That's 26.6% more than last year. Lots more unsold homes, but inventory was growing faster then.
August 4, 2025 at 9:07 PM
2/6 Inventory
➡️There are 867,000 single family homes on the market.
That's 26.6% more than last year. Lots more unsold homes, but inventory was growing faster then.
➡️There are 867,000 single family homes on the market.
That's 26.6% more than last year. Lots more unsold homes, but inventory was growing faster then.
This week in the Compass Intelligence weekly housing market data:
Everyone knows that the price pressure is on. Did you know that have been gradually FEWER new listings each week?
Sellers are staying away.
That implies a cap on inventory growth for the rest of the year.
1/6
Everyone knows that the price pressure is on. Did you know that have been gradually FEWER new listings each week?
Sellers are staying away.
That implies a cap on inventory growth for the rest of the year.
1/6
August 4, 2025 at 9:07 PM
This week in the Compass Intelligence weekly housing market data:
Everyone knows that the price pressure is on. Did you know that have been gradually FEWER new listings each week?
Sellers are staying away.
That implies a cap on inventory growth for the rest of the year.
1/6
Everyone knows that the price pressure is on. Did you know that have been gradually FEWER new listings each week?
Sellers are staying away.
That implies a cap on inventory growth for the rest of the year.
1/6
11:30pm update. Problem fixed.

July 26, 2025 at 3:54 PM
11:30pm update. Problem fixed.
California unsold inventory is at levels not seen in 8 years. Up 37% over last year.
Help me answer: Why now?
Help me answer: Why now?
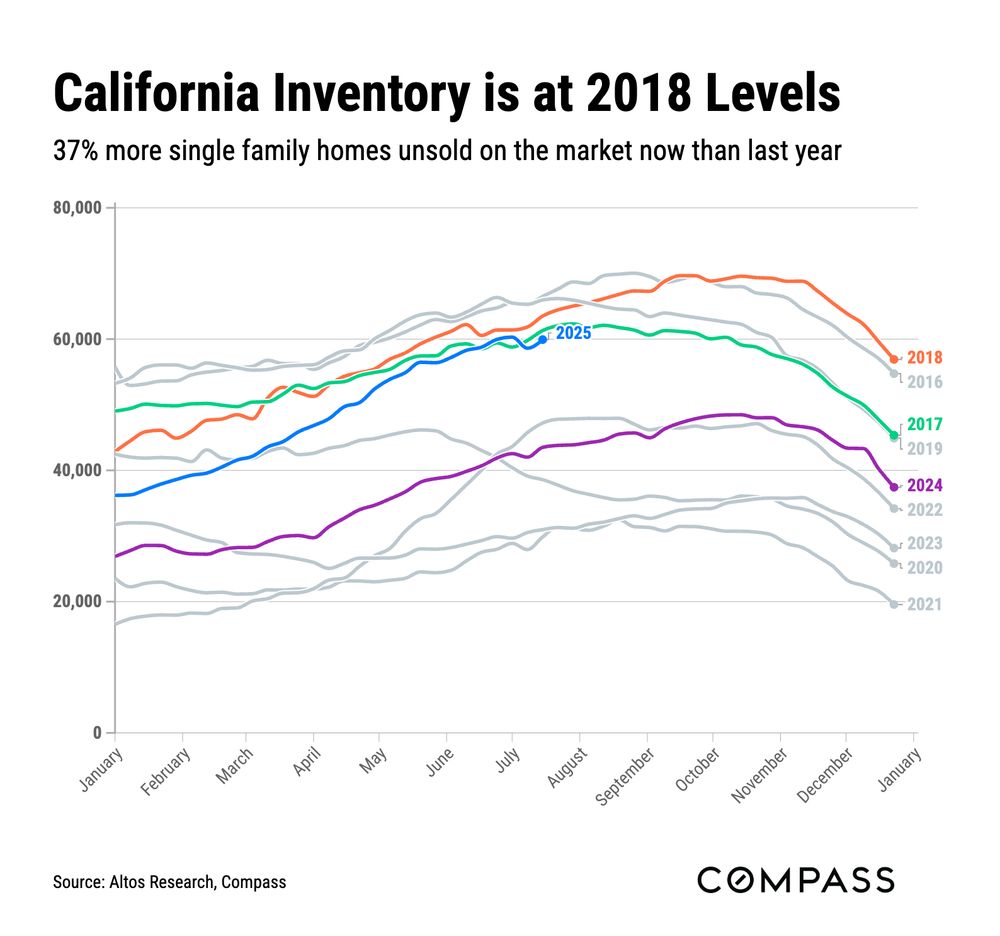
July 21, 2025 at 10:44 PM
California unsold inventory is at levels not seen in 8 years. Up 37% over last year.
Help me answer: Why now?
Help me answer: Why now?
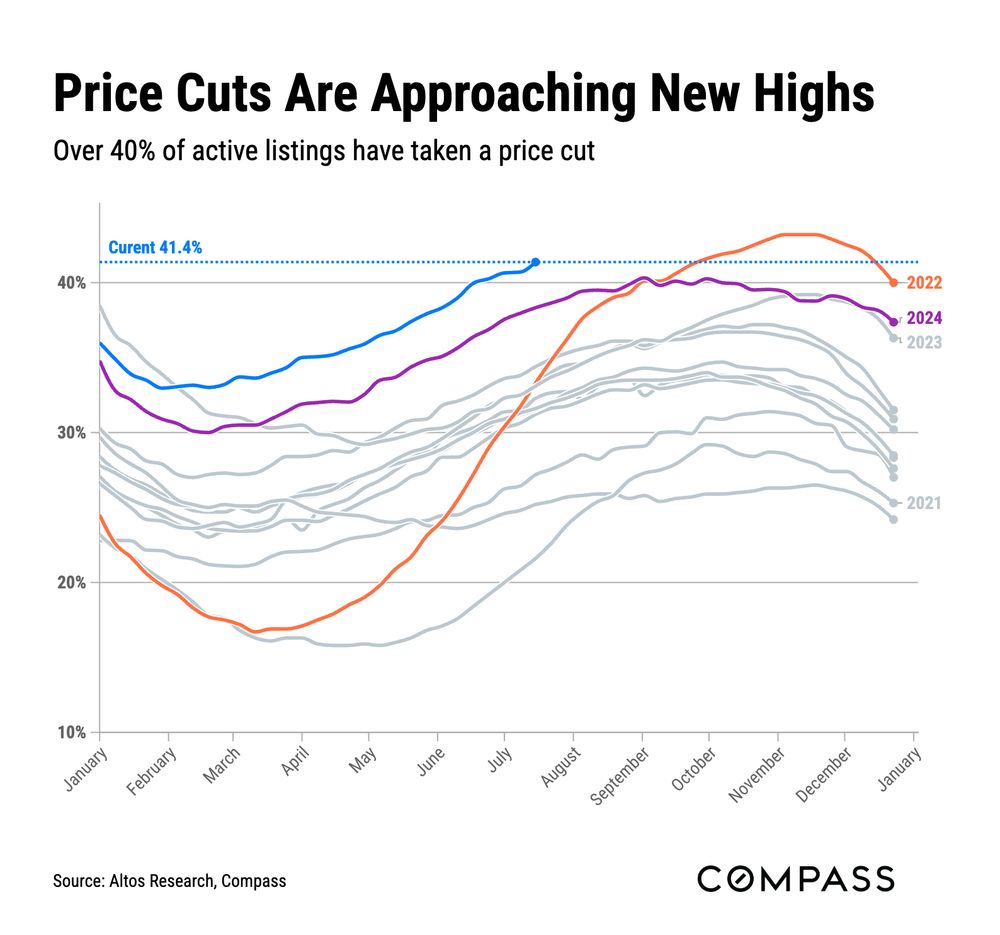
5/ Price Reductions
For the leading indicators of future sales prices, we look at the price reductions now. Currently 41.4% of the homes on the market have taken a price cut. Up 70bp for the week.
That signals continued price pressures through the rest of the year at least.
For the leading indicators of future sales prices, we look at the price reductions now. Currently 41.4% of the homes on the market have taken a price cut. Up 70bp for the week.
That signals continued price pressures through the rest of the year at least.
July 21, 2025 at 6:59 PM
5/ Price Reductions
For the leading indicators of future sales prices, we look at the price reductions now. Currently 41.4% of the homes on the market have taken a price cut. Up 70bp for the week.
That signals continued price pressures through the rest of the year at least.
For the leading indicators of future sales prices, we look at the price reductions now. Currently 41.4% of the homes on the market have taken a price cut. Up 70bp for the week.
That signals continued price pressures through the rest of the year at least.