


Max Kanter
@maxkanter.com
CEO @gridstatus.io.
I like making things. Interested in energy & data
I like making things. Interested in energy & data
We're about to release a new Forecast Analysis app on
@gridstatus.io, and I’m looking for users to test it.
Not only does it make pretty visualizations, it helps you understand how forecast vintages evolve over time, compare their historical accuracy, and more.
DM or reply for link!
@gridstatus.io, and I’m looking for users to test it.
Not only does it make pretty visualizations, it helps you understand how forecast vintages evolve over time, compare their historical accuracy, and more.
DM or reply for link!

June 19, 2025 at 7:29 PM
We're about to release a new Forecast Analysis app on
@gridstatus.io, and I’m looking for users to test it.
Not only does it make pretty visualizations, it helps you understand how forecast vintages evolve over time, compare their historical accuracy, and more.
DM or reply for link!
@gridstatus.io, and I’m looking for users to test it.
Not only does it make pretty visualizations, it helps you understand how forecast vintages evolve over time, compare their historical accuracy, and more.
DM or reply for link!
Anyone else at the ERCOT Innovation Summit today? Come say hi!

May 6, 2025 at 2:04 PM
Anyone else at the ERCOT Innovation Summit today? Come say hi!
A new nodal electricity market went live in Ontario early this morning! Shortly after, we had the data flowing into
@gridstatus.io
So far, LMPs have ranged from $-100/MWh to $367/MWh across the nearly 1000 new nodes in IESO
See the pretty map and more here: www.gridstatus.io/live/ieso
@gridstatus.io
So far, LMPs have ranged from $-100/MWh to $367/MWh across the nearly 1000 new nodes in IESO
See the pretty map and more here: www.gridstatus.io/live/ieso

May 1, 2025 at 7:51 PM
A new nodal electricity market went live in Ontario early this morning! Shortly after, we had the data flowing into
@gridstatus.io
So far, LMPs have ranged from $-100/MWh to $367/MWh across the nearly 1000 new nodes in IESO
See the pretty map and more here: www.gridstatus.io/live/ieso
@gridstatus.io
So far, LMPs have ranged from $-100/MWh to $367/MWh across the nearly 1000 new nodes in IESO
See the pretty map and more here: www.gridstatus.io/live/ieso
Reposted by Max Kanter

On February 19th, a battery north of Austin had a high relief shift factor against overlapping constraints, leading to all-time-high prices that approached $30,000/MWh.
We walked through how to use Grid Status to monitor, track, and review these situations 🔌💡
blog.gridstatus.io/exploring-ex...
We walked through how to use Grid Status to monitor, track, and review these situations 🔌💡
blog.gridstatus.io/exploring-ex...

Exploring extreme prices in ERCOT with Grid Status
On 2/19/2025 a single location in ERCOT experienced all-time-high prices. What happened, and was the local battery, Rabbit Hill, able to capitalize on these extreme prices?
blog.gridstatus.io
April 22, 2025 at 4:05 PM
On February 19th, a battery north of Austin had a high relief shift factor against overlapping constraints, leading to all-time-high prices that approached $30,000/MWh.
We walked through how to use Grid Status to monitor, track, and review these situations 🔌💡
blog.gridstatus.io/exploring-ex...
We walked through how to use Grid Status to monitor, track, and review these situations 🔌💡
blog.gridstatus.io/exploring-ex...
Reposted by Max Kanter
new blog!
this time we dove into the data around an event in PJM last summer where ~1.5 GW of datacenters suddenly dropped off the grid in northern Virginia, PJM's limited tools to deal with these kinds of events, and the sad state of batteries in the RTO 🔌💡
blog.gridstatus.io/byte-blackou...
this time we dove into the data around an event in PJM last summer where ~1.5 GW of datacenters suddenly dropped off the grid in northern Virginia, PJM's limited tools to deal with these kinds of events, and the sad state of batteries in the RTO 🔌💡
blog.gridstatus.io/byte-blackou...


April 18, 2025 at 2:32 PM
new blog!
this time we dove into the data around an event in PJM last summer where ~1.5 GW of datacenters suddenly dropped off the grid in northern Virginia, PJM's limited tools to deal with these kinds of events, and the sad state of batteries in the RTO 🔌💡
blog.gridstatus.io/byte-blackou...
this time we dove into the data around an event in PJM last summer where ~1.5 GW of datacenters suddenly dropped off the grid in northern Virginia, PJM's limited tools to deal with these kinds of events, and the sad state of batteries in the RTO 🔌💡
blog.gridstatus.io/byte-blackou...

April 9, 2025 at 1:00 PM
Reposted by Max Kanter
Prices spiked in ERCOT this morning, mostly driven by the cost of energy from marginal batteries.
We're in the depths of outage season with many thermal assets out for maintenance. In those conditions, even a modest morning load forecast beat can lead to a quick run up the supply stack. 🔌💡
We're in the depths of outage season with many thermal assets out for maintenance. In those conditions, even a modest morning load forecast beat can lead to a quick run up the supply stack. 🔌💡

April 7, 2025 at 4:21 PM
Prices spiked in ERCOT this morning, mostly driven by the cost of energy from marginal batteries.
We're in the depths of outage season with many thermal assets out for maintenance. In those conditions, even a modest morning load forecast beat can lead to a quick run up the supply stack. 🔌💡
We're in the depths of outage season with many thermal assets out for maintenance. In those conditions, even a modest morning load forecast beat can lead to a quick run up the supply stack. 🔌💡
Reposted by Max Kanter
This morning we published our longest blog to date, going deep on IESO in Ontario it nears the May 1st go-live date for its Market Renewal Program (MRP) 🔌💡
little 🧵 with some IESO background, check the blog for more figures and explanation of the MRP
blog.gridstatus.io/market-renew...
little 🧵 with some IESO background, check the blog for more figures and explanation of the MRP
blog.gridstatus.io/market-renew...

Market Renewal in Ontario: Navigating IESO's Shift to a Nodal System
Ontario's power market administrator, IESO, is about to undergo major changes. We explore the history of the ISO and examine the impact these reforms will have on participants.
blog.gridstatus.io
March 26, 2025 at 3:34 PM
This morning we published our longest blog to date, going deep on IESO in Ontario it nears the May 1st go-live date for its Market Renewal Program (MRP) 🔌💡
little 🧵 with some IESO background, check the blog for more figures and explanation of the MRP
blog.gridstatus.io/market-renew...
little 🧵 with some IESO background, check the blog for more figures and explanation of the MRP
blog.gridstatus.io/market-renew...
Reposted by Max Kanter

One of the better use cases for this message summary stuff that I’ve stumbled across so far

March 20, 2025 at 7:21 PM
One of the better use cases for this message summary stuff that I’ve stumbled across so far
Reposted by Max Kanter
March 5, 2025 at 3:36 PM
Reposted by Max Kanter
ISO-NE and NYISO did make exigent circumstances filings with FERC on Friday 🔌💡
Basically saying "we need to do something right now, please approve, even if it's not perfect" (snipping ISO-NE)
www.iso-ne.com/static-asset...
nyisoviewer.etariff.biz/ViewerDocLib...
Basically saying "we need to do something right now, please approve, even if it's not perfect" (snipping ISO-NE)
www.iso-ne.com/static-asset...
nyisoviewer.etariff.biz/ViewerDocLib...


March 3, 2025 at 10:15 PM
ISO-NE and NYISO did make exigent circumstances filings with FERC on Friday 🔌💡
Basically saying "we need to do something right now, please approve, even if it's not perfect" (snipping ISO-NE)
www.iso-ne.com/static-asset...
nyisoviewer.etariff.biz/ViewerDocLib...
Basically saying "we need to do something right now, please approve, even if it's not perfect" (snipping ISO-NE)
www.iso-ne.com/static-asset...
nyisoviewer.etariff.biz/ViewerDocLib...
Crazy last few days in ERCOT. To summarize:
1. Record winter load peak
2. Record net load
3. Record battery discharge
4. Record solar generation
5. Record 5-minute LMPs at a specific node
1. Record winter load peak
2. Record net load
3. Record battery discharge
4. Record solar generation
5. Record 5-minute LMPs at a specific node
ERCOT broke its record winter peak yesterday and today, culminating in a new record above 80 GW for the first time at 8AM CST this morning. But even more has been going on under the hood in the last few days. 🔌💡
🧵
🧵

February 20, 2025 at 4:43 PM
Crazy last few days in ERCOT. To summarize:
1. Record winter load peak
2. Record net load
3. Record battery discharge
4. Record solar generation
5. Record 5-minute LMPs at a specific node
1. Record winter load peak
2. Record net load
3. Record battery discharge
4. Record solar generation
5. Record 5-minute LMPs at a specific node
Reposted by Max Kanter
PJM set a new winter demand record, ~145GW, displacing a decade-old peak
Prior to the new record, only a single day had cracked the winter top ten in the last decade. Impressively, the RTO accomplished this while exporting ~8 GW to neighbors.
💡🔌
Prior to the new record, only a single day had cracked the winter top ten in the last decade. Impressively, the RTO accomplished this while exporting ~8 GW to neighbors.
💡🔌

January 22, 2025 at 5:50 PM
PJM set a new winter demand record, ~145GW, displacing a decade-old peak
Prior to the new record, only a single day had cracked the winter top ten in the last decade. Impressively, the RTO accomplished this while exporting ~8 GW to neighbors.
💡🔌
Prior to the new record, only a single day had cracked the winter top ten in the last decade. Impressively, the RTO accomplished this while exporting ~8 GW to neighbors.
💡🔌
Reposted by Max Kanter
TVA appears to have set a new demand record 📈
The previous record was ~34.5 GW on January 17th, just last year.
You can track this here: www.gridstatus.io/eia/TVA
A note of caution though, this EIA data can change as it gets updated, consider it preliminary in the moment.
💡🔌
The previous record was ~34.5 GW on January 17th, just last year.
You can track this here: www.gridstatus.io/eia/TVA
A note of caution though, this EIA data can change as it gets updated, consider it preliminary in the moment.
💡🔌

January 22, 2025 at 2:50 PM
TVA appears to have set a new demand record 📈
The previous record was ~34.5 GW on January 17th, just last year.
You can track this here: www.gridstatus.io/eia/TVA
A note of caution though, this EIA data can change as it gets updated, consider it preliminary in the moment.
💡🔌
The previous record was ~34.5 GW on January 17th, just last year.
You can track this here: www.gridstatus.io/eia/TVA
A note of caution though, this EIA data can change as it gets updated, consider it preliminary in the moment.
💡🔌
Reposted by Max Kanter
If you have a free Grid Status account you can check out example custom dashboards, like CAISO's, that go beyond the Live page in the main app.
Same goes for out east, where DA prices have been rising in NYISO and ISO-NE over the weekend as the system braces for cold and snow. 🔌💡
Same goes for out east, where DA prices have been rising in NYISO and ISO-NE over the weekend as the system braces for cold and snow. 🔌💡


January 19, 2025 at 6:17 PM
If you have a free Grid Status account you can check out example custom dashboards, like CAISO's, that go beyond the Live page in the main app.
Same goes for out east, where DA prices have been rising in NYISO and ISO-NE over the weekend as the system braces for cold and snow. 🔌💡
Same goes for out east, where DA prices have been rising in NYISO and ISO-NE over the weekend as the system braces for cold and snow. 🔌💡
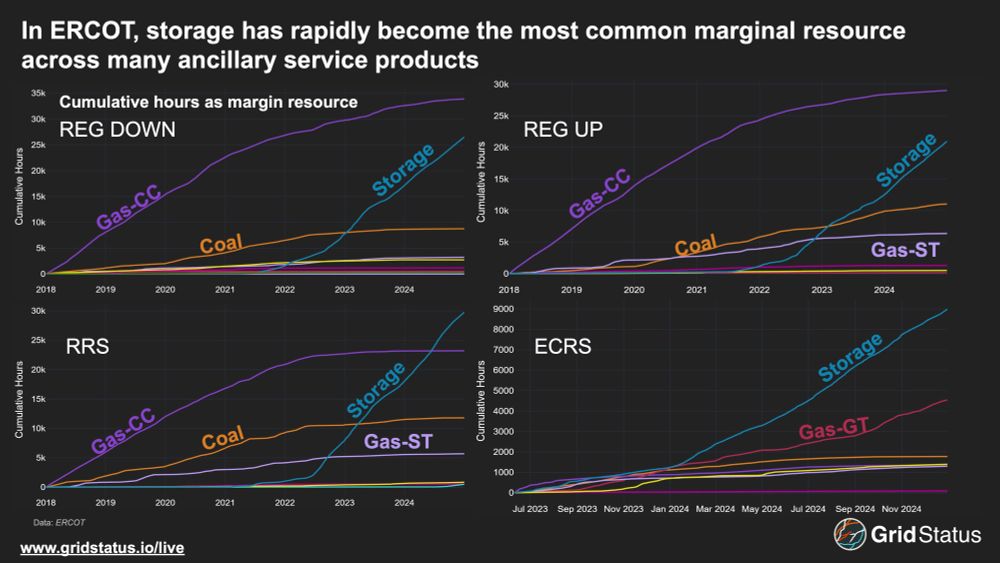
The speed at which batteries have taken over ancillary services in ERCOT is impressive!
January 16, 2025 at 9:04 PM
The speed at which batteries have taken over ancillary services in ERCOT is impressive!
Such a nice example of how grid operations manifest in price signals
As winter storm impacts mounted in PJM, the AP South internal interface exceeded its warning limit, triggering price separation via congestion.
As snow settled in over the Mid-Atlantic, Dominion’s demand exceeded AEP’s, a result of both storm placement and a greater reliance on electric heating 🔌💡
As snow settled in over the Mid-Atlantic, Dominion’s demand exceeded AEP’s, a result of both storm placement and a greater reliance on electric heating 🔌💡


January 6, 2025 at 8:30 PM
Such a nice example of how grid operations manifest in price signals
Reposted by Max Kanter
Load in the Far West of ERCOT has exploded
Expansion and electrification of oil and gas operations has driven load growth in ERCOT’s Far West weather zone. Likely the fastest load growth in the country over the past few years.
Expansion and electrification of oil and gas operations has driven load growth in ERCOT’s Far West weather zone. Likely the fastest load growth in the country over the past few years.

January 3, 2025 at 4:17 PM
Load in the Far West of ERCOT has exploded
Expansion and electrification of oil and gas operations has driven load growth in ERCOT’s Far West weather zone. Likely the fastest load growth in the country over the past few years.
Expansion and electrification of oil and gas operations has driven load growth in ERCOT’s Far West weather zone. Likely the fastest load growth in the country over the past few years.
Reposted by Max Kanter
Batteries are reshaping ERCOT’s ancillary services procurement
Battery generation capacity has made up 50%+ of awards for reg up and responsive reserves since 2022. In these, coal and gas regularly account for <20% of capacity.
#energysky 🔌💡
Battery generation capacity has made up 50%+ of awards for reg up and responsive reserves since 2022. In these, coal and gas regularly account for <20% of capacity.
#energysky 🔌💡

December 23, 2024 at 6:58 PM
Batteries are reshaping ERCOT’s ancillary services procurement
Battery generation capacity has made up 50%+ of awards for reg up and responsive reserves since 2022. In these, coal and gas regularly account for <20% of capacity.
#energysky 🔌💡
Battery generation capacity has made up 50%+ of awards for reg up and responsive reserves since 2022. In these, coal and gas regularly account for <20% of capacity.
#energysky 🔌💡
Here's my Master's thesis proposal from 10 years ago. Crazy that I'm still trying to solve this problem, now focusing on the energy industry.
As @waldoch.bsky.social pointed out, I forgot to mention communicating/writing about the insights, which is a big part of what we do at @gridstatus.io
As @waldoch.bsky.social pointed out, I forgot to mention communicating/writing about the insights, which is a big part of what we do at @gridstatus.io

December 20, 2024 at 4:53 PM
Here's my Master's thesis proposal from 10 years ago. Crazy that I'm still trying to solve this problem, now focusing on the energy industry.
As @waldoch.bsky.social pointed out, I forgot to mention communicating/writing about the insights, which is a big part of what we do at @gridstatus.io
As @waldoch.bsky.social pointed out, I forgot to mention communicating/writing about the insights, which is a big part of what we do at @gridstatus.io
There's been plenty of talk about how ERCOT surpassed CAISO for peak utility-scale solar production in 2024. But did you know MISO also surpassed PJM?
Peak solar production in MISO shot up 144% during the past year, reaching over 8GW in October.
Lots of good insights in this thread!
Peak solar production in MISO shot up 144% during the past year, reaching over 8GW in October.
Lots of good insights in this thread!
MISO hits the gas on solar
MISO and PJM are the two largest markets in the US, with solar capacity growing faster than many may realize. MISO’s solar record increased dramatically over the year, surpassing 8GW in October, while contribution to peak load exceeded 5% on more than 50 days.
MISO and PJM are the two largest markets in the US, with solar capacity growing faster than many may realize. MISO’s solar record increased dramatically over the year, surpassing 8GW in October, while contribution to peak load exceeded 5% on more than 50 days.

December 18, 2024 at 10:47 PM
There's been plenty of talk about how ERCOT surpassed CAISO for peak utility-scale solar production in 2024. But did you know MISO also surpassed PJM?
Peak solar production in MISO shot up 144% during the past year, reaching over 8GW in October.
Lots of good insights in this thread!
Peak solar production in MISO shot up 144% during the past year, reaching over 8GW in October.
Lots of good insights in this thread!
Reposted by Max Kanter
Many big updates testing internally right now, but a surprise smaller one just shipped, new Pricing tab on each ISO's Live page.
Use Sync Tooltips to compare across charts
We have our list of improvements for this in the new year, but what do you want to see? 🔌💡
www.gridstatus.io/live/ercot#p...
Use Sync Tooltips to compare across charts
We have our list of improvements for this in the new year, but what do you want to see? 🔌💡
www.gridstatus.io/live/ercot#p...

December 12, 2024 at 7:21 PM
Many big updates testing internally right now, but a surprise smaller one just shipped, new Pricing tab on each ISO's Live page.
Use Sync Tooltips to compare across charts
We have our list of improvements for this in the new year, but what do you want to see? 🔌💡
www.gridstatus.io/live/ercot#p...
Use Sync Tooltips to compare across charts
We have our list of improvements for this in the new year, but what do you want to see? 🔌💡
www.gridstatus.io/live/ercot#p...
Reposted by Max Kanter
Last night, PJM released preliminary values for its 2025 load forecast, which once again represent a significant increase from the previous year. These findings will be presented at the Load Analysis Subcommittee next Monday and published in final form early next year.
short 🧵
#energysky
short 🧵
#energysky

December 5, 2024 at 9:41 PM
Last night, PJM released preliminary values for its 2025 load forecast, which once again represent a significant increase from the previous year. These findings will be presented at the Load Analysis Subcommittee next Monday and published in final form early next year.
short 🧵
#energysky
short 🧵
#energysky
Reposted by Max Kanter
Returning to price, we can see an escalation across both the Energy and Congestion components when wind was lowest and most off from the forecast.
However, divergence occurred as wind began to recover. A negative congestion signal was sent to windy areas due to now-ramped thermal gen closer to load
However, divergence occurred as wind began to recover. A negative congestion signal was sent to windy areas due to now-ramped thermal gen closer to load

November 12, 2024 at 7:56 PM
Returning to price, we can see an escalation across both the Energy and Congestion components when wind was lowest and most off from the forecast.
However, divergence occurred as wind began to recover. A negative congestion signal was sent to windy areas due to now-ramped thermal gen closer to load
However, divergence occurred as wind began to recover. A negative congestion signal was sent to windy areas due to now-ramped thermal gen closer to load