


Lien
@liendata.bsky.social
Data. Semiconductor. Process mining. Homemade memes. Occasional artist. Skills of a data engineer and education of a data scientist... but I enjoy working as an overqualified data analyst instead 🦄
hehe, spotted a "TODO" in the documentation... Can't even blame them, I do it all the time 😂

October 4, 2025 at 8:23 PM
hehe, spotted a "TODO" in the documentation... Can't even blame them, I do it all the time 😂
What's awesome about building open source is that you don't have to worry about sales prospects. For example, using your favourite animal stacking poo cubes as the logo for a data preparation tool, is a totally valid option.
#databs
#databs

September 25, 2025 at 6:01 AM
What's awesome about building open source is that you don't have to worry about sales prospects. For example, using your favourite animal stacking poo cubes as the logo for a data preparation tool, is a totally valid option.
#databs
#databs
How's your side project going? #databs #opensource

September 23, 2025 at 9:41 PM
How's your side project going? #databs #opensource

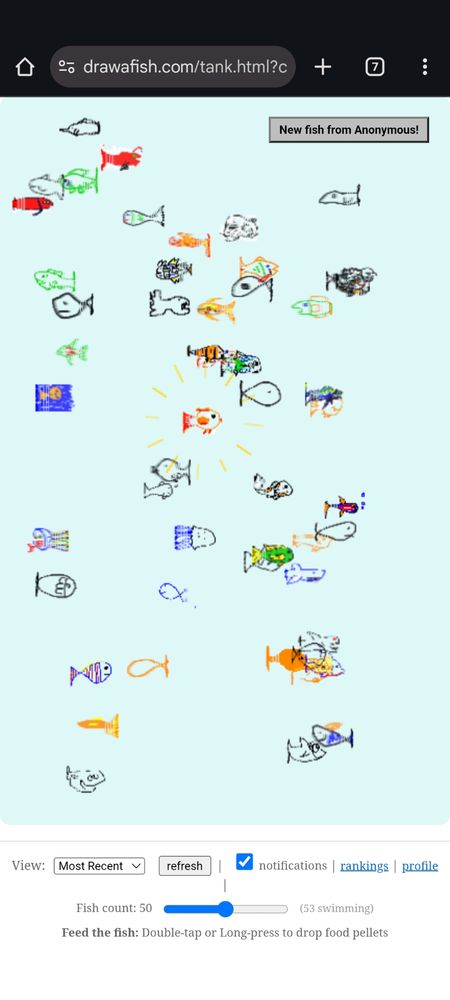
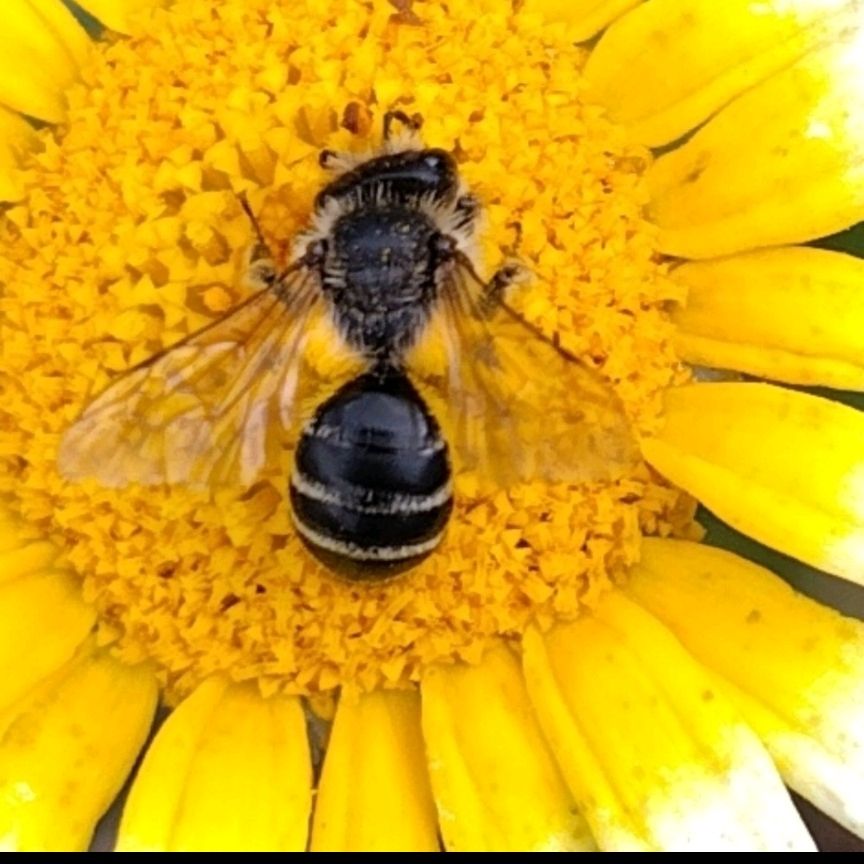
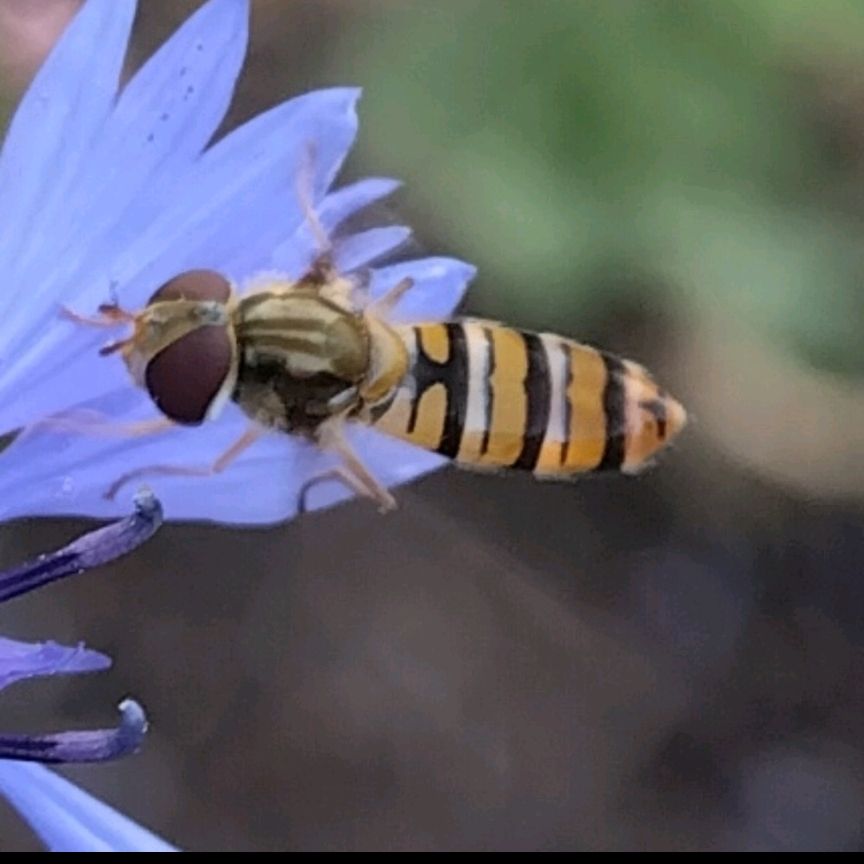
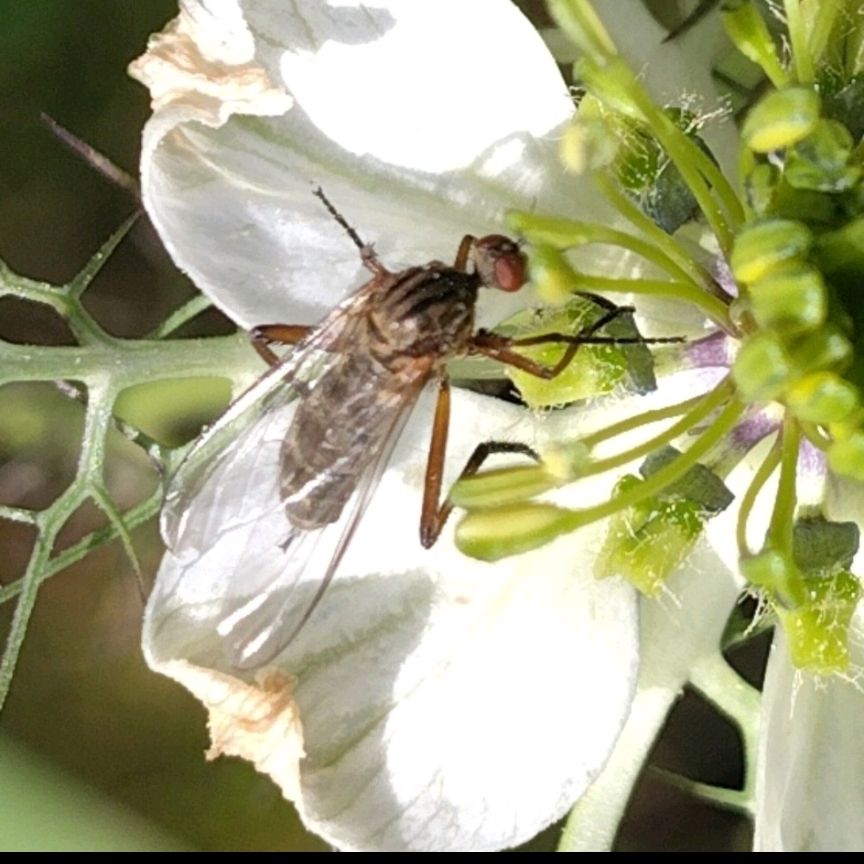
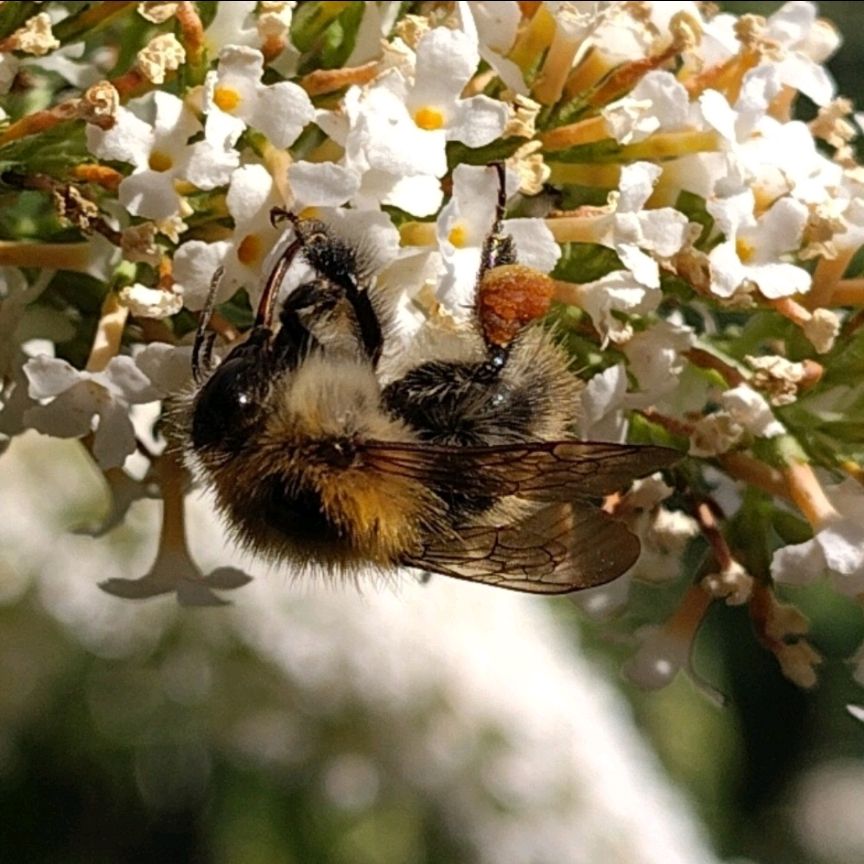
This app allows me to relive my insect nerd childhood days and I'm loving it 😍
play.google.com/store/apps/d...
play.google.com/store/apps/d...
July 5, 2025 at 3:12 PM
This app allows me to relive my insect nerd childhood days and I'm loving it 😍
play.google.com/store/apps/d...
play.google.com/store/apps/d...
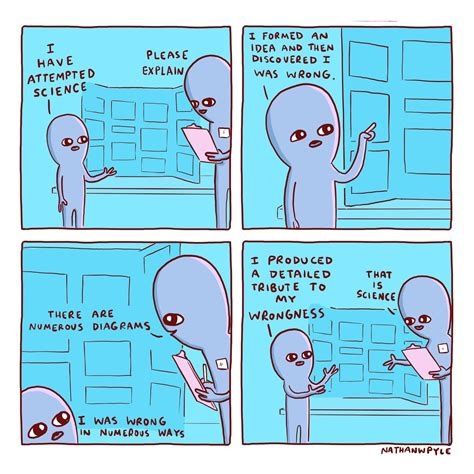
You can always use this comic from Nathan W. Pyle? 😄
June 25, 2025 at 5:39 PM
You can always use this comic from Nathan W. Pyle? 😄
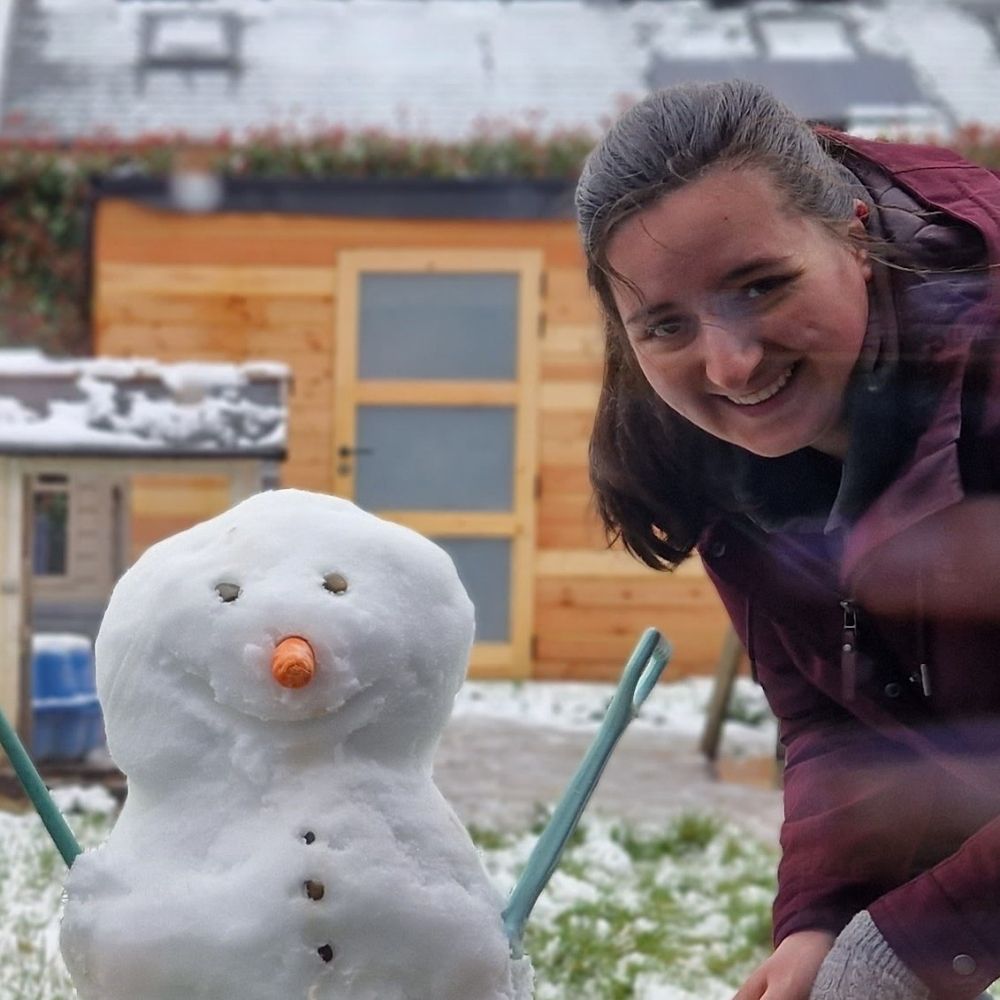
And we're back in business 😄
June 17, 2025 at 8:59 PM
And we're back in business 😄
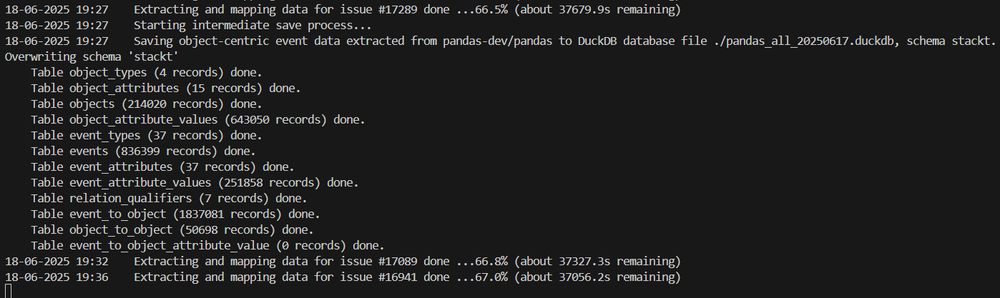
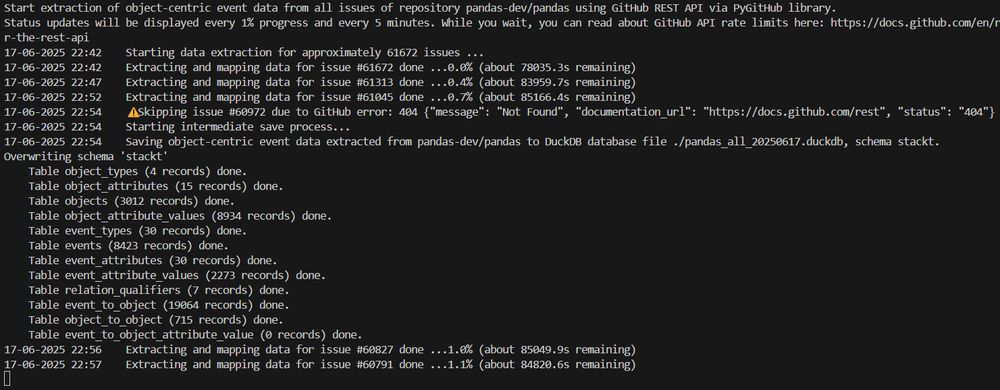
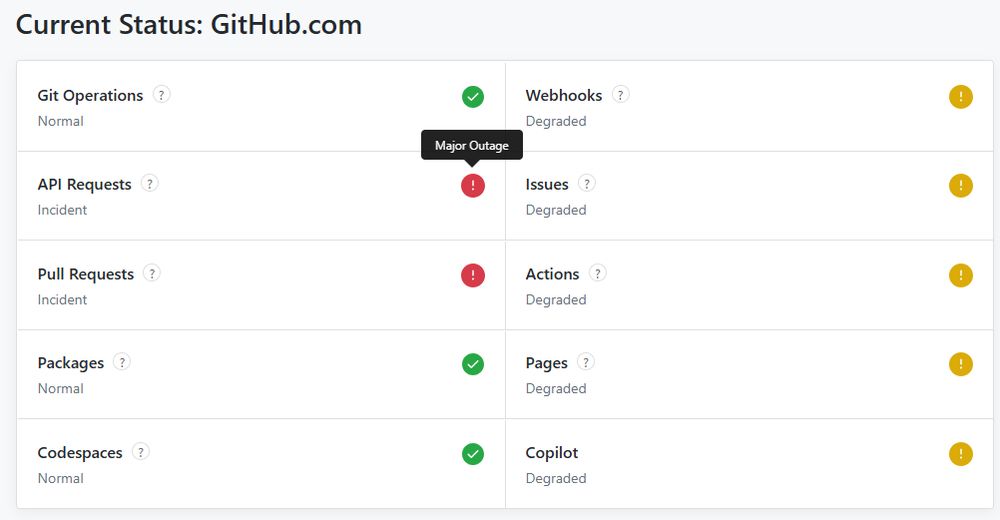
When you're 24 hours into an +- 30 hours stress-test data extraction and the GitHub API goes down, so it fails with a MaxRetryError 😭
June 17, 2025 at 8:06 PM
When you're 24 hours into an +- 30 hours stress-test data extraction and the GitHub API goes down, so it fails with a MaxRetryError 😭
@twisteddoodles.bsky.social didn't share this one here yet... so I'm sharing a screen grab because it made me giggle out loud in this conference season #databs

June 14, 2025 at 9:35 AM
@twisteddoodles.bsky.social didn't share this one here yet... so I'm sharing a screen grab because it made me giggle out loud in this conference season #databs

PyStack't v0.0.3 is now live!
For all the curious #databs minds that want to browse through the event data of their favorite open-source GitHub projects... Happy exploring! 😘
For the #processmining community desperate for real-life OCED data... Happy researching! 😘
pypi.org/project/pyst...
For all the curious #databs minds that want to browse through the event data of their favorite open-source GitHub projects... Happy exploring! 😘
For the #processmining community desperate for real-life OCED data... Happy researching! 😘
pypi.org/project/pyst...
May 20, 2025 at 9:25 PM
PyStack't v0.0.3 is now live!
For all the curious #databs minds that want to browse through the event data of their favorite open-source GitHub projects... Happy exploring! 😘
For the #processmining community desperate for real-life OCED data... Happy researching! 😘
pypi.org/project/pyst...
For all the curious #databs minds that want to browse through the event data of their favorite open-source GitHub projects... Happy exploring! 😘
For the #processmining community desperate for real-life OCED data... Happy researching! 😘
pypi.org/project/pyst...
PyStack't is getting some cool new functionality soon!
#databs #processmining
github.com/LienBosmans/...
#databs #processmining
github.com/LienBosmans/...
May 17, 2025 at 8:31 PM
PyStack't is getting some cool new functionality soon!
#databs #processmining
github.com/LienBosmans/...
#databs #processmining
github.com/LienBosmans/...
More colors! Less mess! Honestly, this is going great 😍

May 4, 2025 at 8:18 PM
More colors! Less mess! Honestly, this is going great 😍
My graph visualization project train arrived at station "nice from afar, messed up from up close", which holds true for real processes too so I think it's on the right track #databs


May 3, 2025 at 10:59 PM
My graph visualization project train arrived at station "nice from afar, messed up from up close", which holds true for real processes too so I think it's on the right track #databs
Building some cool shit! #databs
Or at least it will be cool... soon...ish?
Let's leave it at "I have good hopes that I will stick long enough with this attempt at creating interactive graph visualizations to create something fun that might even be interesting"
Or at least it will be cool... soon...ish?
Let's leave it at "I have good hopes that I will stick long enough with this attempt at creating interactive graph visualizations to create something fun that might even be interesting"

April 30, 2025 at 8:34 PM
Building some cool shit! #databs
Or at least it will be cool... soon...ish?
Let's leave it at "I have good hopes that I will stick long enough with this attempt at creating interactive graph visualizations to create something fun that might even be interesting"
Or at least it will be cool... soon...ish?
Let's leave it at "I have good hopes that I will stick long enough with this attempt at creating interactive graph visualizations to create something fun that might even be interesting"

Using AI to make coloring pages for the kids, because how would I otherwise find one of a "twinkling unicorn jumping over a tree stump with star shaped moss"

April 16, 2025 at 10:38 AM
Using AI to make coloring pages for the kids, because how would I otherwise find one of a "twinkling unicorn jumping over a tree stump with star shaped moss"


TL;DR version of PyStack't docs


March 10, 2025 at 2:00 PM
TL;DR version of PyStack't docs
Today I created a #slitherlink puzzle for the first time! It was lots of fun ☺️
I started by drawing a single loop for the solution and progressively gave myself more hints until I could solve it.
If you print it, you can try to solve it yourself (not sure what's the difficulty level though 😅)
I started by drawing a single loop for the solution and progressively gave myself more hints until I could solve it.
If you print it, you can try to solve it yourself (not sure what's the difficulty level though 😅)

January 25, 2025 at 8:28 PM
Today I created a #slitherlink puzzle for the first time! It was lots of fun ☺️
I started by drawing a single loop for the solution and progressively gave myself more hints until I could solve it.
If you print it, you can try to solve it yourself (not sure what's the difficulty level though 😅)
I started by drawing a single loop for the solution and progressively gave myself more hints until I could solve it.
If you print it, you can try to solve it yourself (not sure what's the difficulty level though 😅)
But how will you know which beer you're drinking if all the glasses look the same? Sincerely, a concerned Belgian

January 10, 2025 at 4:59 PM
But how will you know which beer you're drinking if all the glasses look the same? Sincerely, a concerned Belgian